Content
-
Weekly Highlights
- Market Commentary
- Durable Goods
- Upside & Downside Risks


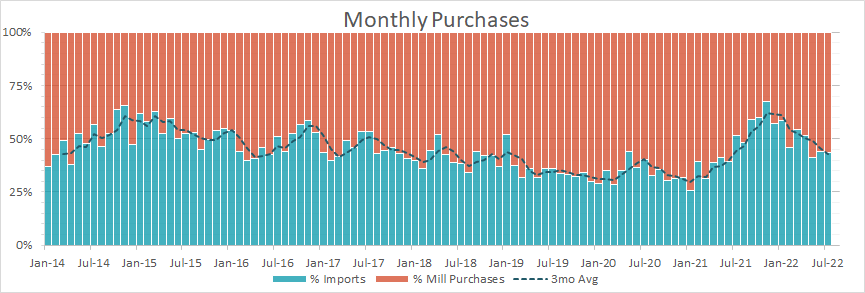
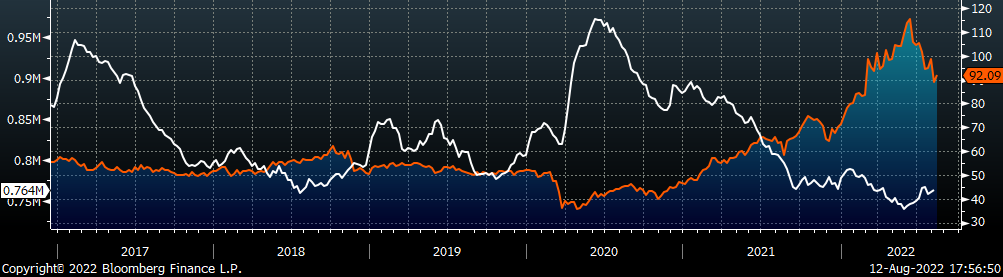
Import versus mill purchase market dynamics continue to be favorable for the mills. However, buyers will need to destock further before this leverage can be fully captured. The chart below is a breakdown of the monthly purchases by service centers from either domestic mills (orange) or imports (blue) through the end of July. A sustained percentage of import buys above 50% reflects decreased bargaining power for domestic mills.
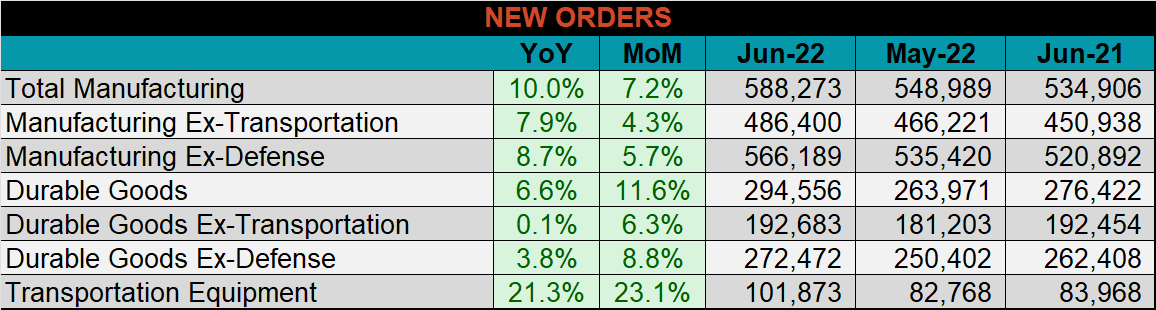
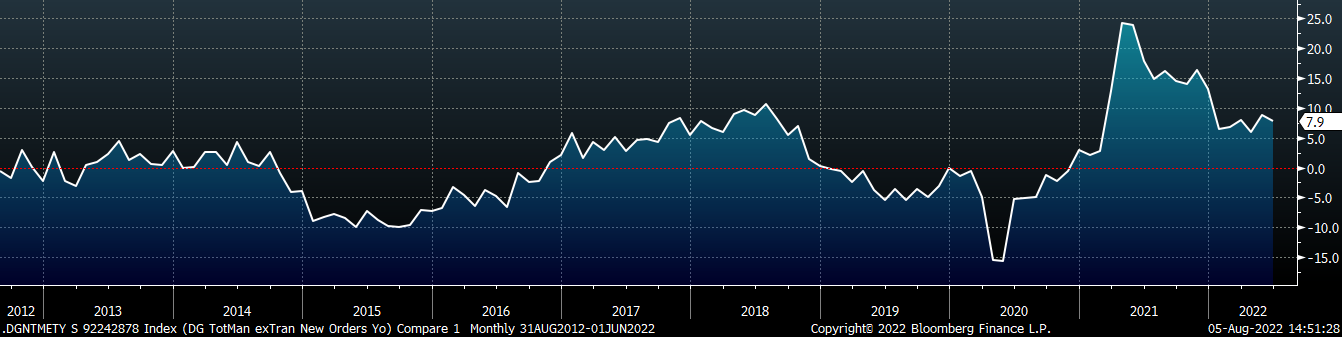
Below are final June new orders from the Durable Goods report, which were up compared to both May and June of last year. Transportation Equipment new orders were up 8.8% compared to April and 4.1% compared to May of last year. The main takeaway from the report is that OEM activity remains strong, although the data is lagged it is an encouraging sign of increased activity.
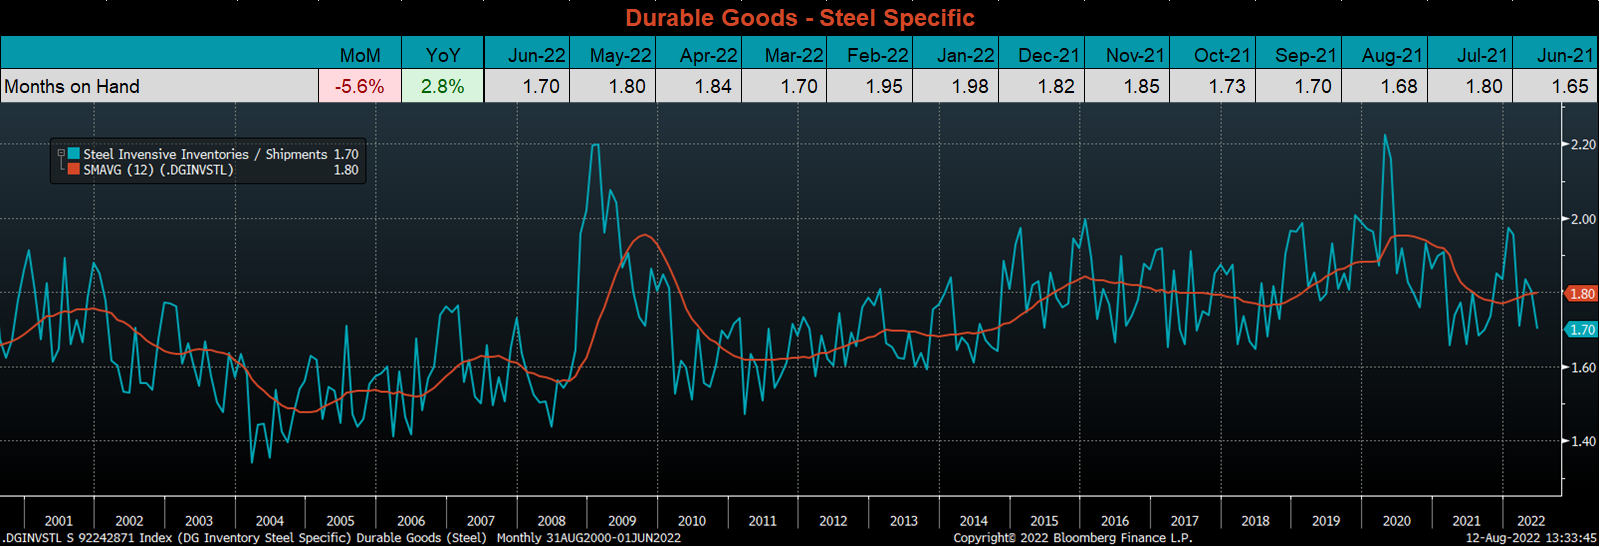
The chart below looks at the months on hand (inventory divided by shipments) for durable goods categories that are steel intensive. MoH moved lower for the second month in a row, driven by a 0.9% decrease in inventories and a 5% increase in shipments. If destocking at OEMs continues, it will be a positive for the domestic steel price because mills will be able to use their buyer share leverage. An important note of caution, however, is that the global demand outlook is far worse than what we see in the U.S. If a domestic price rally starts before demand in China and Europe are stabilized, we would expect an increase in import arrivals and a ceiling on domestic prices.
Below are the most pertinent upside and downside price risks:
Upside Risks:
Downside Risks:
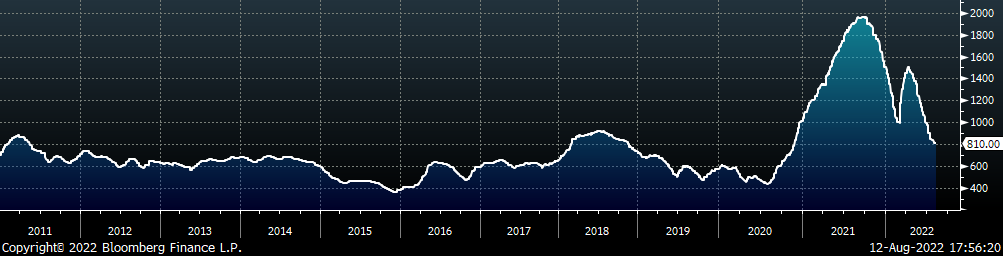
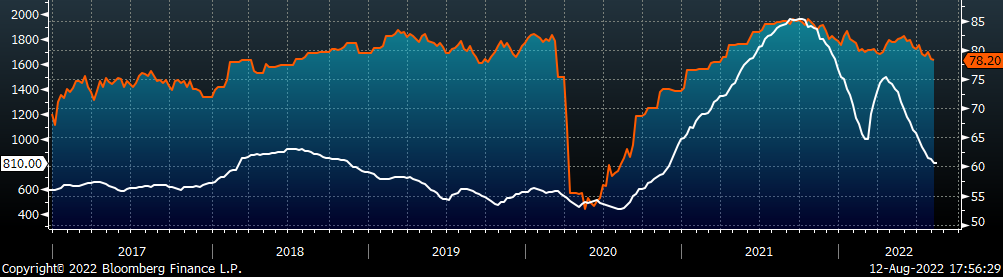
The Platts TSI Daily Midwest HRC Index was unchanged at $810. This is the first time in 16 weeks that steel prices held steady and did not fall.
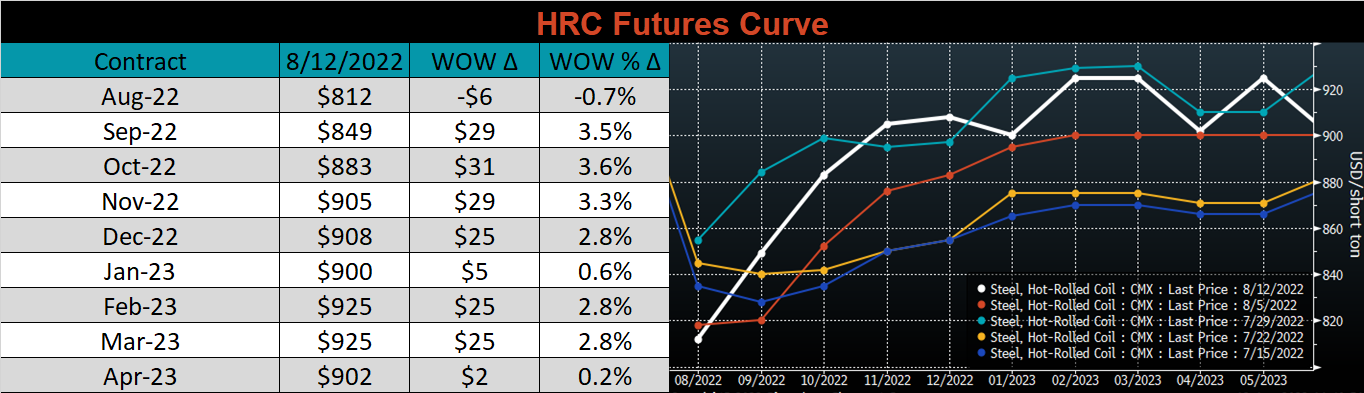
The CME Midwest HRC futures curve is above last Friday’s settlements in orange. The curve rebounded last week but did not meaningfully break above prices from two weeks prior.
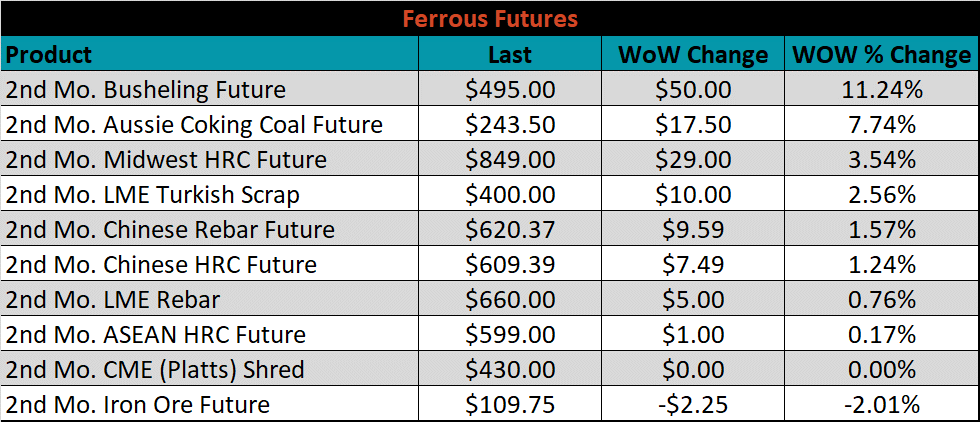
The 2nd month ferrous futures ended the week mostly higher led by Busheling, which gained 11.2%, while iron ore lost 2%.
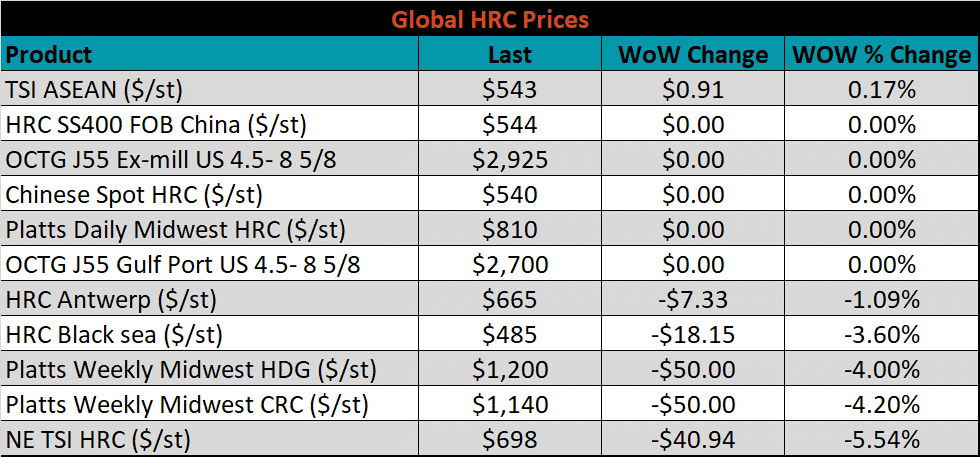
Global flat rolled indexes moved mostly lower, led by Northern European HRC down another 5.5%, while ASEAN HRC was slightly higher, up 0.2%.
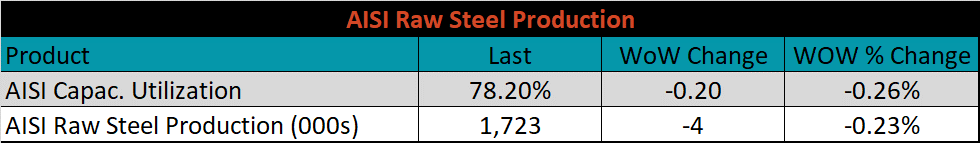
The AISI Capacity Utilization was down another 0.2% to 78.2%. This is the lowest capacity utilization level since May of 2021.
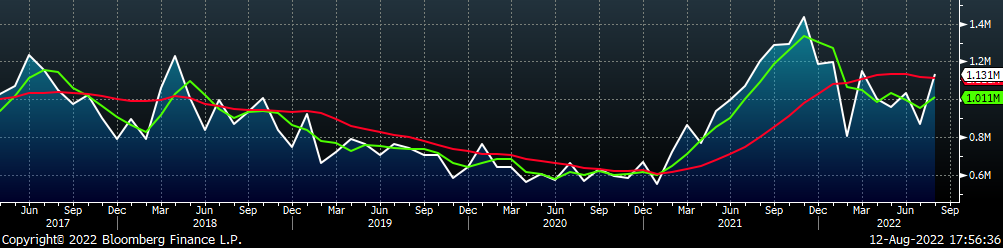
August flat rolled import license data is forecasting a sharp increase of 264k to 1,131k MoM.
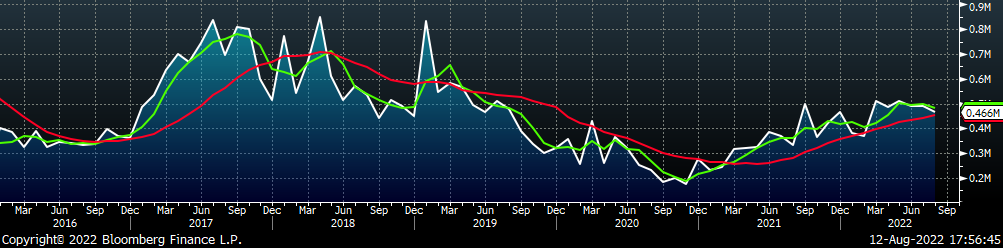
Tube imports license data is forecasting a decrease of 23k to 466k in August.
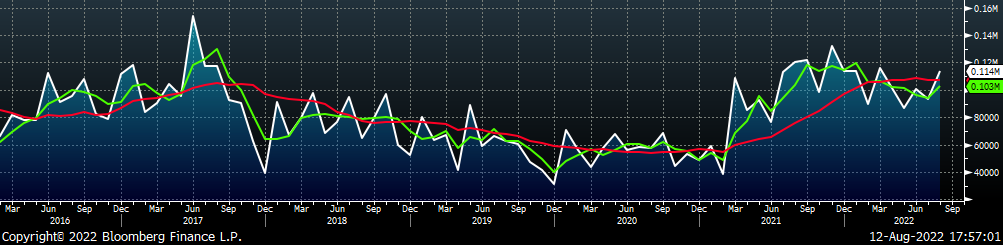
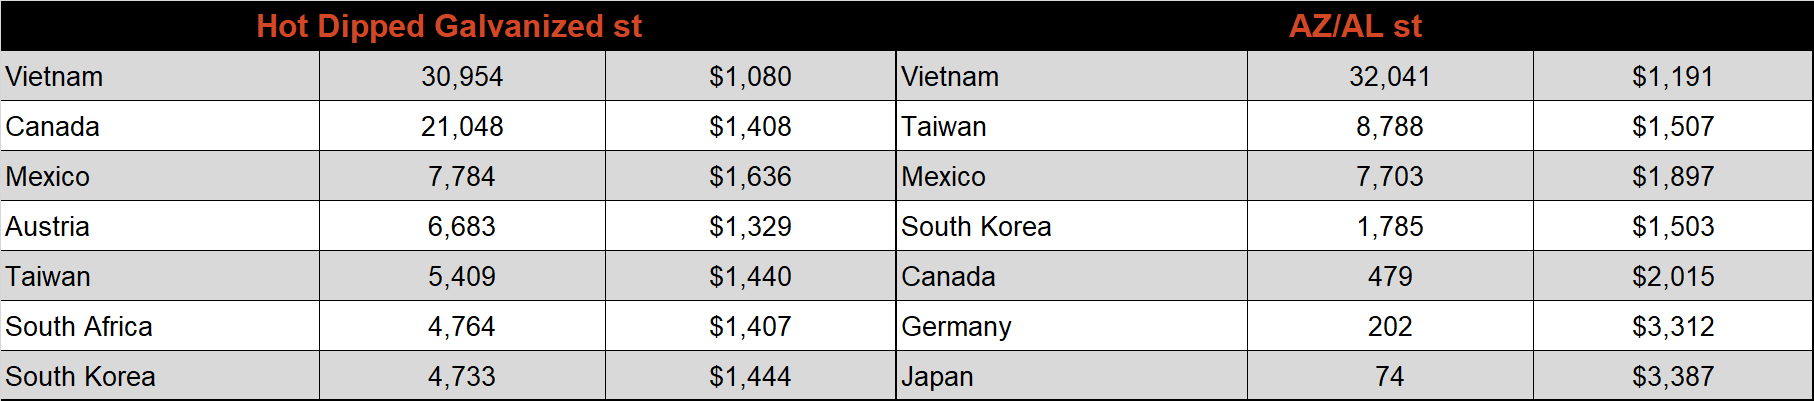
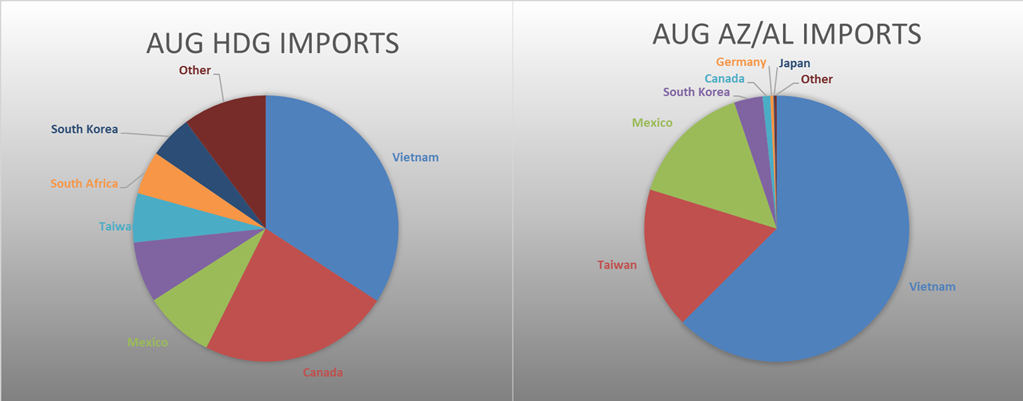
August AZ/AL import license data is forecasting a decrease of 20k to 114k.
Below is June import license data through August 8th, 2022.
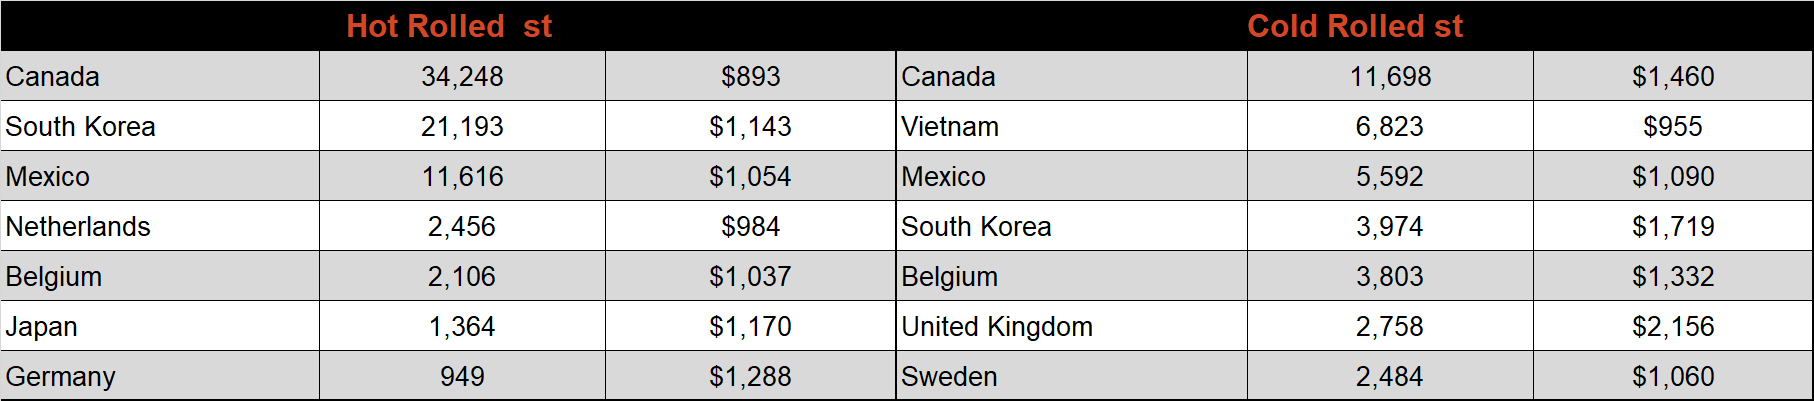
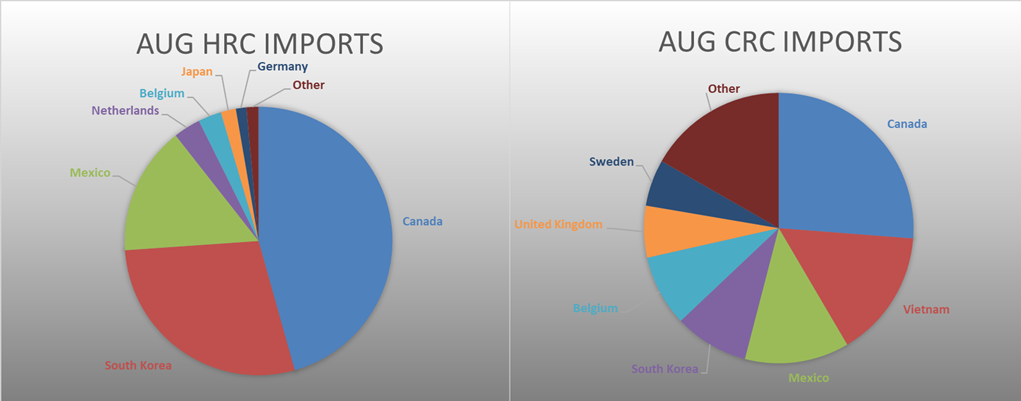
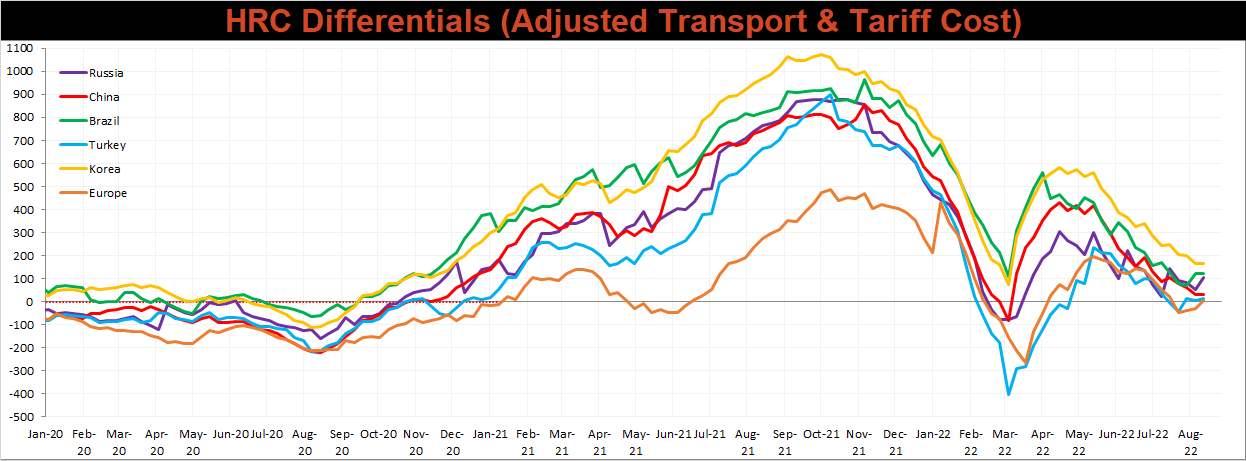
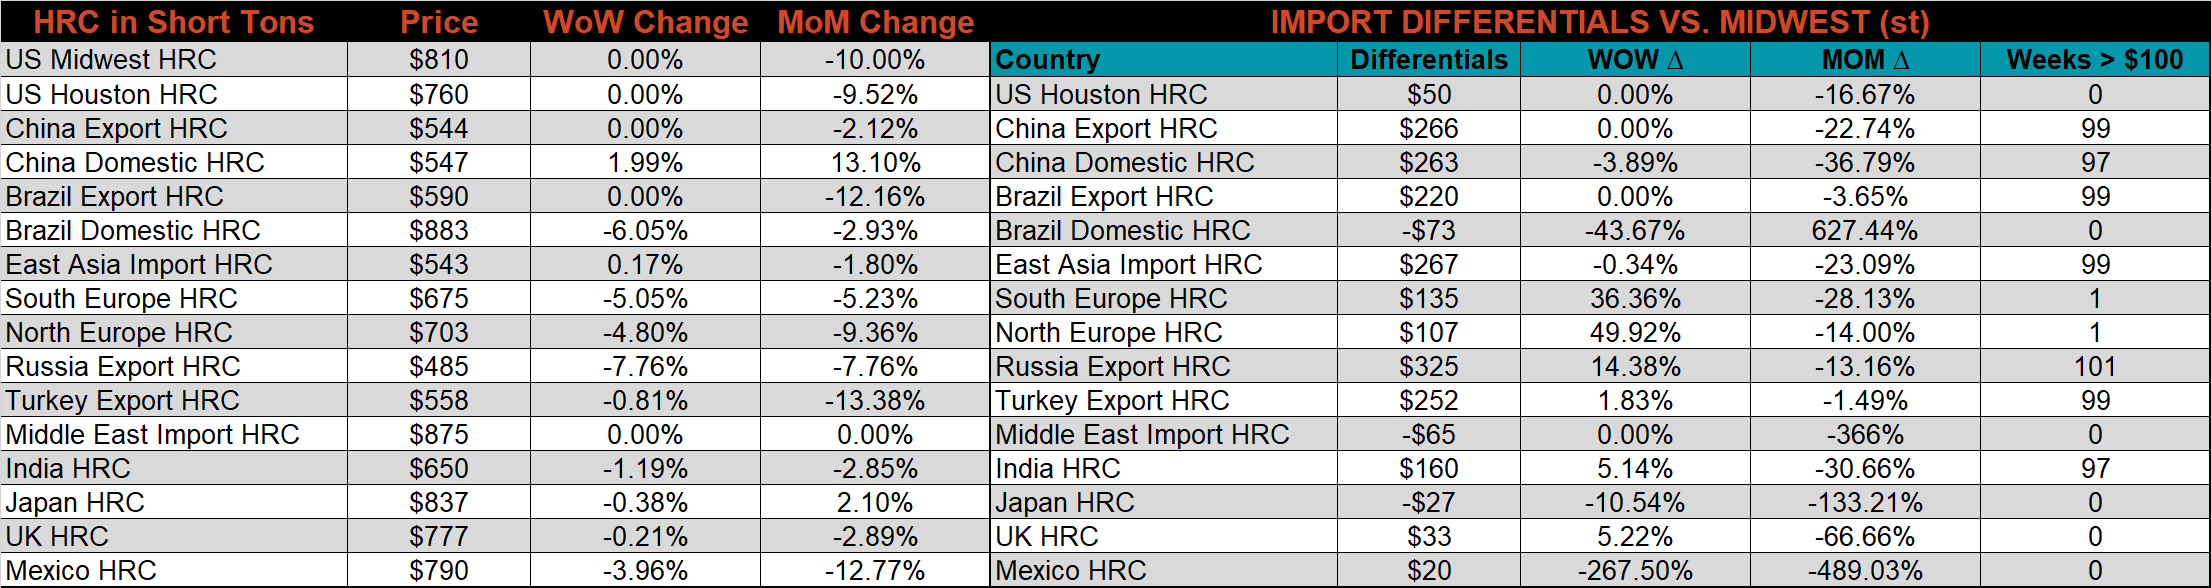
Below is the Midwest HRC price vs. each listed country’s export price using pricing from SBB Platts. We have adjusted each export price to include any tariff or transportation cost to get a comparable delivered price. Differentials Europe and Russia, while each of the other prices were all unchanged compared to last week.
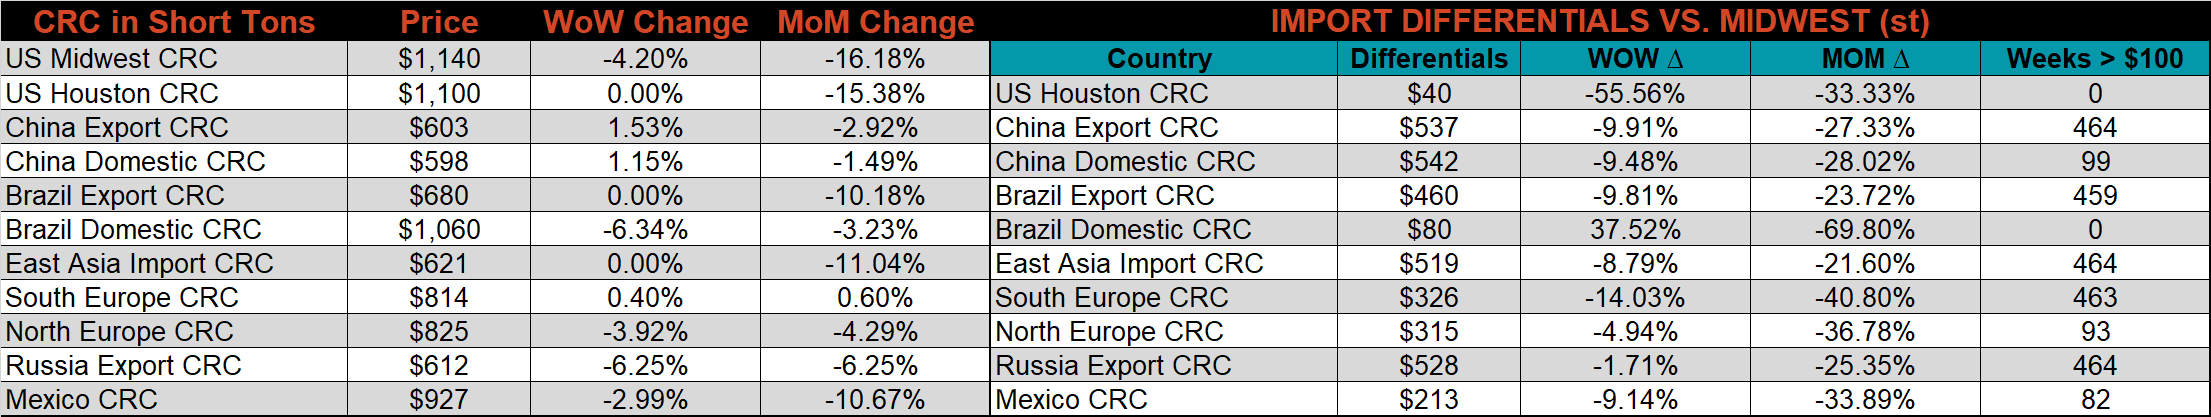
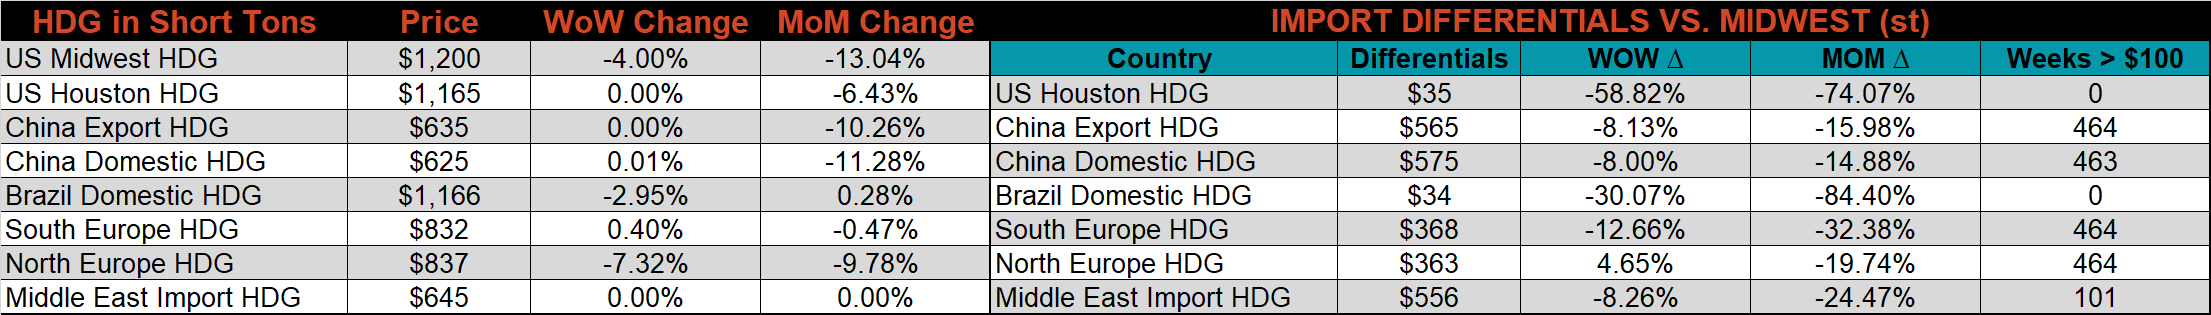
SBB Platt’s HRC, CRC, and HDG pricing is below. The Midwest CRC, & HDG prices were down 4.2%, and 4%, respectively, while HRC was unchanged.
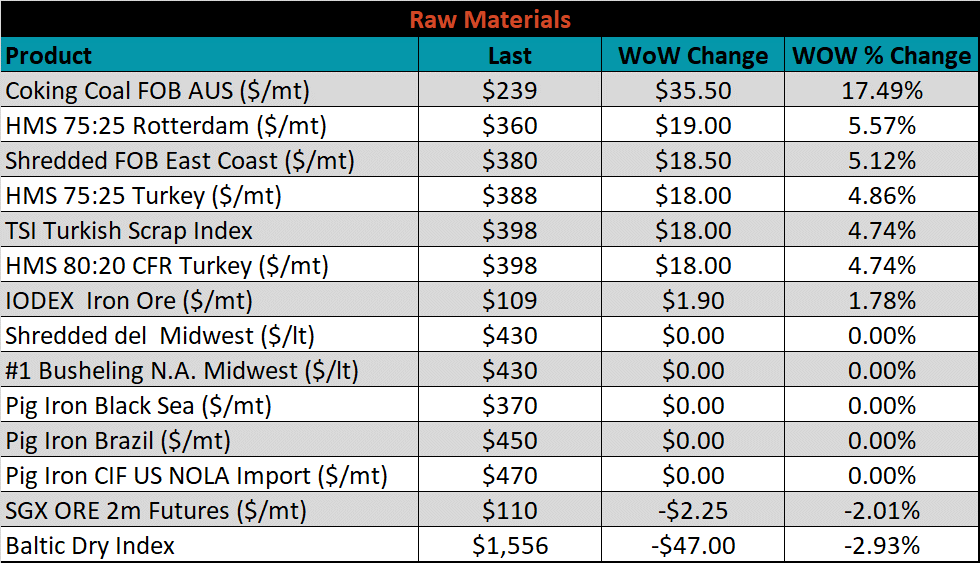
Raw material prices were mixed last week, with Aussie coking coal up 17.5%, while iron ore futures lost 2%.
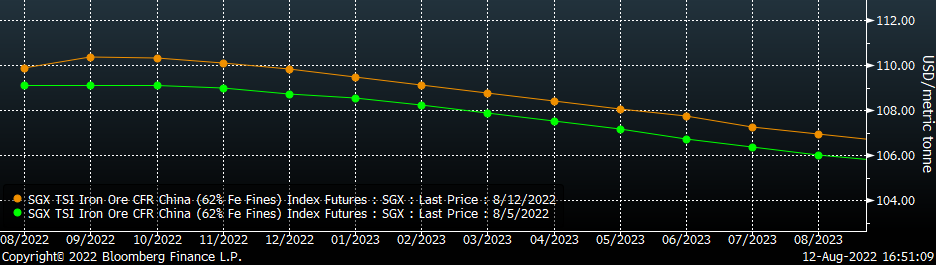
Below is the iron ore future curve with Friday’s settlements in orange, and the prior week’s settlements in green. Last week, the entire curve shifted slightly higher.
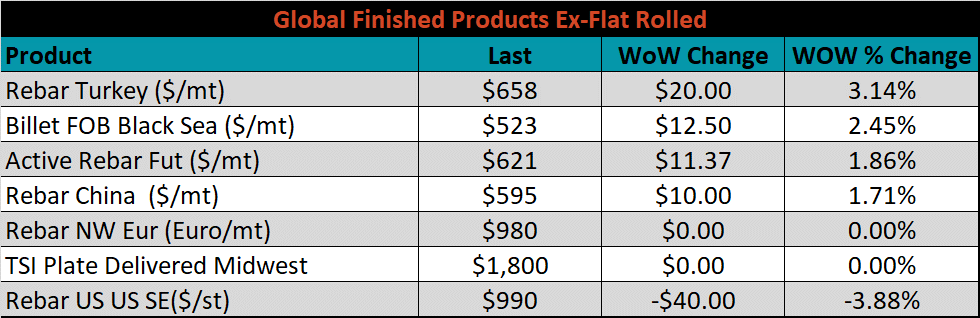
The ex-flat rolled prices are listed below.

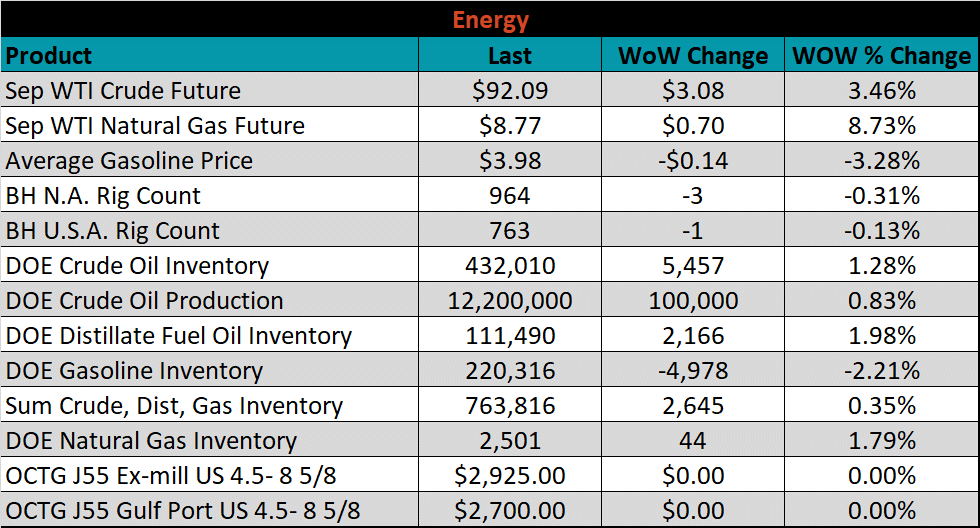
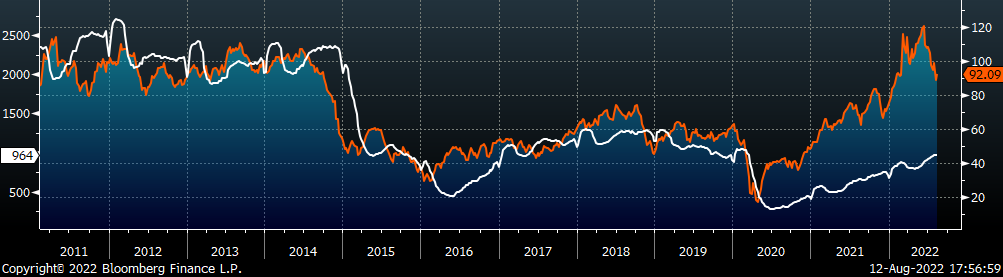
Last week, the September WTI crude oil future gained $3.08 or 3.5% to $92.09/bbl. The aggregate inventory level increased another 0.3%. The Baker Hughes North American rig count decreased 3 rigs, while the U.S. rig count decreased 1 rig.
The list below details some upside and downside risks relevant to the steel industry. The bolded ones are occurring or highly likely.
Upside Risks:
Downside Risks: