Content
-
Weekly Highlights
- Market Commentary
- Durable Goods
- Upside & Downside Risks


The physical steel market continued to march higher, driven by hand-to-mouth buying as a result of stable demand and the structural shortage. As of late last week, mills are no longer taking requests for September production, while pausing before offering any sizable October tons. Downstream bottlenecks continue to disrupt supply chain efficiency as subsectors across the steel buying community continue to experience labor and parts shortages. Additionally, with planned mill outages around the corner, it appears that large segments of the market have already written off the remainder of 2021 from a supply standpoint and have shifted attention to next year. The combination of these dynamics points to a continuation of the overall trend of higher prices for longer until there is a rebalancing of supply and demand. A significant upside risk that must be considered is unplanned outages, like that of US Steel’s Gary Works, which was a big surprise to the market and caused the HRC futures curve to jump in 4Q 2021. The remainder of this week’s report will look at the June durable goods, which is further confirmation of recent trends in the economic data from last week’s report.
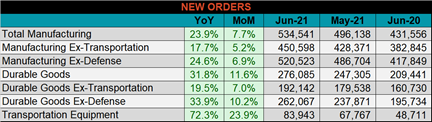
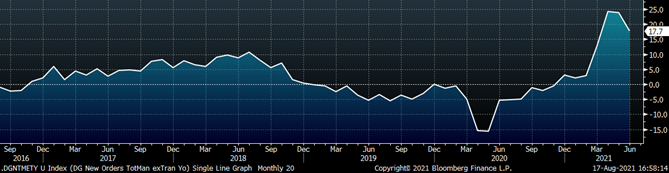
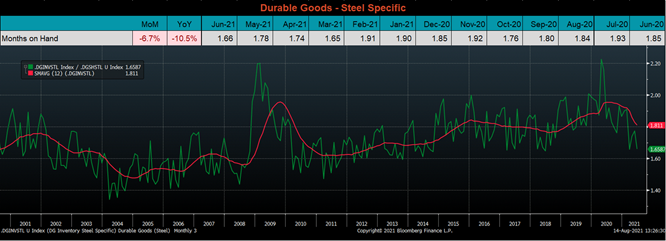
Below are final June new orders from the Durable Goods report. New orders for manufactured goods were up 23.9% compared to June 2020 and up 7.7% compared to May 2021. Manufacturing ex-transportation new orders were up 17.7% compared to June 2020 and 5.2% higher than in May. The final chart looks at the months on hand (inventory divided by shipments) for durable goods categories that are steel intensive. MOH moved significantly lower and is just above the recent low from March of this year. This move lower was driven by an increase in shipments, compared to relatively unchanged inventories. This is emblematic of the broad steel market’s reluctance to restock. The most likely result of tight inventories is increased volatility for steel prices as near-term demand will dictate price jumps higher. Our current outlook remains bullish on demand, however, if demand slips, mill profitability, metal spreads and global differentials are all at record highs, which leaves more than enough room for negotiation if mills want to move their tons.
Below are the most pertinent upside and downside price risks:
Upside Risks:
Downside Risks:
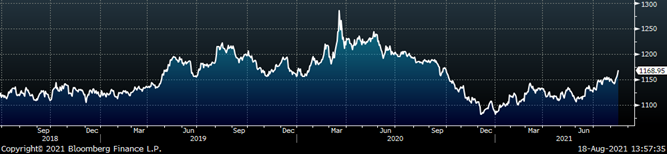
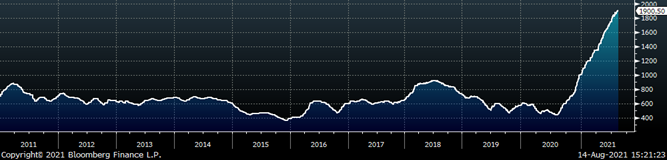
The Platts TSI Daily Midwest HRC Index increased by $13.25 to $1,900.50.
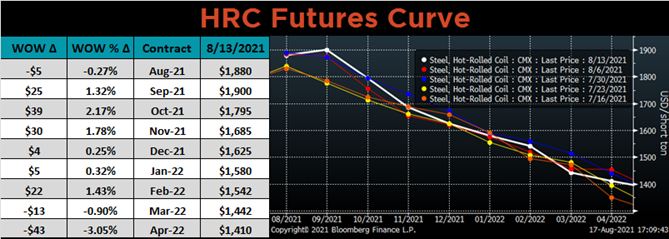
The CME Midwest HRC futures curve is below with last Friday’s settlements in white. Last week, the front of the curve shifted higher, while the back was down slightly.
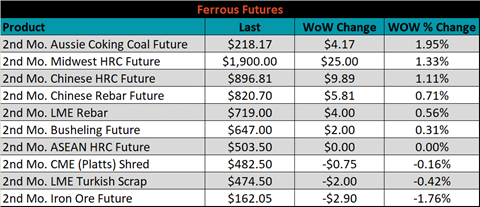
September ferrous futures were mixed. Aussie coking coal future gained another 2%, while iron ore lost 1.8%.
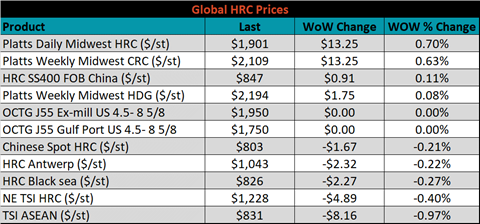
Global flat rolled indexes were mixed. The TSI Platts Midwest HRC price was up another 0.7%, while the TSI ASEAN HRC export price was down 1%.
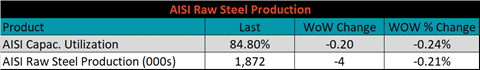
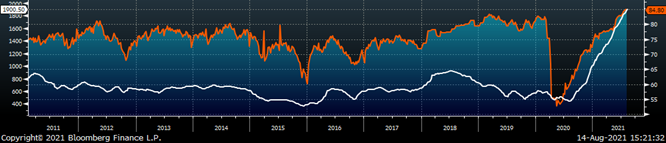
The AISI Capacity Utilization rate decreased 0.2% to 84.8%.
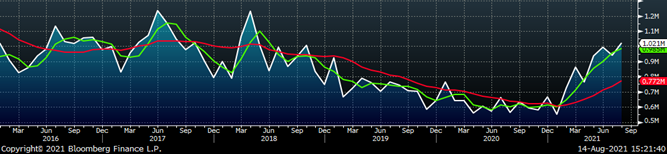
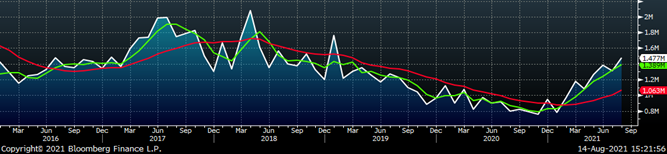
August flat rolled import license data is forecasting an increase of 79k to 1.02m MoM.
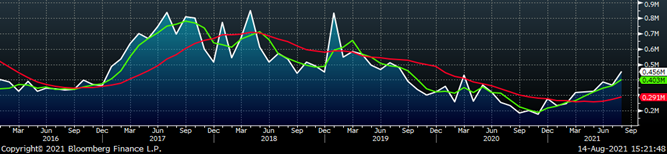
Tube imports license data is forecasting an increase of 90k to 456k in August.
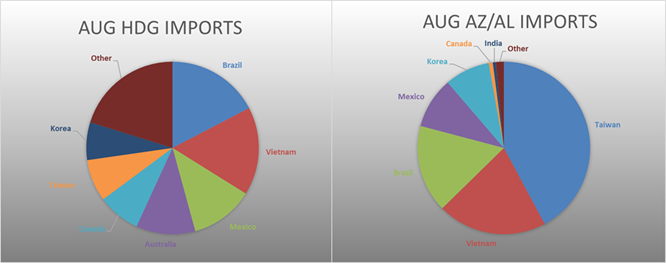
August AZ/AL import license data is forecasting an increase of 44k to 151k.
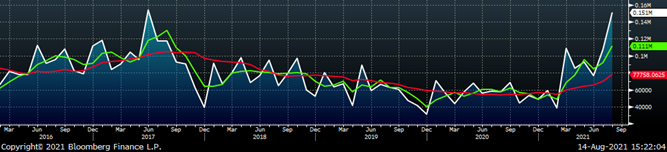
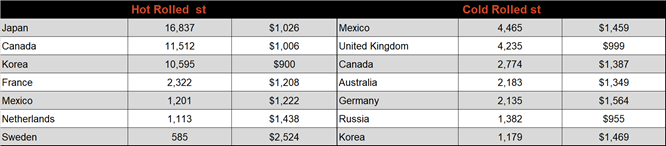
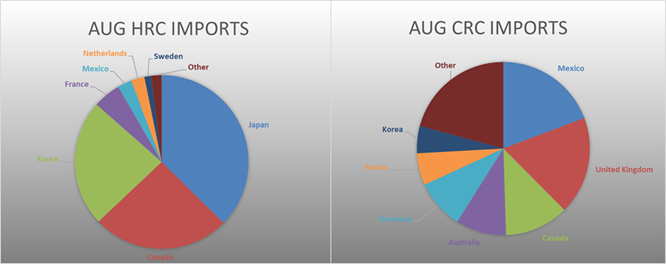
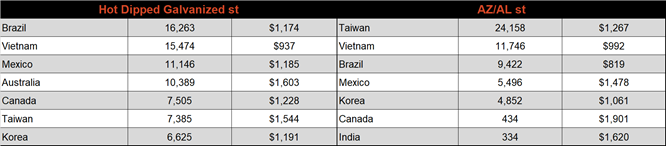
Below is August import license data through August 9th, 2021.
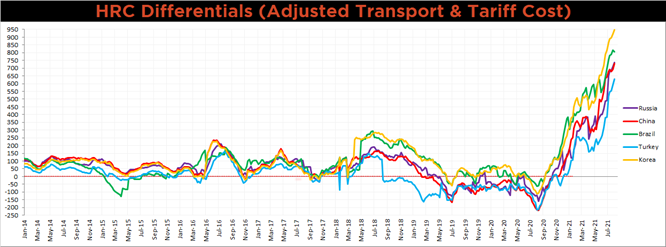
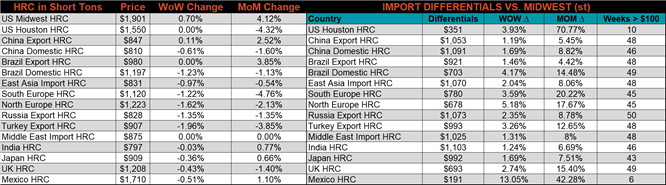
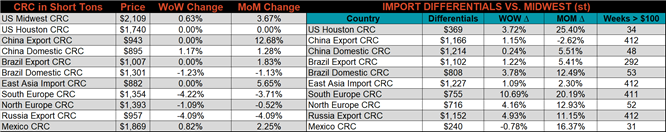
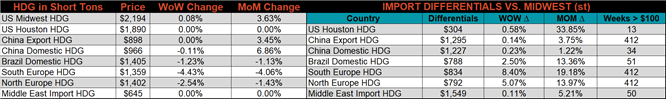
Below is the Midwest HRC price vs. each listed country’s export price using pricing from SBB Platts. We have adjusted each export price to include any tariff or transportation cost to get a comparable delivered price. Differentials for all watched countries increased further this week, as the U.S. price continues grinding higher.
SBB Platt’s HRC, CRC and HDG pricing is below. The Midwest HRC, CRC, & HDG prices were up, 0.7%, 0.6% and 0.1%, respectively. Globally, the Southern European CRC price was down 4.2%.
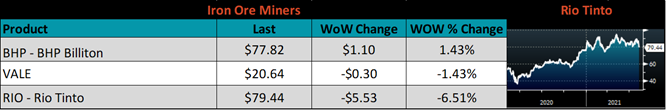
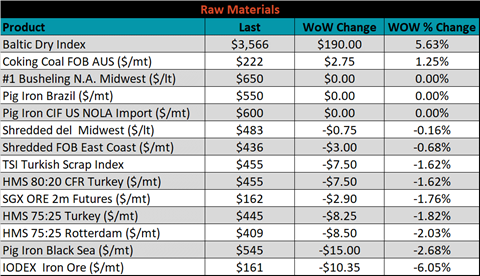
Raw material prices were mostly lower, led by the IODEX iron ore index, down 6.1%, while Aussie coking coal rose another 1.3%.
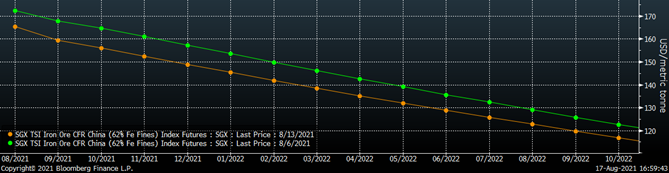
Below is the iron ore future curve with Friday’s settlements in orange, and the prior week’s settlements in green. Last week, the entire curve continued it’s 4 week decline and shifted another step lower.
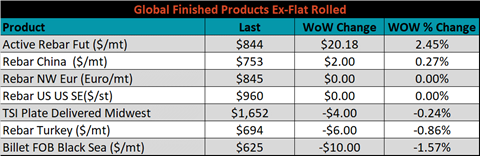
The ex-flat rolled prices are listed below.

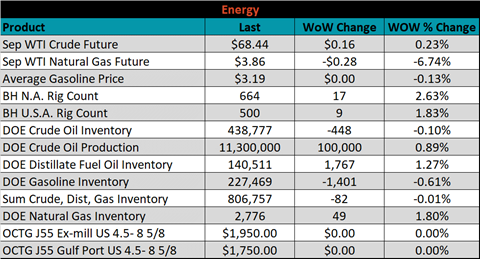
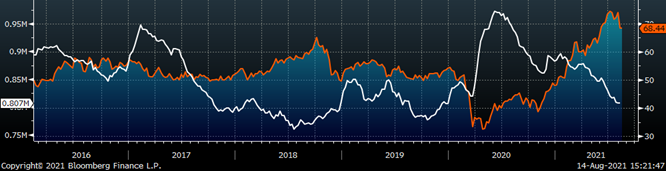
Last week, the September WTI crude oil future was up $0.16 or 0.23% to $68.44/bbl. The aggregate inventory level was unchanged, while crude oil production rose to 11.3m bbl/day. The Baker Hughes North American rig count was up 17 rigs, and the U.S. rig count was up 9 rigs.
The list below details some upside and downside risks relevant to the steel industry. The orange ones are occurring or look to be highly likely. The upside risks look to be in control.
Upside Risks:
Downside Risks: