Content
-
Weekly Highlights
- Market Commentary
- Durable Goods
- Risks


Spot HRC prices rose again last week, solidifying the narrative that the near term bottom has been reached and prices are starting an upcycle. Mini mills have raised offer prices for HRC inquiries to near $480, joining integrated mills at the higher prices. Mills have pointed to extended lead times as justification for higher prices, with most September HRC order books already full. This is unsurprising as low pricing over the last few weeks caused a flurry of spot buying and contract buyers maxing out their tonnage placed at discounted prices. Interestingly, these higher offer prices were not preceded by an official price increase announcement. While it is too early to tell if there will be physical transactions at these higher levels to support further price increases, this week we will dive into how high prices are expected rise this cycle.
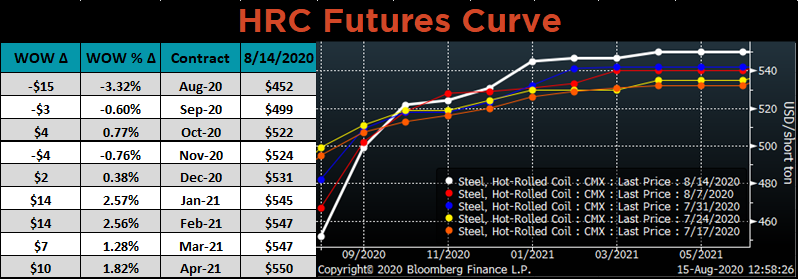
Market sentiment can play a large roll in commodity price cycles, and the steel market is no different. Buyers tend to pay high prices for more tons when they expect that the price will be even higher when the material arrives in the following weeks. The best gauge of market expectations is the future curve, which displays prices that market participants have agreed to transact in future months. The below chart shows the domestic HRC futures curve as of last Friday.

From the current spot price, the curve is displaying expectations for prices to increase $50/st over the next month, plus an additional $30/st through the end of the year. Looking further out on the curve, 2021 is priced near $550, representing a $100/st increase from current spot pricing. There are several current market dynamics that we can point to for justification of the expected price rally including increasing raw material prices, global industrial metal and HRC strength, the weakening US currency and the general economic recovery from the pandemic induced shutdowns.
However, the strength of the price rally will be based on inventory levels and material needs at both service centers and end users. Service centers have been destocking since the spring, but the recent low prices appear to have spurred buying interest, making restocking in the months ahead at higher prices unnecessary and unlikely. From the steel consumer’s perspective, buying at higher prices will only occur for material that is absolutely needed for near term projects and/or sales. With the current economic uncertainty, it is unlikely that they will carry large inventory levels into the end of the year. Along with this apprehension among buyers, new and idled production is set to come online near the end of the year, creating a massive headwind for a sustained price rally in the absence of incremental demand. With that being said, near term market dynamics support higher prices in the weeks and months ahead.

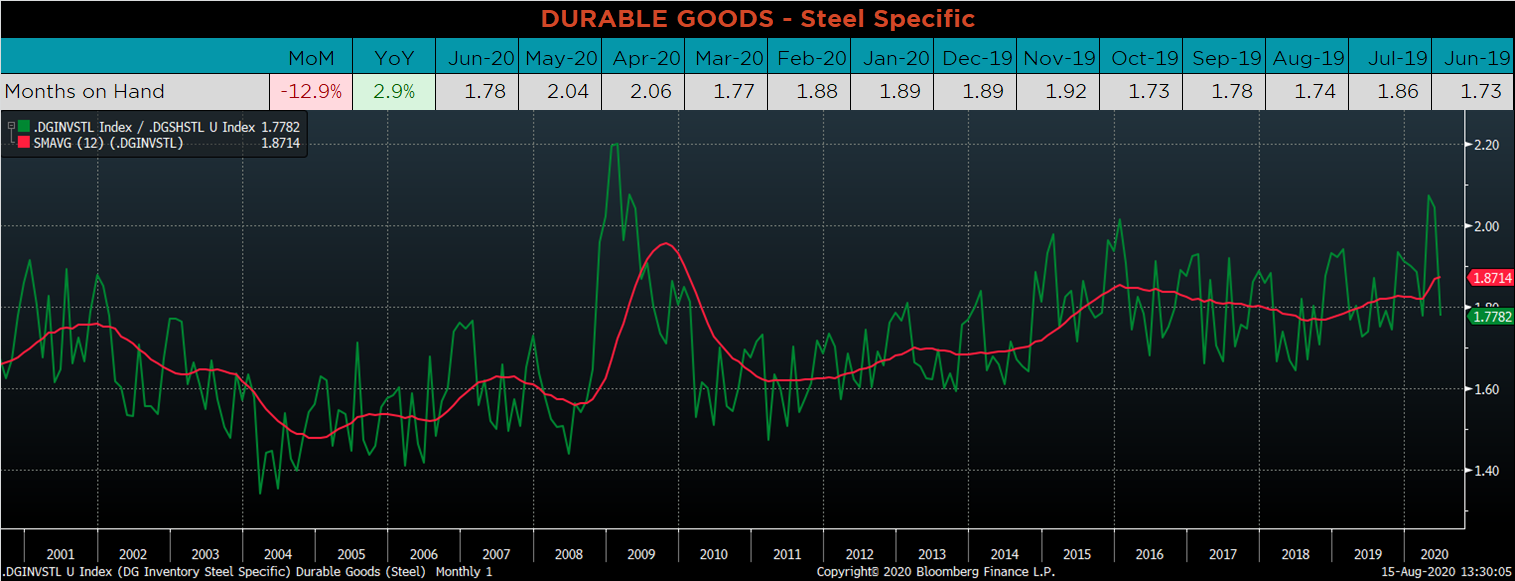
Below are final June new orders from the Durable Goods report. While new orders for manufactured goods remain well below June 2019, they continue to improve dramatically compared to recent lows in April and May. Manufacturing new orders ex-transportation decreased 4.8% YoY. The final chart looks at the months on hand (inventory divided by shipments) for durable goods categories that are steel intensive. MOH fell back in line, as inventories decreased to their lowest level since March 2018 and monthly shipments increased.



Below are the most pertinent upside and downside price risks:
Upside Risks:
Downside Risks:

The Platts TSI Daily Midwest HRC Index was up $6.50 to $450.25.

The CME Midwest HRC futures curve is below with last Friday’s settlements in white. The back of the curve moved $10-15 higher.
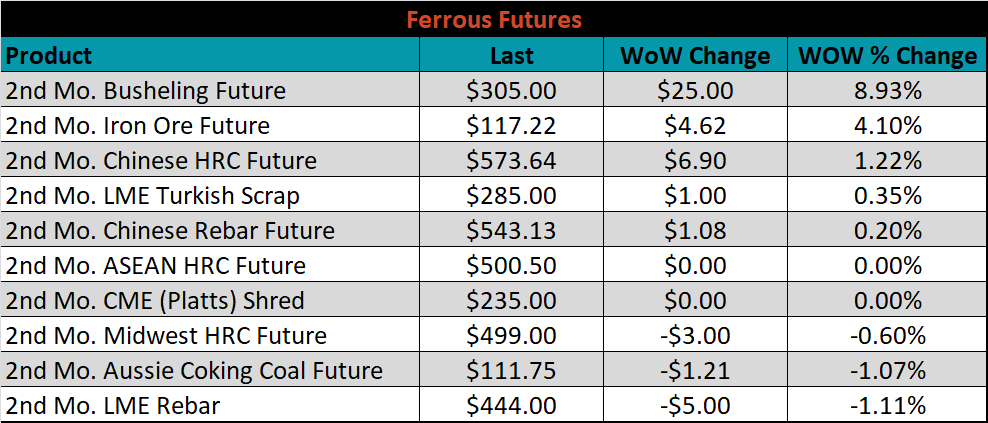
September ferrous futures were mixed. Busheling gained 8.9%, while LME rebar lost 1.1%.
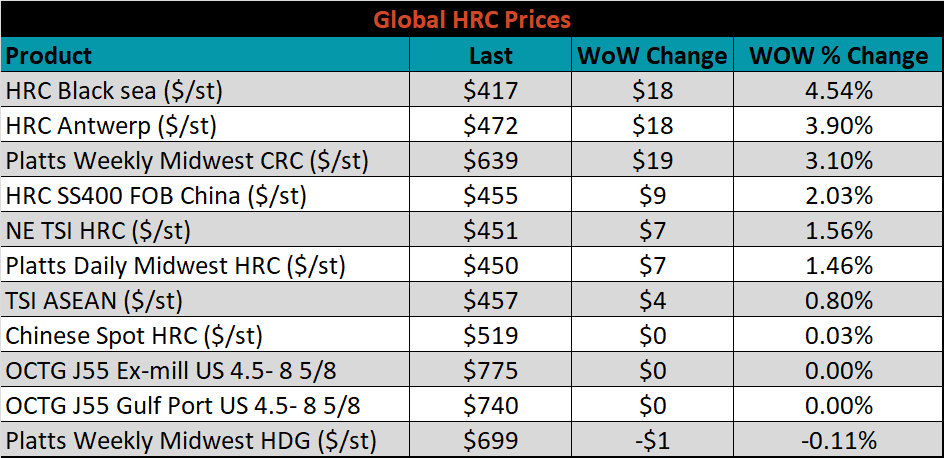
The global flat rolled indexes were mostly higher, led by Black Sea HRC, up 4.5%; while TSI Midwest HDG was down 0.1%.
The AISI Capacity Utilization Rate was up another 1.1% to 60.4%.


August flat rolled import license data is forecasting a decrease of 62k to 609k MoM.

Tube imports license data is forecasting a MoM increase of 16k to 262k tons in August.


August AZ/AL import license data is forecasting an increase of 15k to 73k MoM.

Below is July import license data through August 11, 2020.

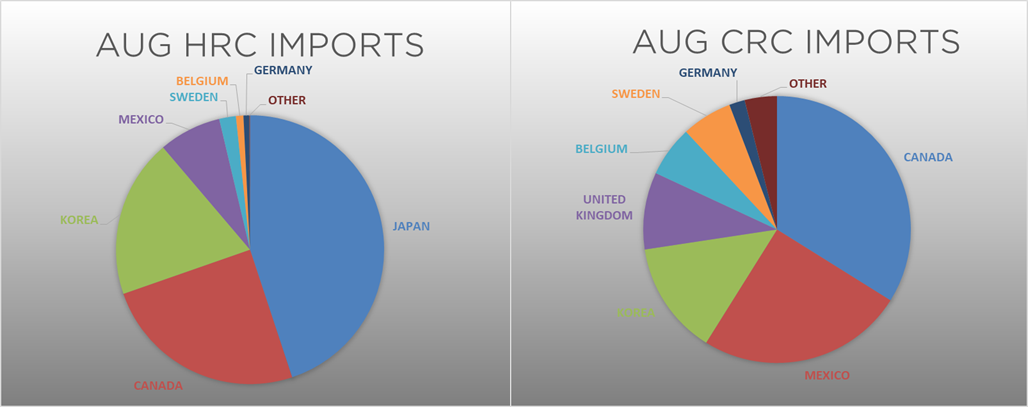

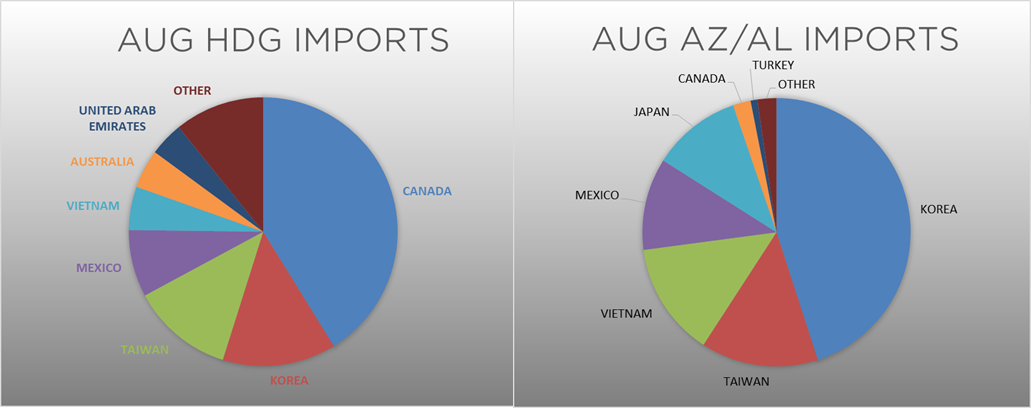
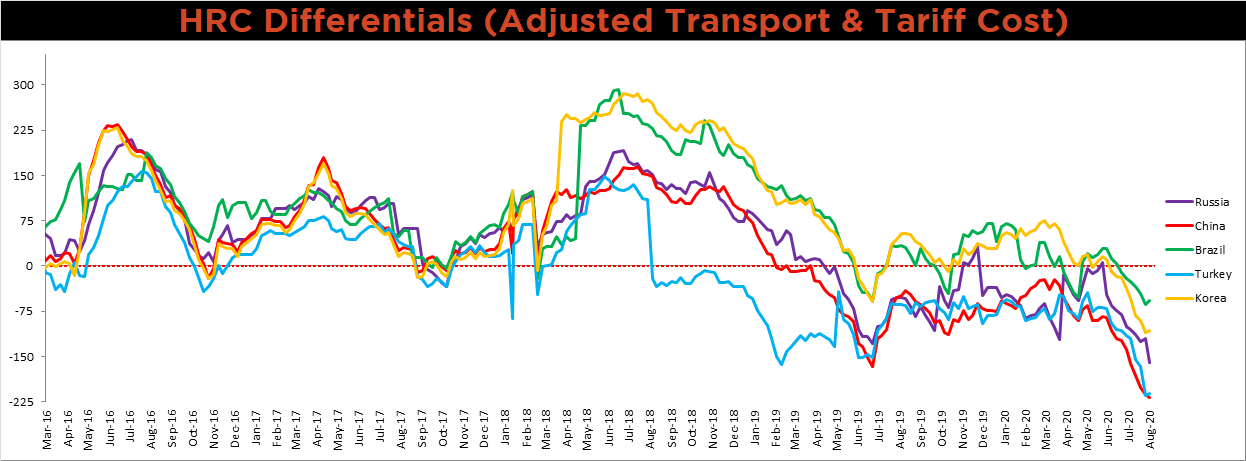
Below is the Midwest HRC price vs. each listed country’s export price using pricing from SBB Platts. We have adjusted each export price to include any tariff or transportation cost to get a comparable delivered price. The Turkish, Korean and Brazilian differentials all increased for the first time since May. The Chinese and Russian differential decreased as both countries’ prices increased more than the U.S. price.
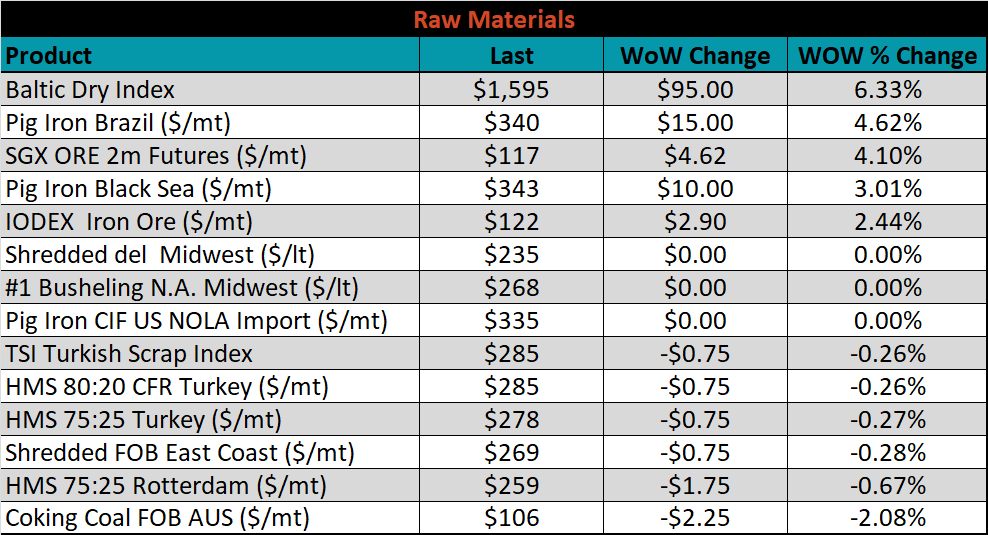
SBB Platt’s HRC, CRC and HDG pricing is below. The Midwest CRC, and HRC prices were up, 3.1% and 1.5%, respectively, while the HDG price was down 0.1%. Globally, the Russian export HRC and CRC prices were up, 9.8% and 8.7%, respectively.


Raw material prices were mixed. Brazilian pig iron was up 4.6%, while Australian coking coal was down 2.1%.
Below is the iron ore future curve with Friday’s settlements in orange, and the prior week’s settlements in green. The curve shifted slightly higher across all expirations.

The ex-flat rolled prices are listed below.


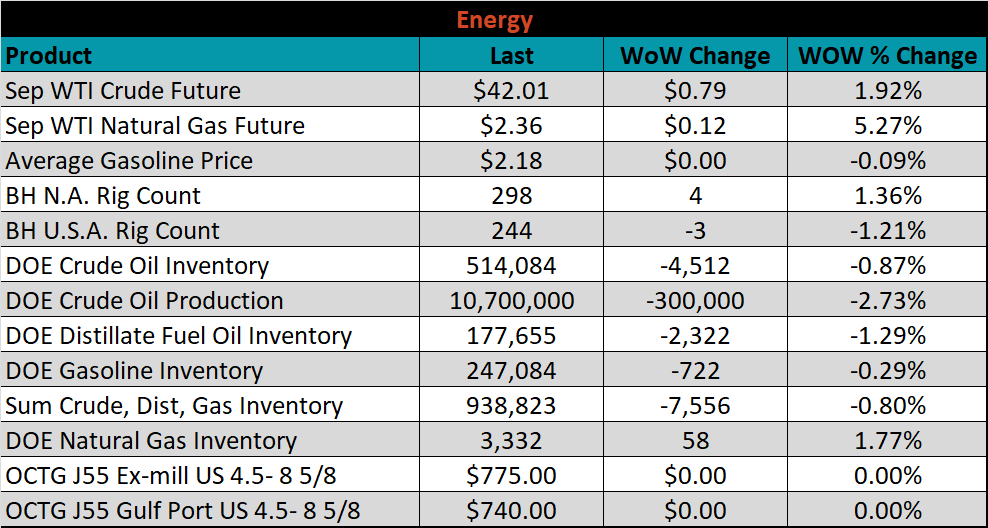
Last week, the September WTI crude oil future gained $0.79 or 1.9% to $42.01/bbl. The aggregate inventory level was down 0.8%, while crude oil production was down to 10.7m bbl/day. The Baker Hughes North American rig count was up four rigs, while the U.S. rig count was down three.


The list below details some upside and downside risks relevant to the steel industry. The orange ones are occurring or look to be highly likely. The upside risks look to be in control.
Upside Risks:
Downside Risks: