Content
-
Weekly Highlights
- Market Commentary
- Risks


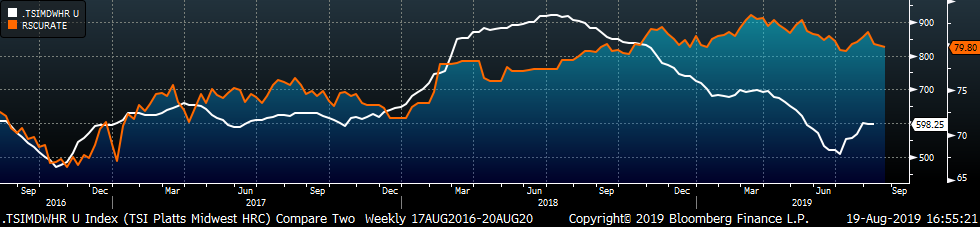
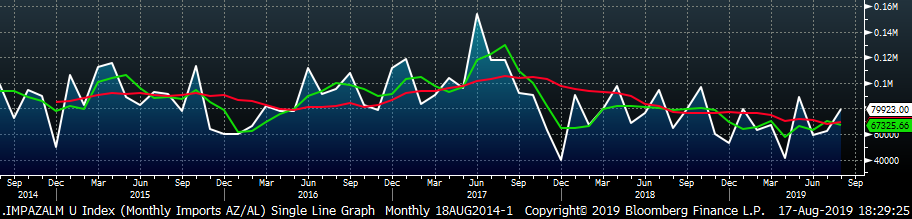
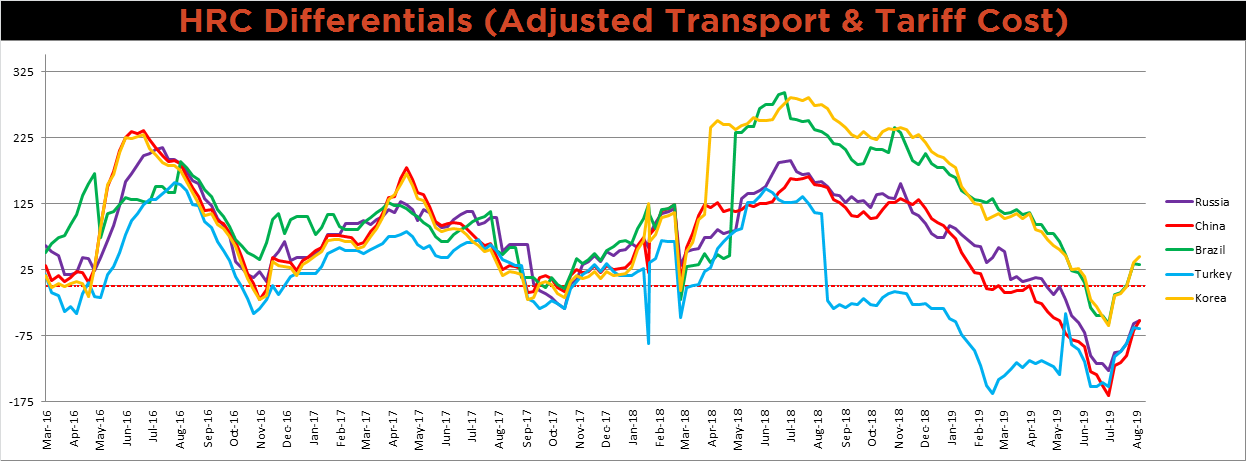
One of the indicators we have been discussing and following closely is the price differential between domestic prices and the China export price. The China export price can be used as a proxy for the Southeast Asia price as well as a driver of the world price. Movement in this differential has implications for domestic import trends. We want to revisit this indicator within the backdrop of the recent escalation of the trade war by the Trump Administration. The chart below shows the differential, which is the difference between the Midwest HRC price and the China export price, including transportation costs.
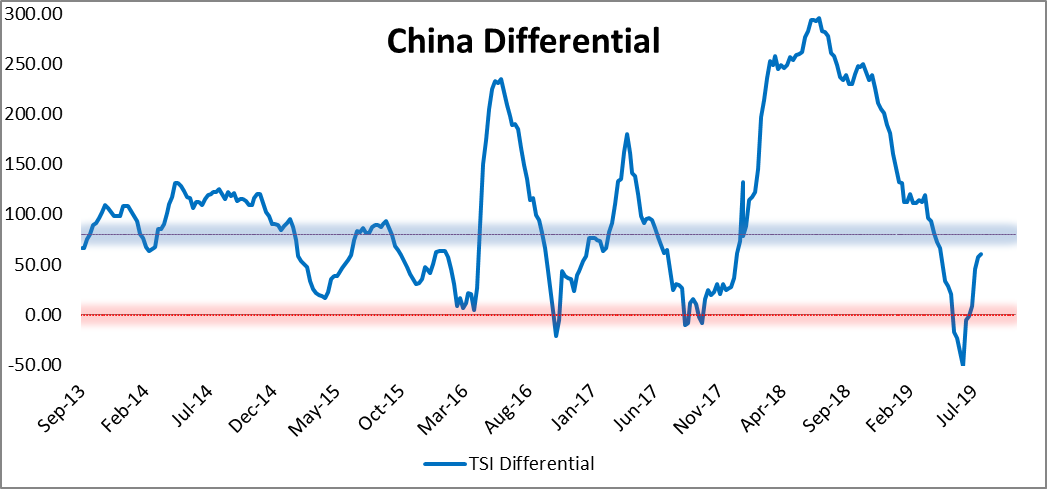
Since the differential bottomed at the beginning of July, domestic HRC spot prices have rallied approximately $100/st, while the China export price has fallen $12/st. As you can see, the current differential is nearing its long-term average of $80. A price differential above this historical average signals that domestic pricing is high enough to encourage imports.
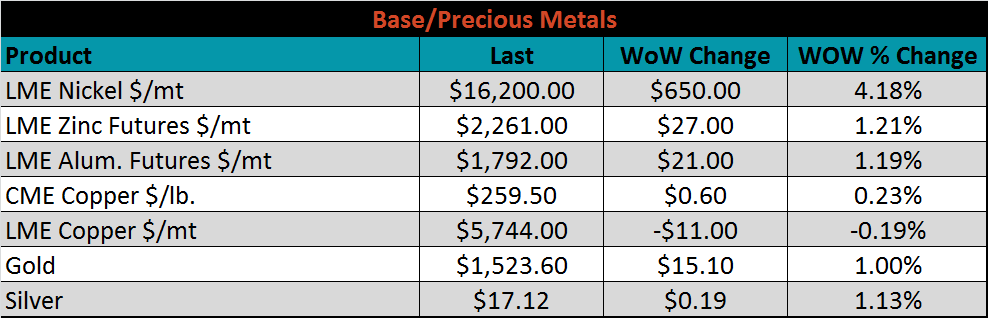
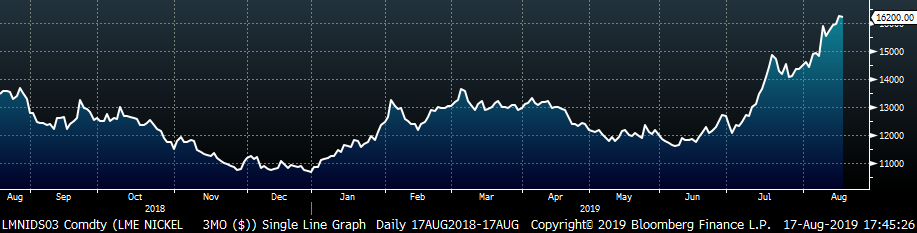
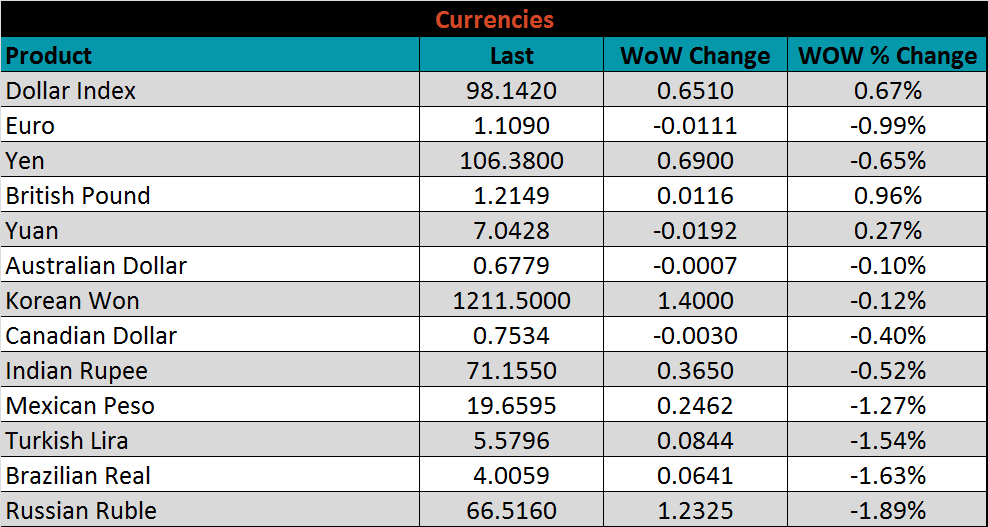
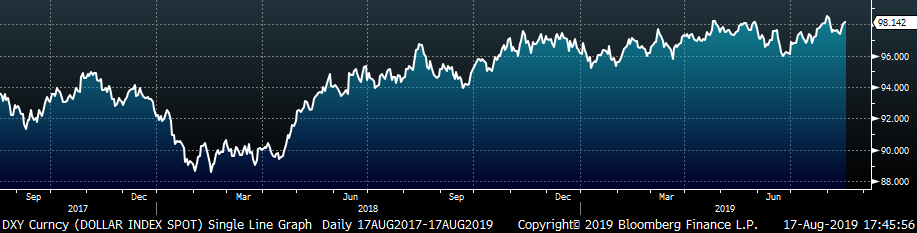
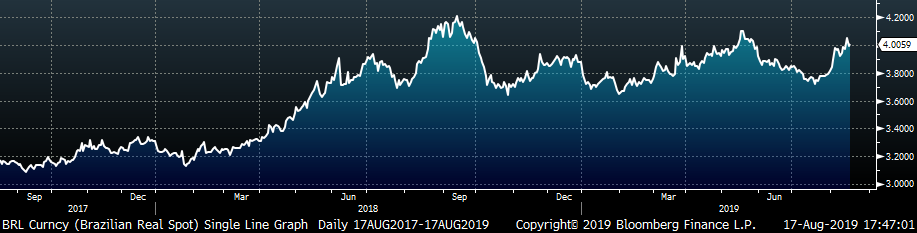
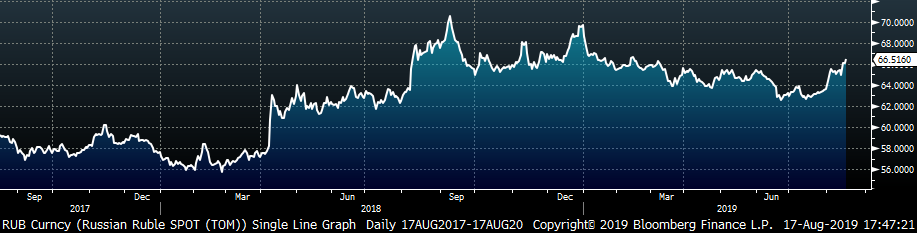
The Trump Administration’s recent proposed increase in tariffs on Chinese imports has rattled global financial markets, and may have implications in the steel market and global trade flows. The primary impact is taking place in the currency markets as the US dollar has strengthened to the highest levels of the year, and the Chinese government has set the Yuan at the weakest levels of the last few years. These movements in the two currencies make importing goods, including steel, more attractive. Moreover, the strong US dollar is a headwind for metals prices broadly, and as such, is identified as a downside price risk. Additionally, the weakening economic conditions in China may incite the government to implement stimulus measures. While recent data has yet to show this change in policy, there is historical evidence that this is likely based on the slowing Chinese economy. The Trump Administration has recently discussed fiscal stimulus measures such as tax cuts, and it continues to pressure the Federal Reserve to provide more accommodative monetary policy. These stimulus measures out of both or either country would be supportive of steel prices.
However, changes in trade flows and governmental stimulus efforts take time to affect markets, and would not influence the domestic steel market for several months. We believe the more pressing dynamic in the domestic steel market is the expected lower levels of imports, along with planned mill outages, in the months ahead.
Below are the most pertinent upside and downside price risks:
Upside Risks:
Downside Risks:
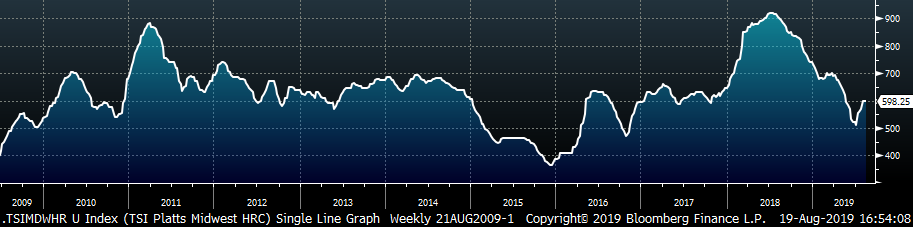
The Platts TSI Daily Midwest HRC Index was up $0.25 to $598.25.
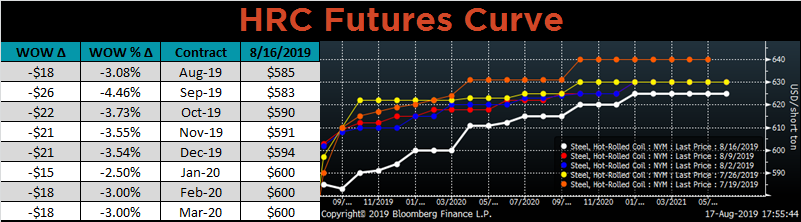
The CME Midwest HRC futures curve is shown below with last Friday’s settlements in white. The curve shifted lower across all expirations, but most dramatically in the front.
September ferrous futures were mixed. Midwest HRC futures lost 4.3%, while Chinese HRC futures gained 2.2%.
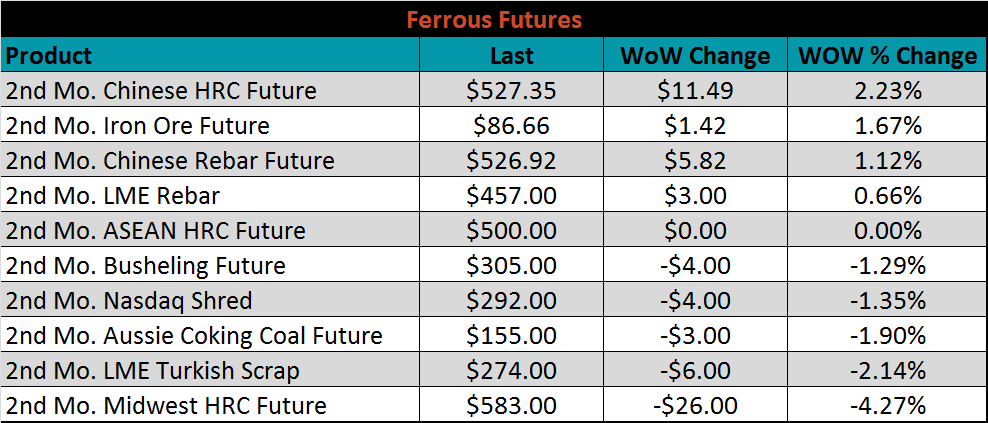
The global flat rolled indexes were mixed. The ASEAN TSI index was down 3.4%.
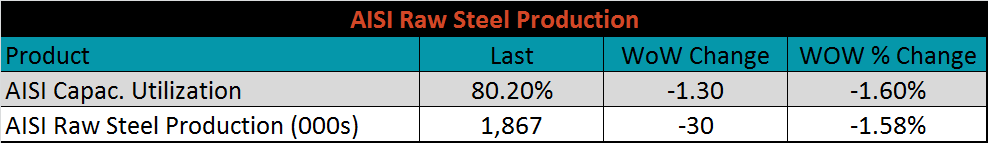
The AISI Capacity Utilization Rate fell 1.3% last week to 80.2%, still above the 80% goal set by the Trump administration. Impending planned outages in the months ahead could reduce production and may be extended if mills are unable to maintain profitability.
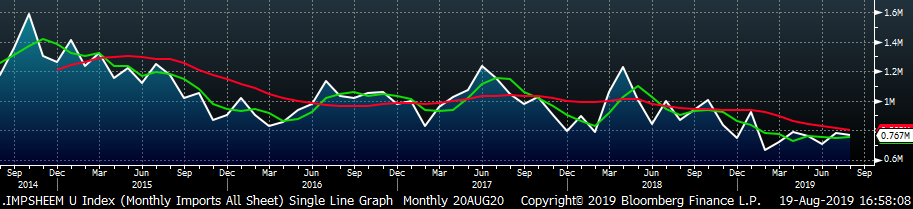
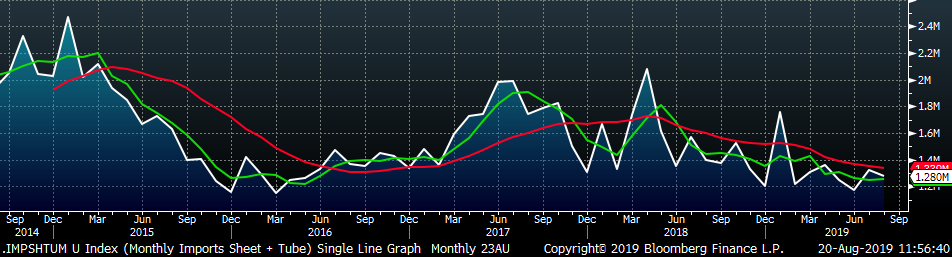
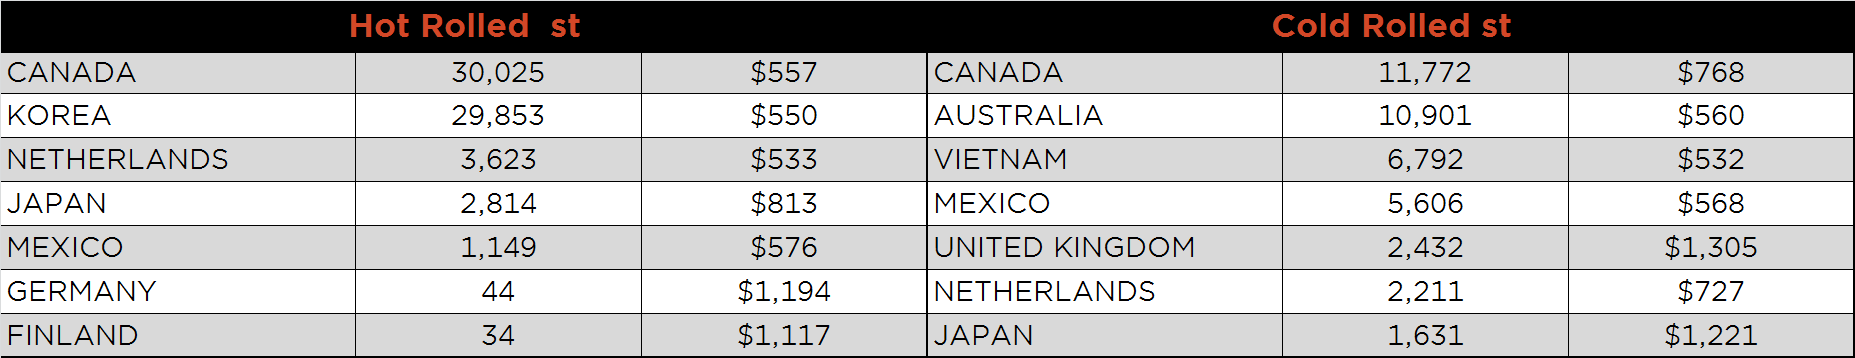
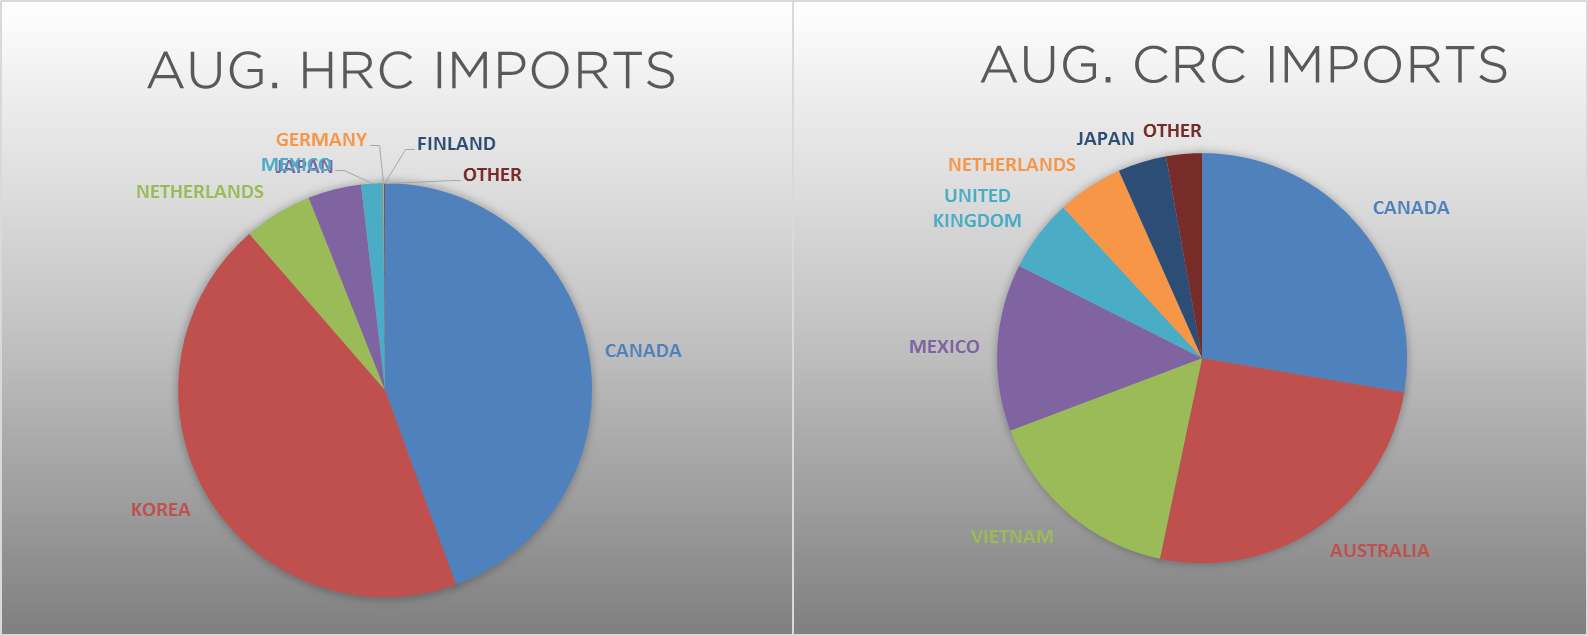
August flat rolled import license data is forecasting a decrease of 15k to 767k MoM.
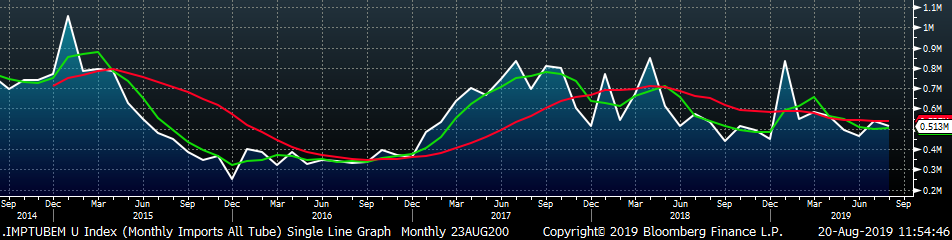
Tube imports license data is forecasting a MoM decrease of 23k to 513k tons in August.
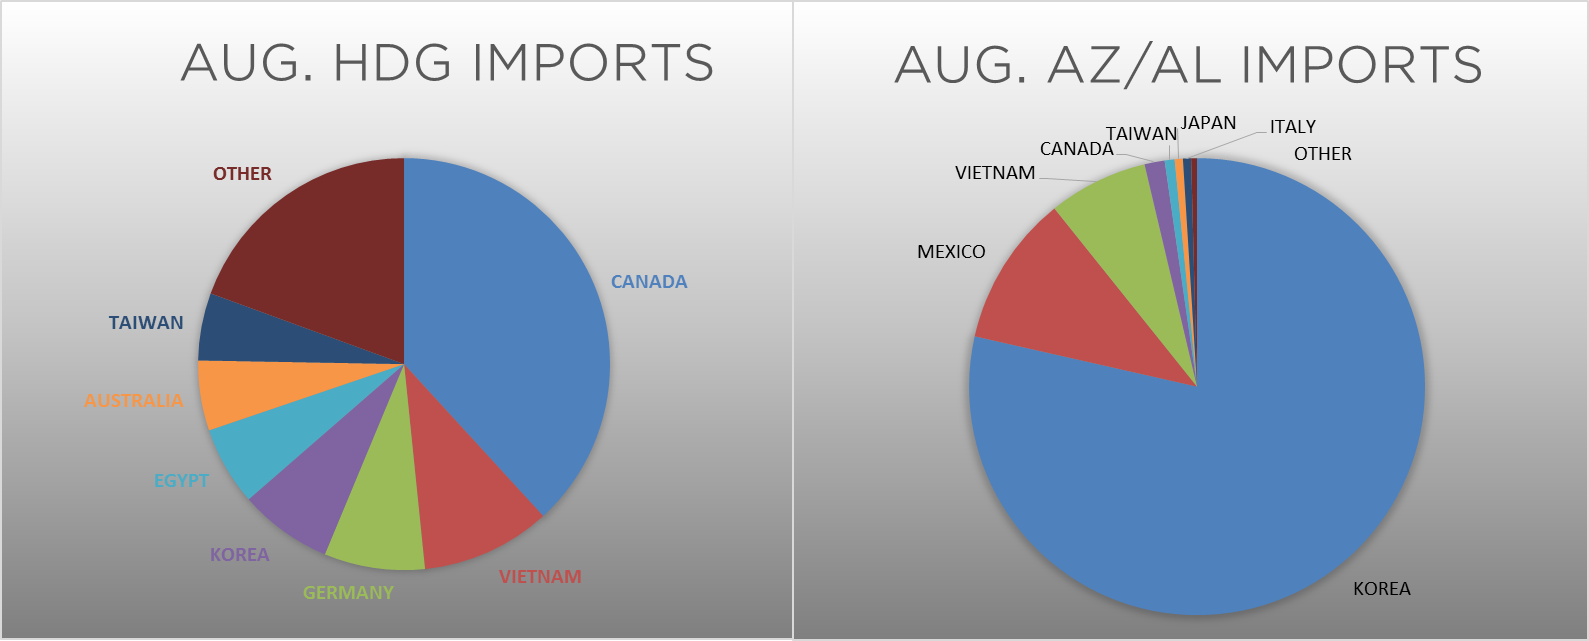
AZ/AL import licenses are forecast to increase 16k in August to 80k.
Below is August import license data through August 13, 2019.

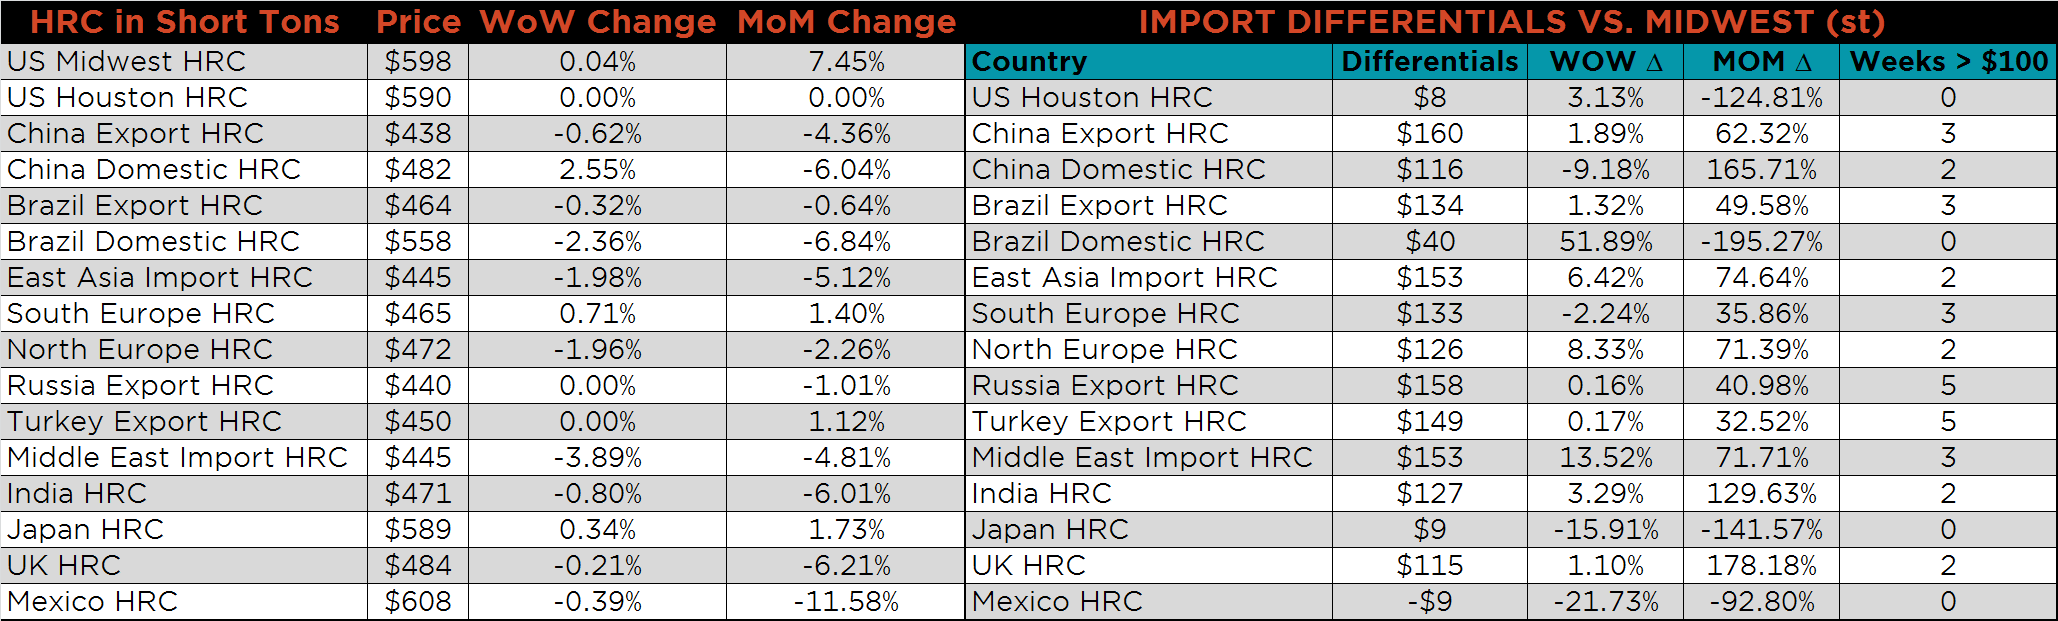
Below is the Midwest HRC price vs. each listed country’s export price using pricing from SBB Platts. We have adjusted each export price to include any tariff or transportation cost to get a comparable delivered price. Differentials changed very little on the week, as the US HRC price was only slightly lower.
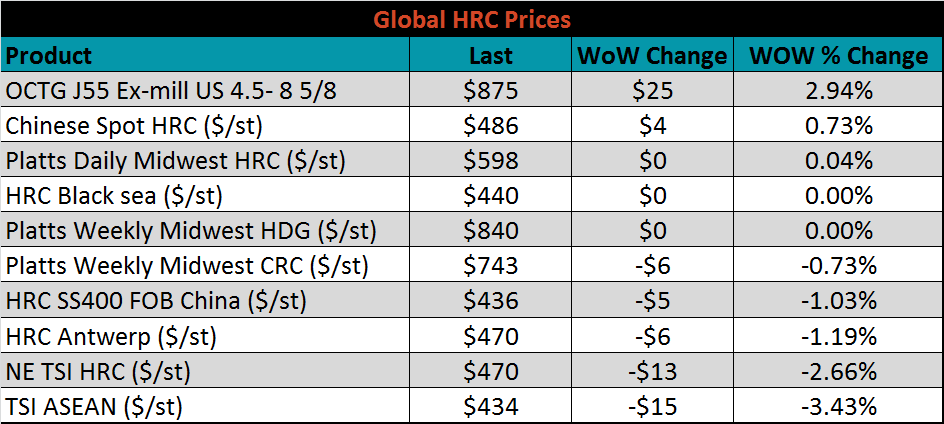
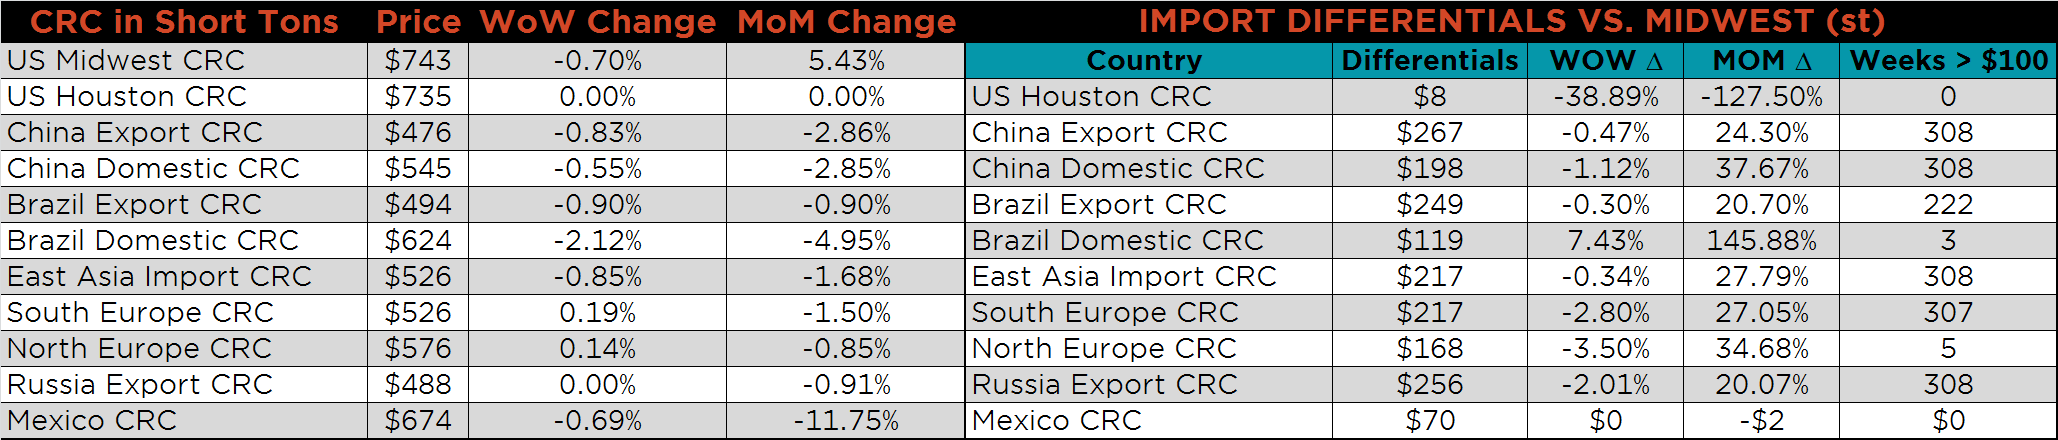
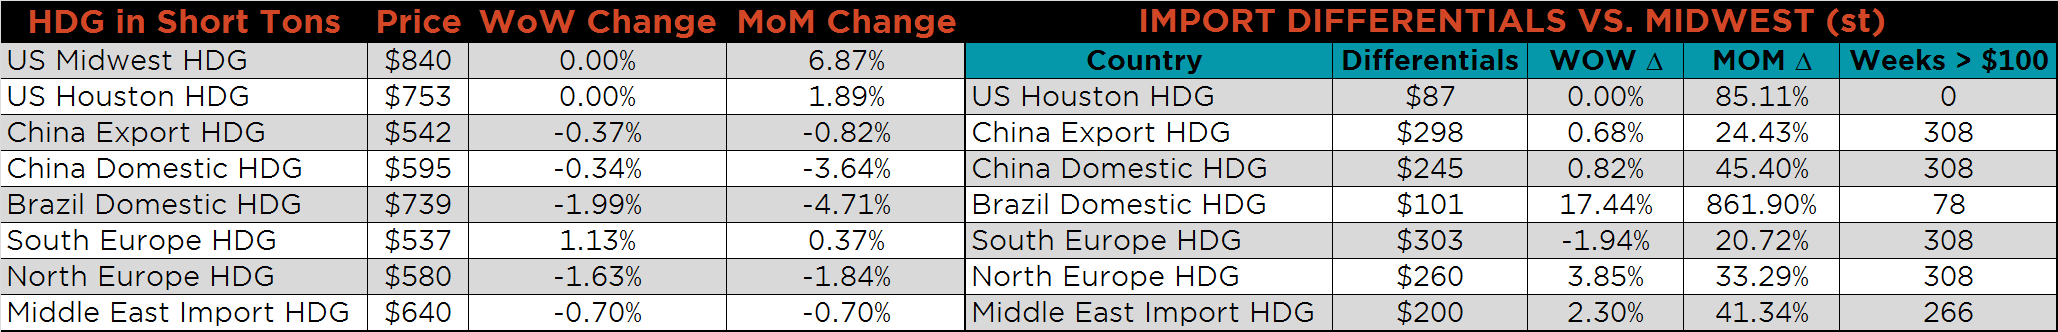
SBB Platt’s HRC, CRC and HDG pricing is below. Midwest prices were flat on the week, as were prices of the major exporting countries.
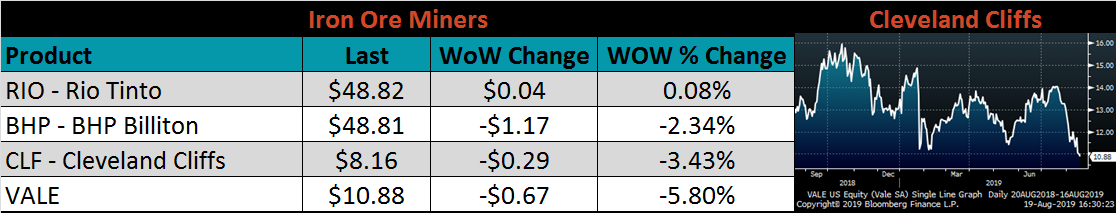
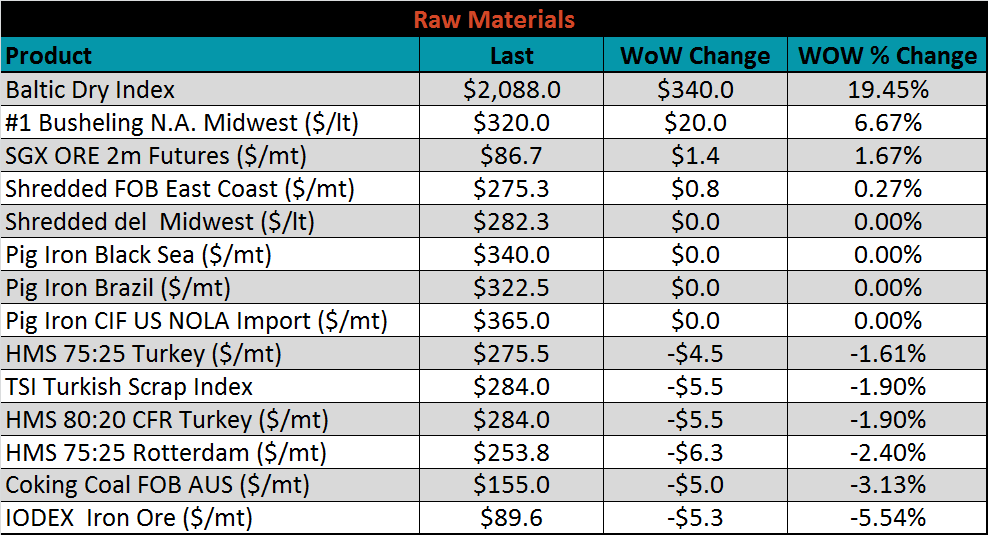
Raw material prices were mixed. The IODEX was down another 5.5%, while busheling was up 6.7%.
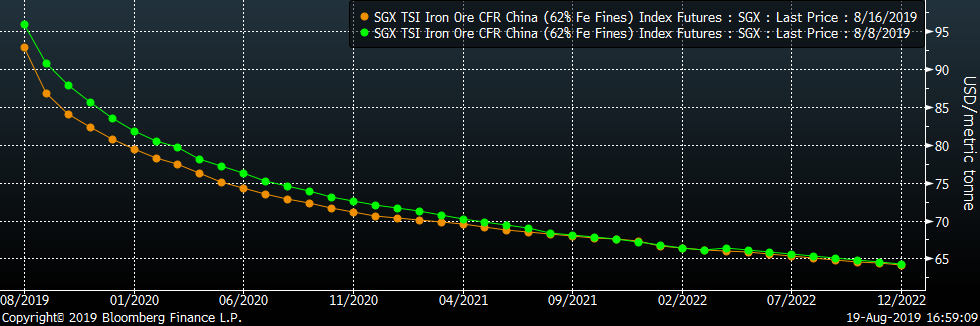
Below is the iron ore future curve with Friday’s settlments in orange, and the prior week’s settlements in green. The sell off in the front of the curve continued last week.
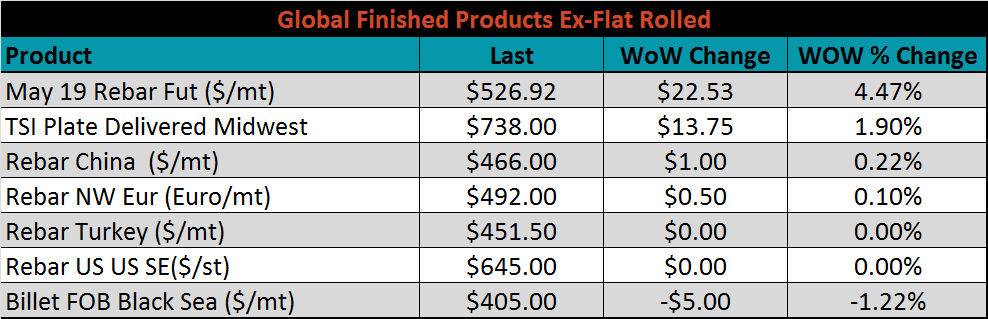
The ex-flat rolled prices are listed below.

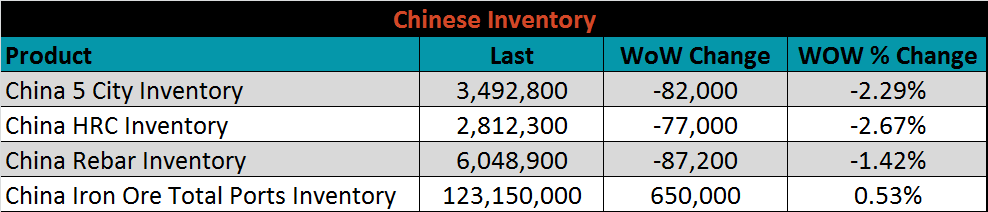
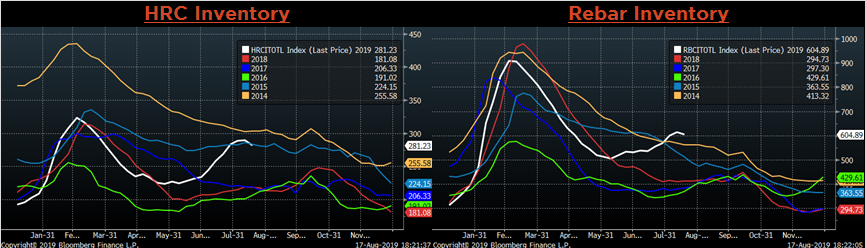
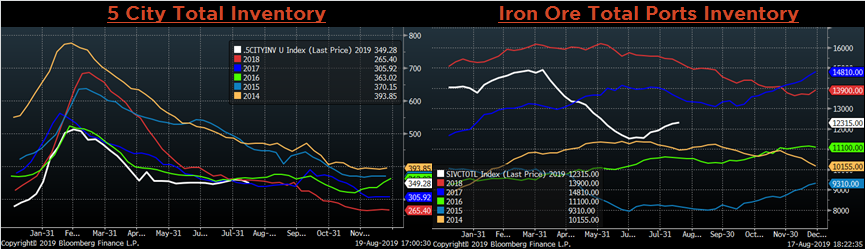
Below are inventory levels for Chinese finished steel products and iron ore. HRC, Rebar and 5-City inventory levels were lower, while Iron Ore port inventory levels continued to rise. Finished product production is likely to slow further in the months ahead on lower prices and winter production cuts.
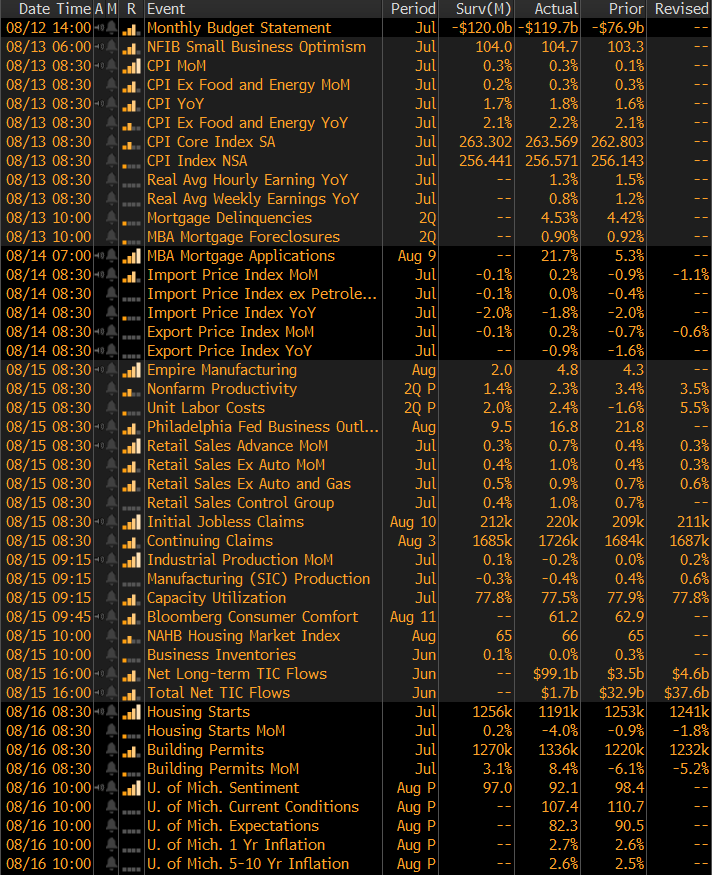
The remainder of the pertinent economic data is to the right. Much of the data that came out over the week was consumer centric. As rates have continued to decline after the FOMC lowered the FED Funds Rate, we saw a weekly spike in MBA Mortgage Applications from 5.3% to 21.7%. Additionally, the Consumer Price Index (CPI) data came in stronger than expected with the MoM reading up 0.3% and YoY up 1.8%. Finally, the Empire Manufacturing, and Philadelphia Fed Business Outlook came in above expectations at 4.8 and 16.8, compared to 2.0 and 9.5, respectively.
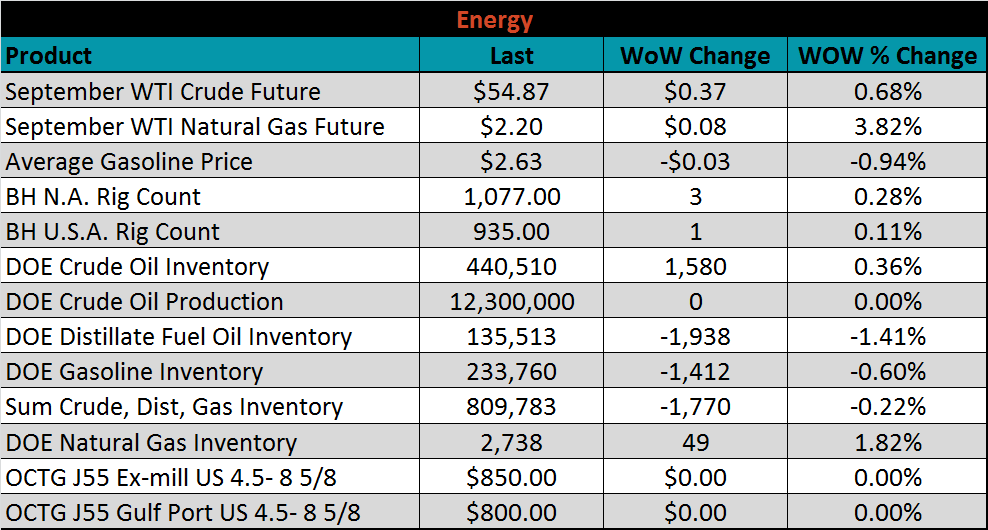
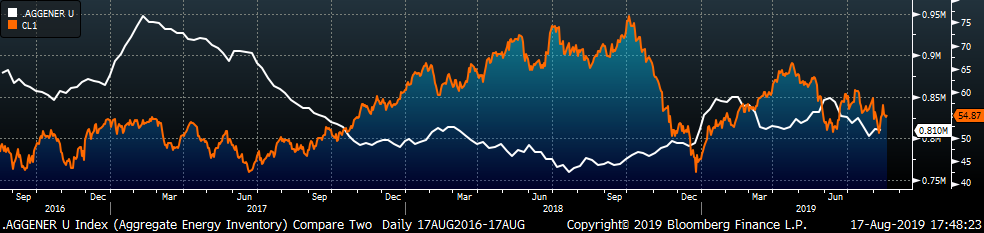
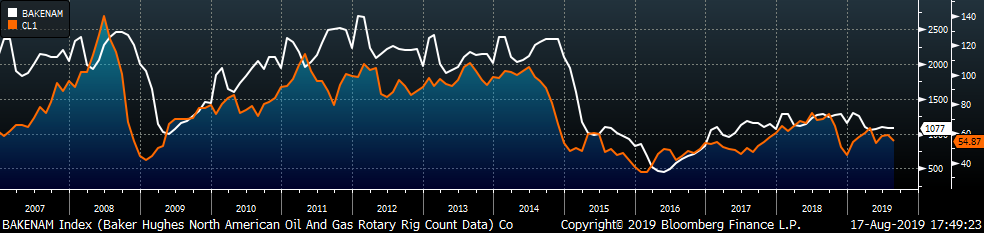
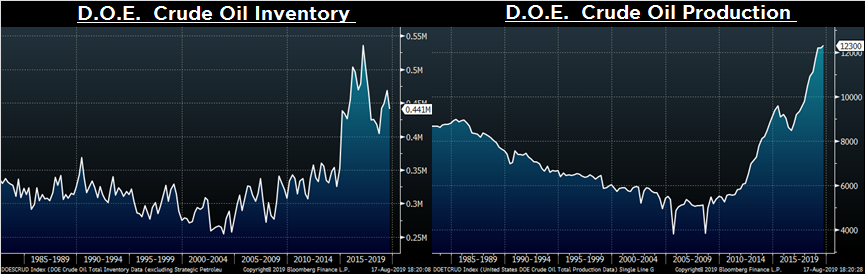
Last week, the September WTI crude oil future gained $0.37 or 0.7% to $54.87/bbl. The aggregate inventory level was down 0.2%, and crude oil production was unchanged at 12.3m bbl/day. The Baker Hughes North American rig count gained five rigs and the U.S. count gained one rig.
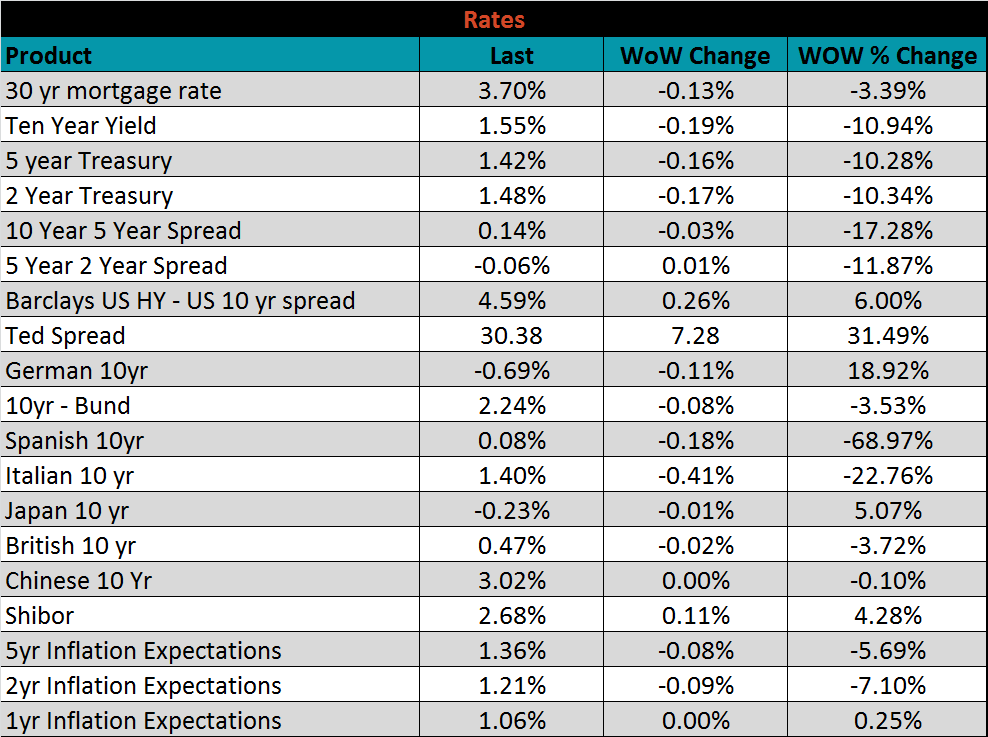
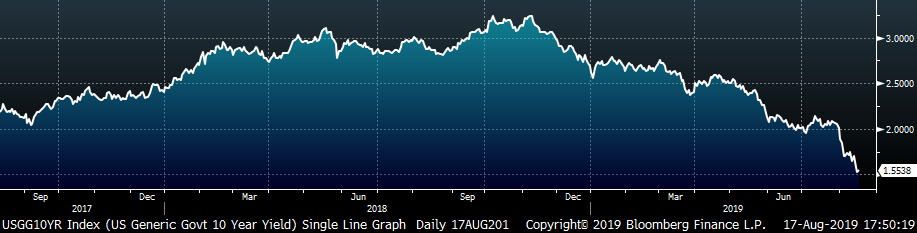
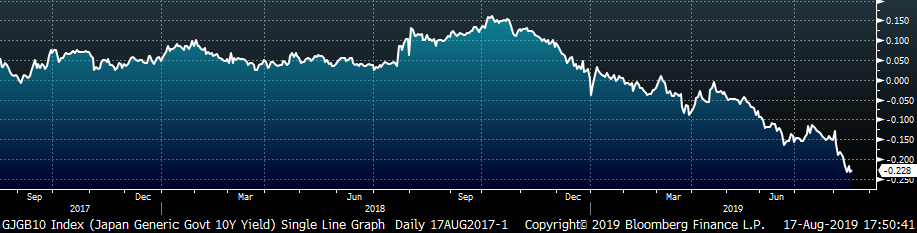
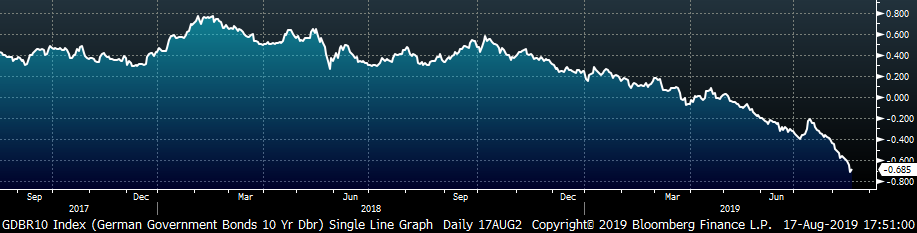
The U.S. 10-year yield was down another 19 bps, closing the week at 1.55%. The German 10-year yield was down another 11 bps to minus 0.69% and the Japanese 10-year yield was down one bps to minus 0.23%. On Wednesday, the 2-year and 10-year yields inverted briefly, with the 2-year yield rising above the 10-yr yield. Historically this has been one indicator of a coming recession, but not for 18-24 months.
The list below details some upside and downside risks relevant to the steel industry. The orange ones are occurring or look to be highly likely. The upside risks look to be in control.
Upside Risks:
Downside Risks: