Content
-
Weekly Highlights
- Market Commentary
- ISM PMI
- Global PMI
- Construction Spending
- Auto Sales
- Risks


Thursday, the Trump administration announced a new 10% tariff on the remaining Chinese imports that would begin on September 1st. Trade restrictions and retaliation has led to global uncertainty and made it difficult for firms to plan and invest further out into the future. This escalation of the conflict will only serve to heighten the uncertainty. Also last week, numerous economic data points were released, pointing to slower economic growth and tepid demand. July ISM Manufacturing PMI (below) hit the lowest level since August 2016, while global PMIs (below) weakened even further. Construction spending (below) in June came in weaker than expected, and is mainly being supported by government spending on infrastructure projects (roads, highways, bridges). Job growth and the unemployment rate remain bright spots in the domestic economy, which is encouraging for auto sales despite an apparent peak in 2016.
To determine what all this means for the steel market, let’s look at some of the upside risks we have been focusing on lately:
While many of these upside price risks remain relevant, their likelihood has declined as most of them have already occurred to some degree. Along with the uncertainty surrounding the domestic and global economy, the upside and downside risks appear much more balanced.
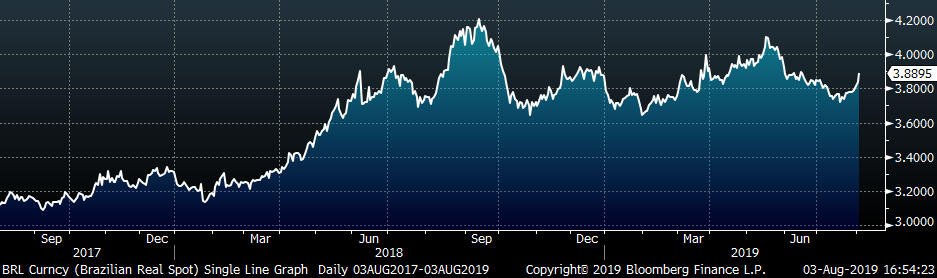
However, one upside risk, declining import levels, is still prevalent and could have an outsized impact on domestic pricing into the end of the year. Due to recent price differentials and import offers we have seen, we expect import levels to decline even further moving into August and September. Additionally, the impact of quotas may change the seasonality of pricing expected in the domestic steel market. Imported semi-finished material from Brazil will be restrained or nonexistent as they have frontloaded their annual quota in the first 7 months of the year. We believe these factors could create a tonnage deficit in the domestic market of over 1 million tons moving into the fourth quarter. This would have an immediate and significant impact on spot pricing. Moreover, the futures curve, which has flattened in recent weeks, does not appear to be pricing this in.
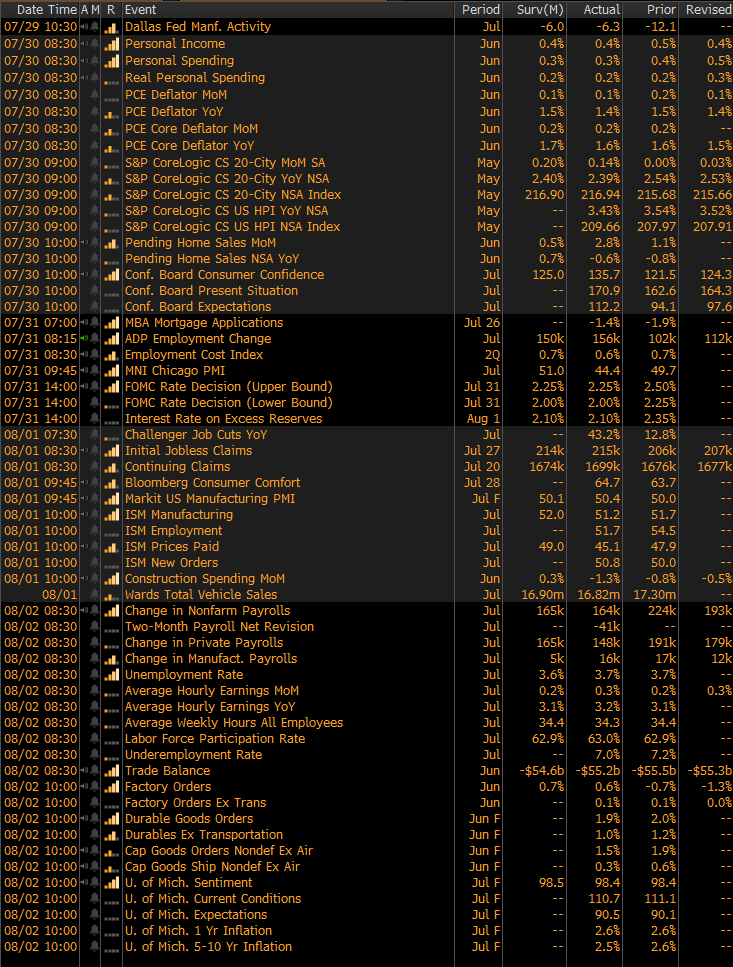
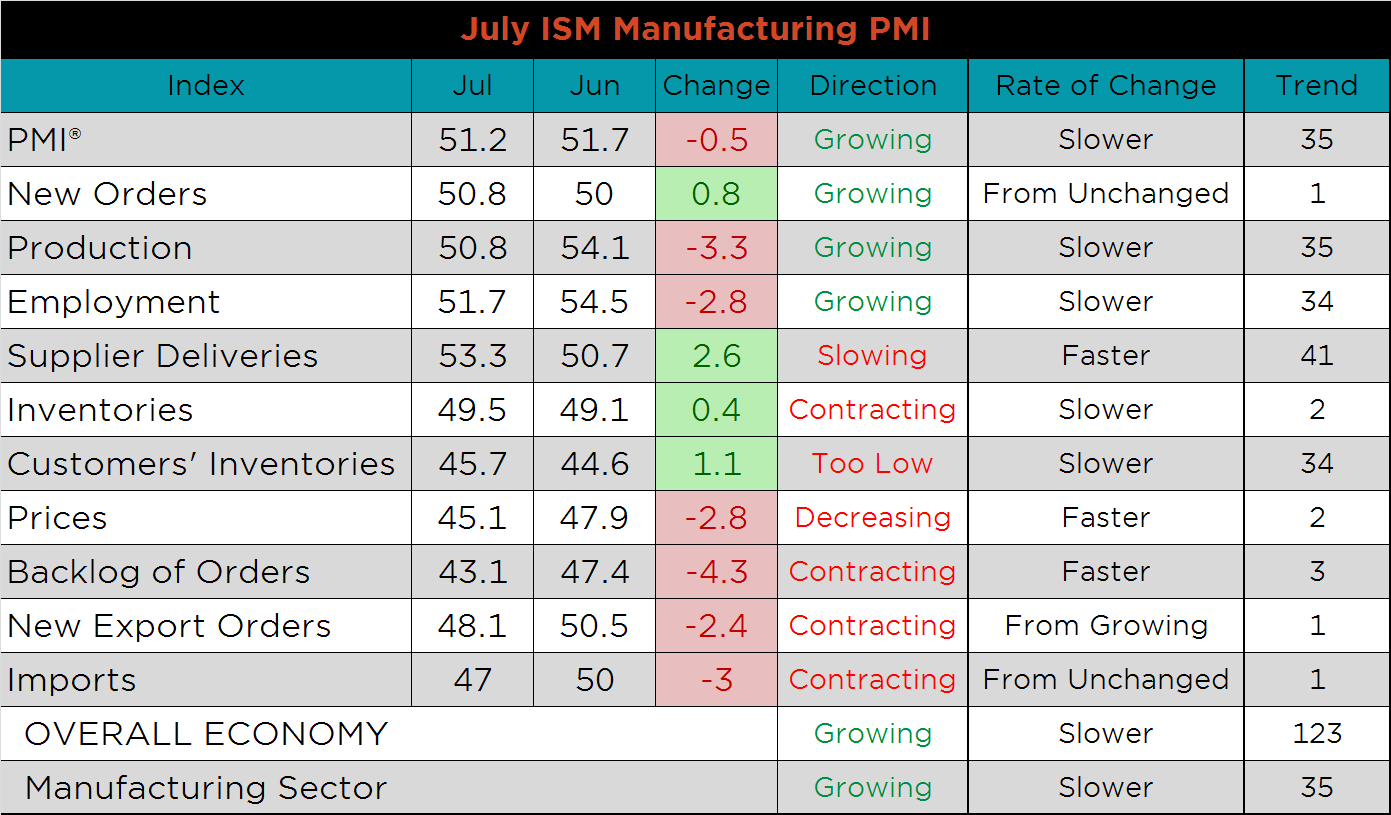
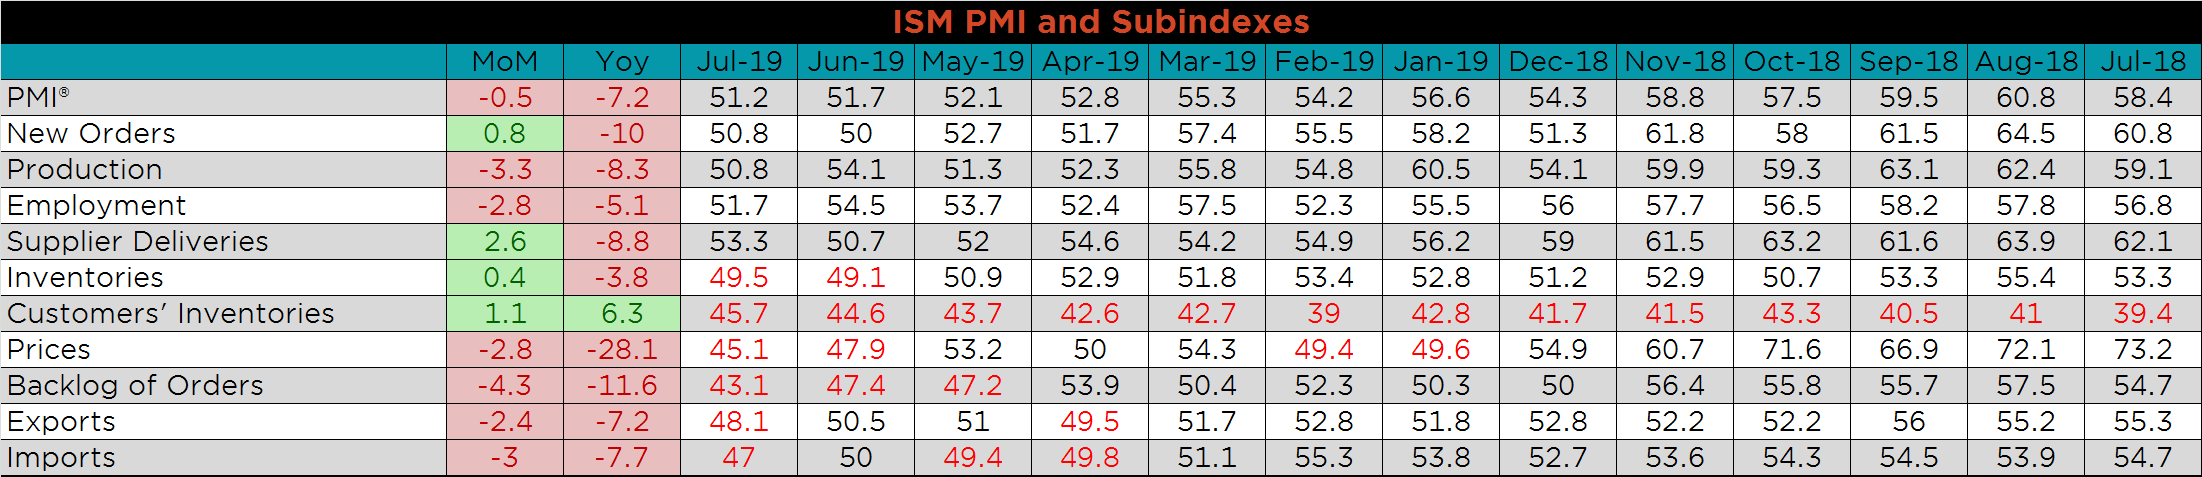
The July ISM Manufacturing PMI and subindexes are below, and it continues to show slower expansion. The new orders, supplier deliveries, inventories and customer inventories all increased from June, while production, employment, prices, backlog of orders, new exports orders and imports all decreased.
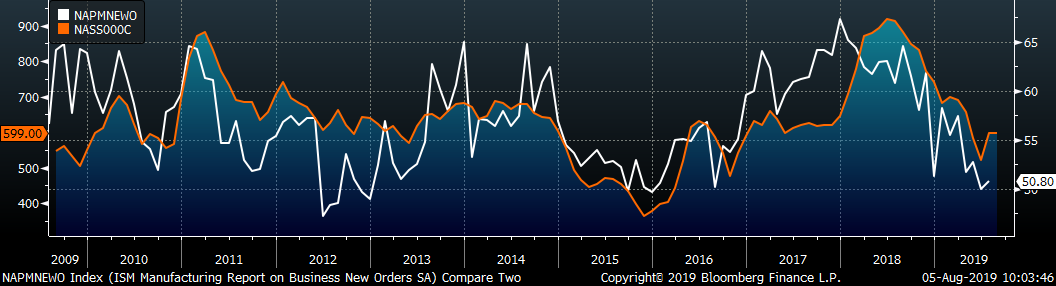
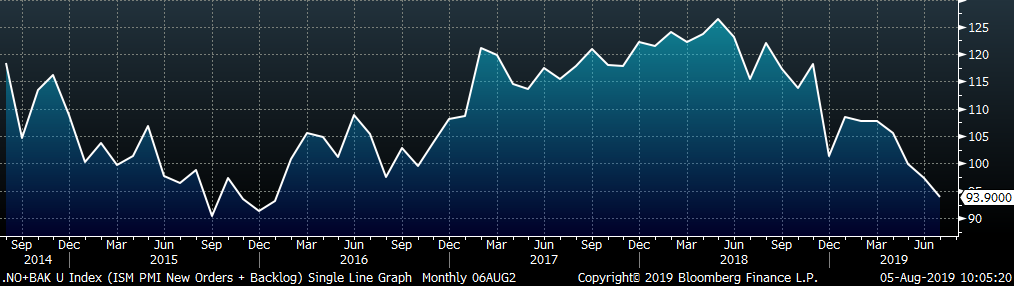
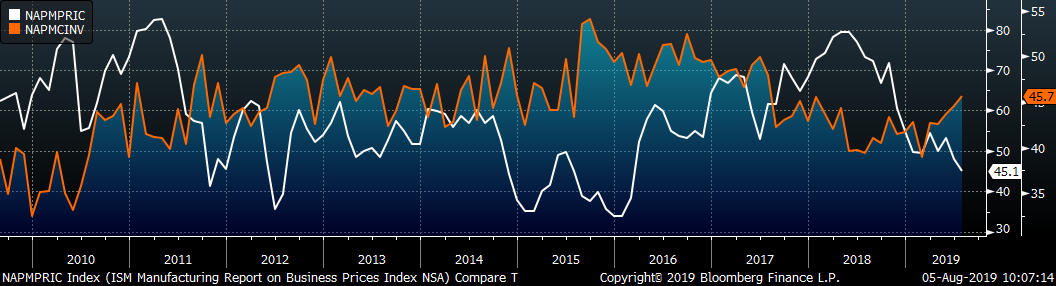
The chart below compares the ISM new orders subindex with the Platts TSI Daily Midwest HRC Index. The subindex rose off the four year low. The second chart adds the new orders and backlog subindexes together, giving a gauge of manufacturing demand, which weakened further in July. Finally, the third chart shows the prices subindex and the customer inventories. The divergence of the two indexes suggests that some restocking has begun, and looks attractive still with the low prices index.
The below tables show the monthly ISM PMI and major subindexes back to July 2018, providing an expanded view of the manufacturing industry. July was another month of poor printings across the board compared to exceptionally high printings from 2018. While the decrease in price should encourage activity, uncertainty in the domestic and global economy has postponed capital investment.
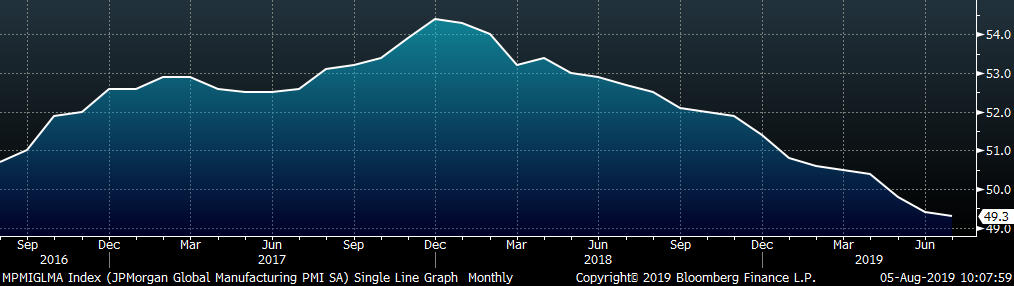
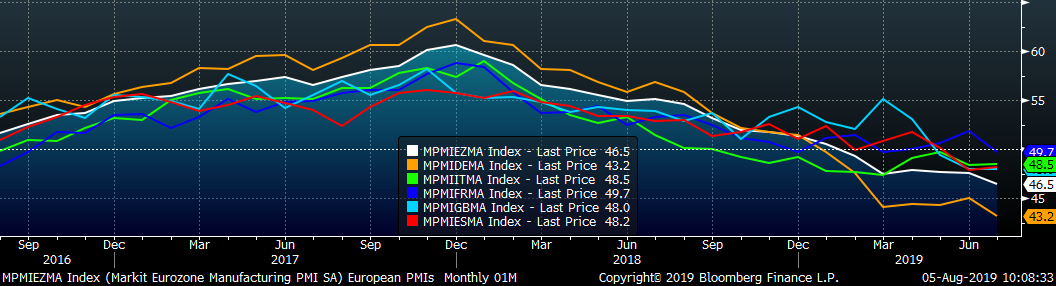
The U.S. manufacturing PMI remains among the strongest in the world. The only global PMI’s that printed ahead of the U.S. were Vietnam, India and Australia, while Brazil, France and Indonesia fall into correction territory. Nineteen of the twenty-five tracked PMI’s are now in contraction, this is in part due to trade restrictions. The strength in Vietnam’s PMI reflects companies’ shifting supply chains away from China as the Trump Administration continues to target Chinese imports.
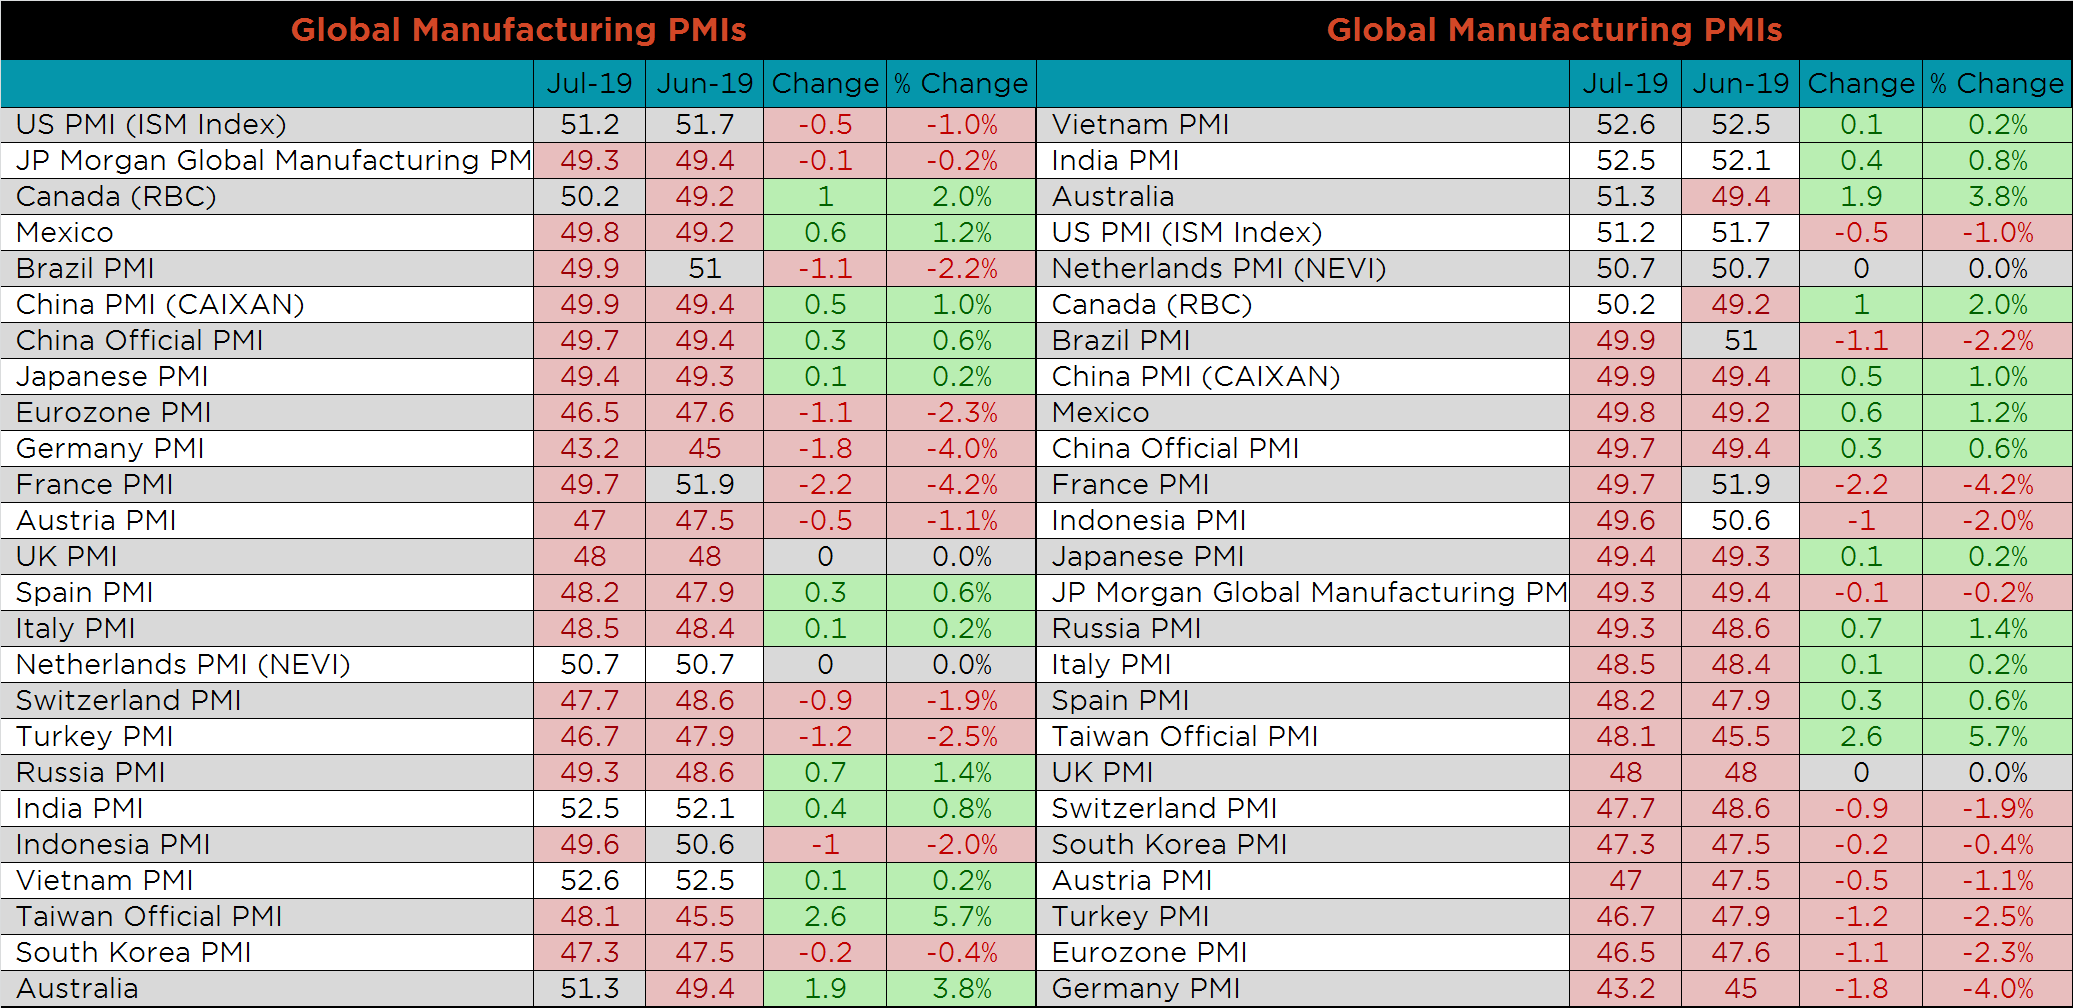
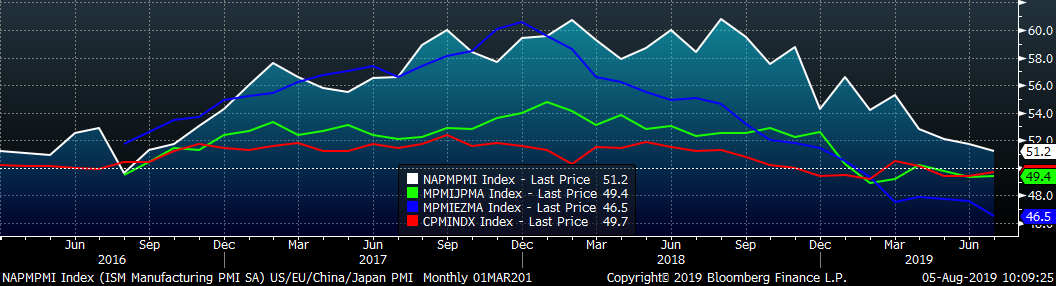
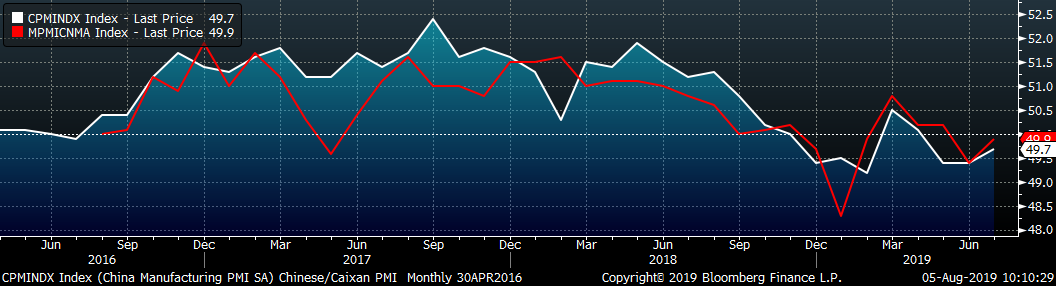
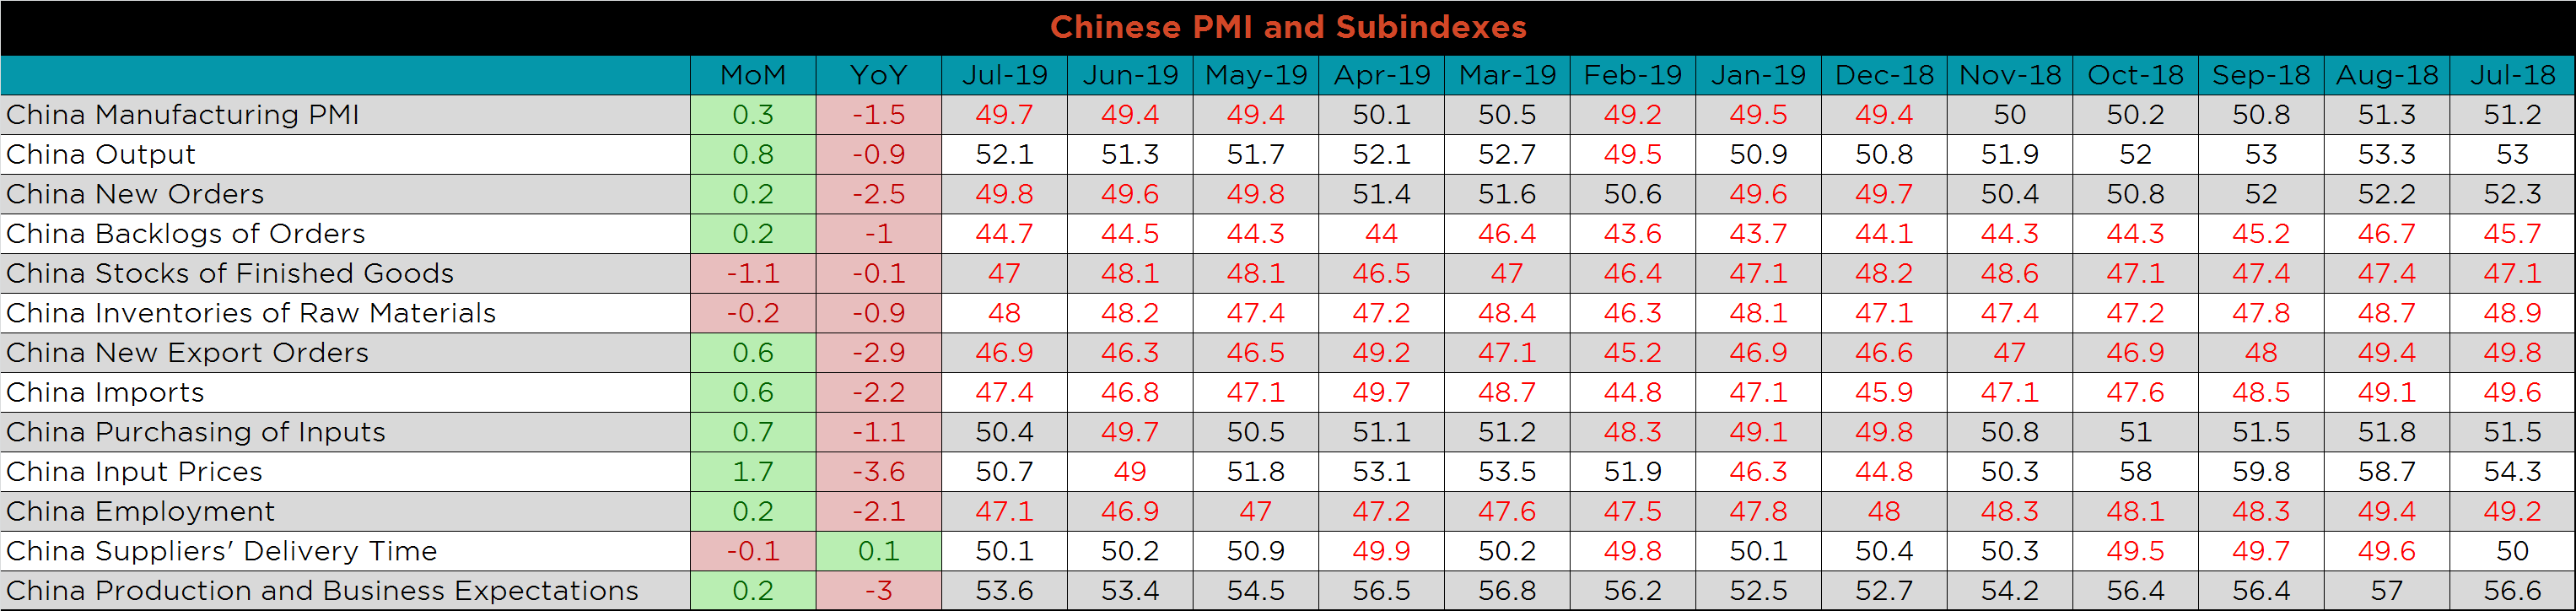
China’s official PMI and Caixan Manufacturing PMIs both printed higher in July at 49.7 and 49.9, respectively.
The table below breaks down China’s official manufacturing PMI subindexes. New export continued contracting, which indicates weakness in global demand.
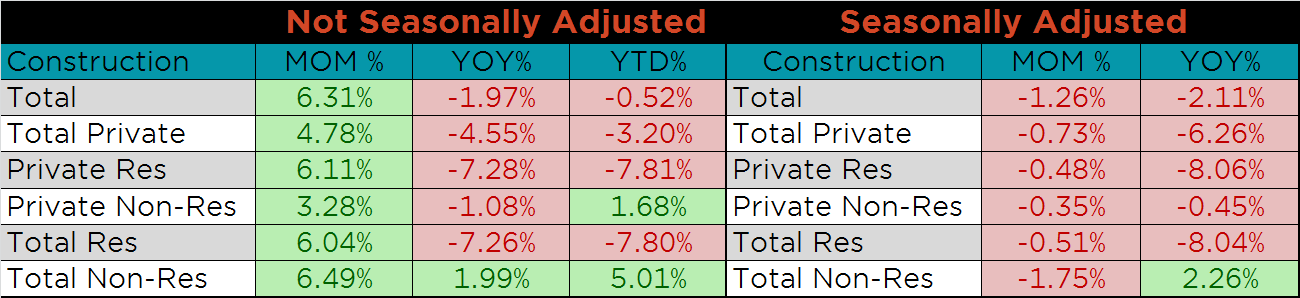
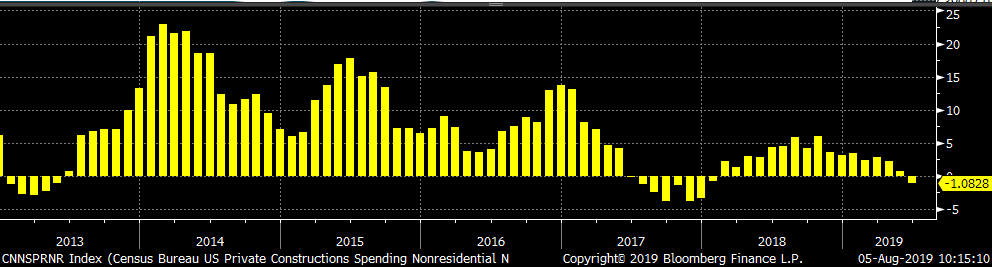
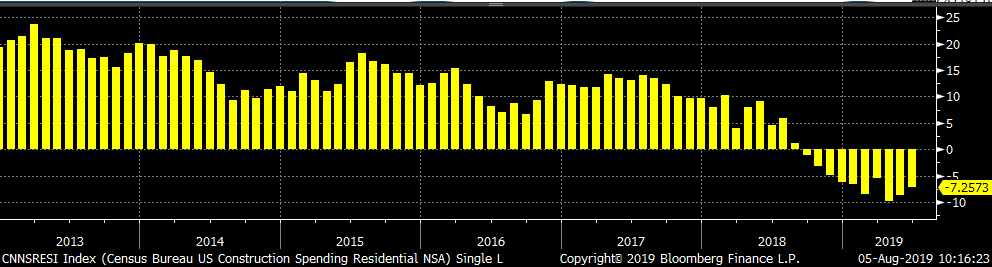
Seasonally adjusted June U.S. construction spending was down MoM and YoY, 1.3% and 2.1%, respectively. Overall weakness in construction spending has continued throughout most of 2019, driven by weakness in residential spending, down 8% compared to June of 2018. Non-residential spending is the only area that has seen YoY growth, driven by public non-residential spending. Spending levels in 2019 have been slightly lower than the high levels of 2018. The second chart below shows the first YoY decline in private nonresidential spending in over a year. The third chart shows residential construction YoY growth recovering from the steep declines of April.
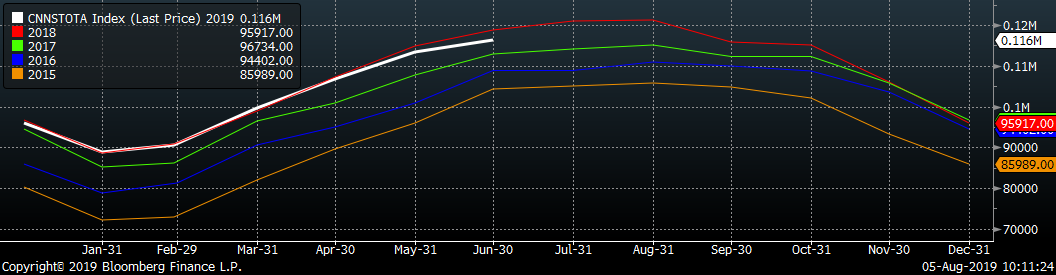
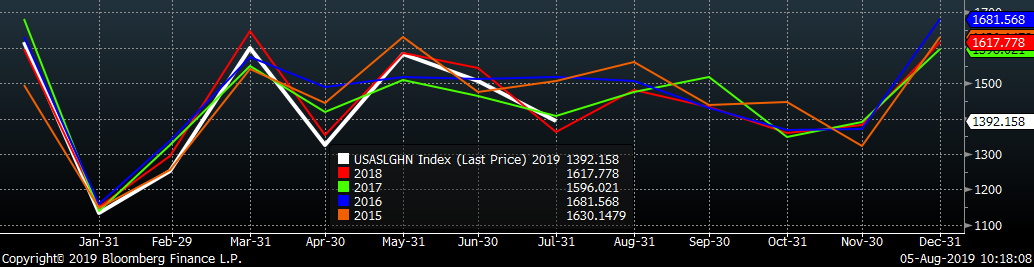
The white line in the chart below represents construction spending in each month of 2019 and compares it to the spending of the previous 4 years.
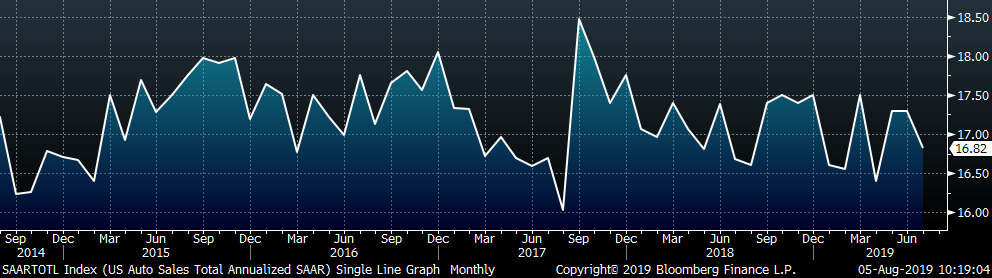
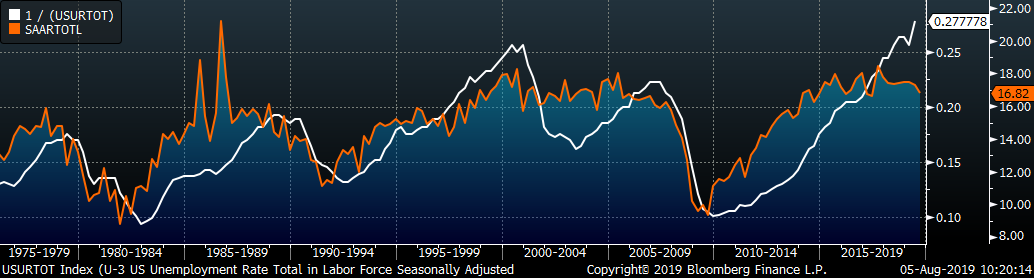
July U.S. light vehicle sales were down 500k to a 16.8m seasonally adjusted annualized rate (S.A.A.R). The white line in the second chart shows auto sales for the first 7 months of 2019 have been in line with the sales of the previous 4 years. July annualized auto sales continued lower while the U.S. unemployment rate remains historically low. Here the unemployment rate is inverted to show the historical relationship between unemployment and auto sales.
Below are the most pertinent upside and downside price risks:
Upside Risks:
Downside Risks:
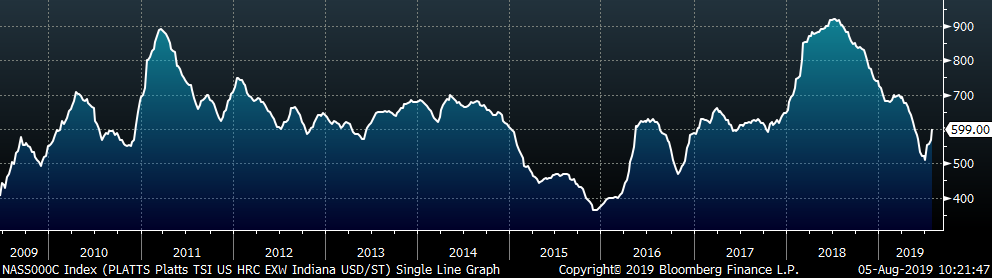
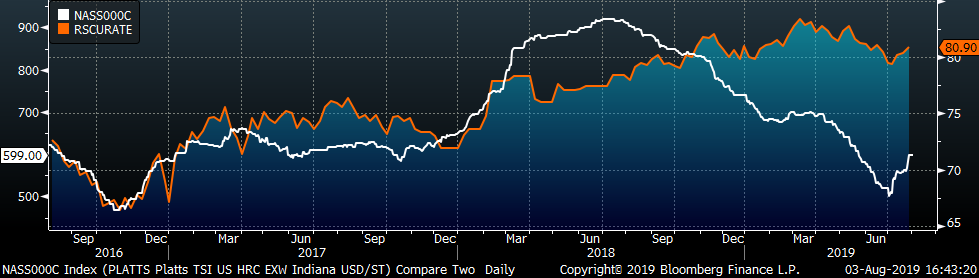
The Platts TSI Daily Midwest HRC Index was up $31.25 to $599.
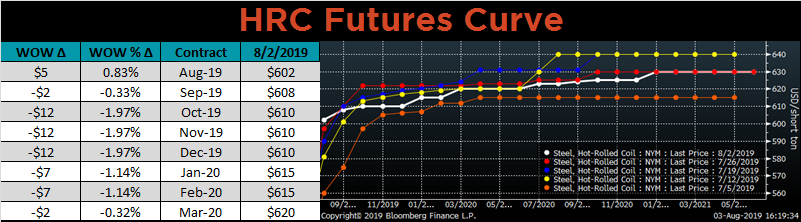
The CME Midwest HRC futures curve is shown below with last Friday’s settlements in white. The curve continues to flatten and with every expiration above 600.
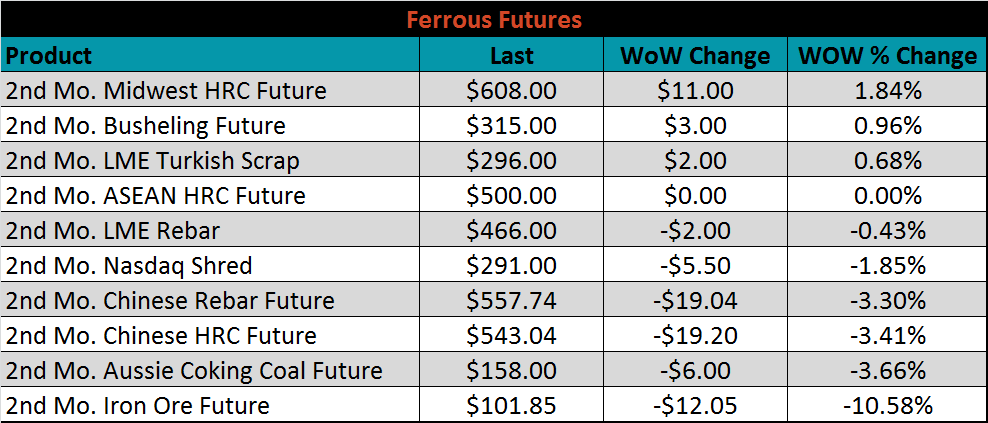
September ferrous futures were mostly lower. Iron ore lost 10.6%, while Midwest HRC gained 1.8%.
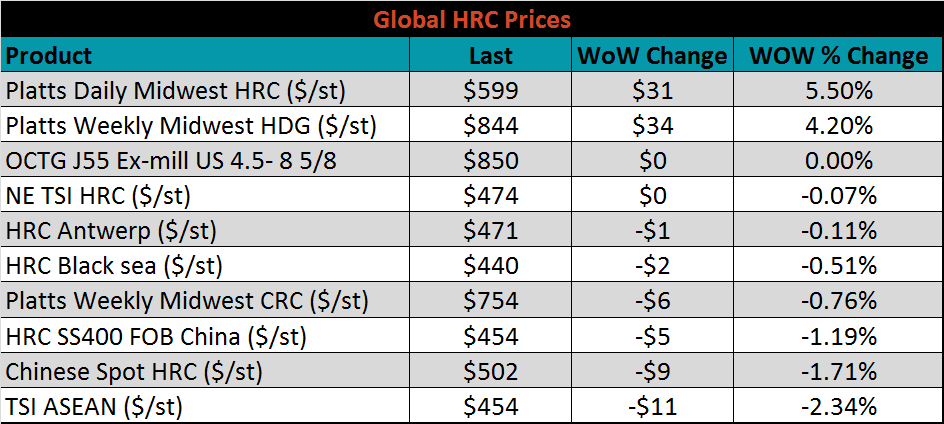
The global flat rolled indexes were mixed. Platts Midwest HRC index was up 5.5%, while TSI ASEAN HRC was down 2.3%.
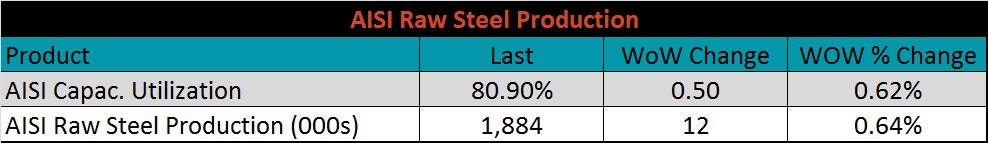
The AISI Capacity Utilization Rate rose another 0.5% last week to 80.9%, still above the 80% goal set by the Trump administration. While summer outages have removed some capacity, production continues to grow.
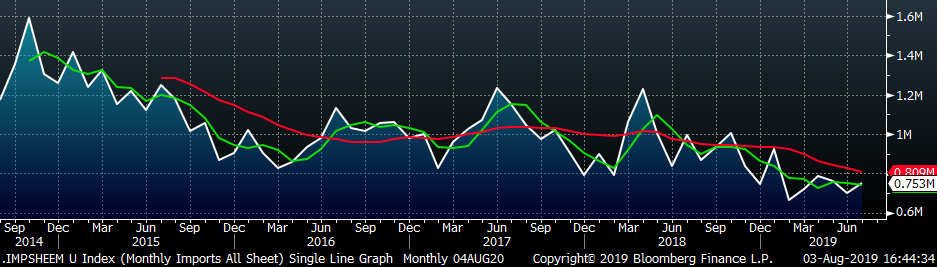
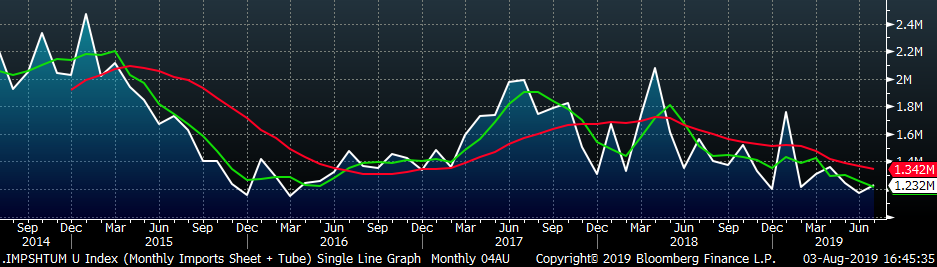
July flat rolled import license data is forecasting an increase to 753k, up 50k MoM.
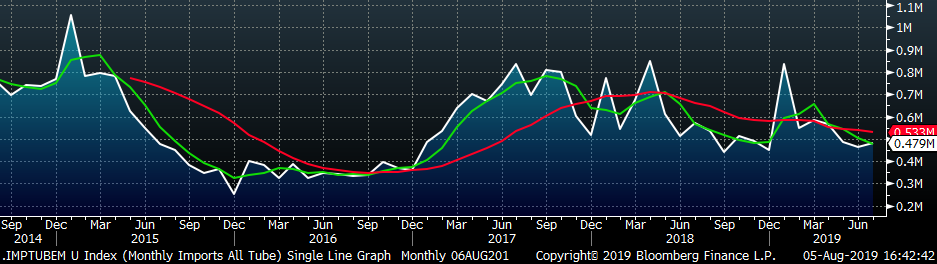
Tube import license data is forecasting a MoM increase of 15k to 479k tons in July.
AZ/AL import licenses are forecast to remain flat in July at 59k.
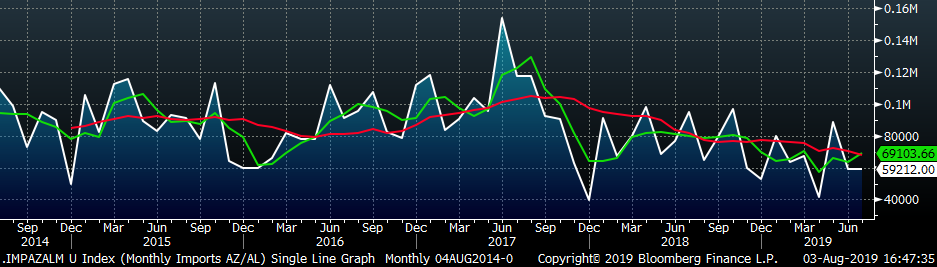
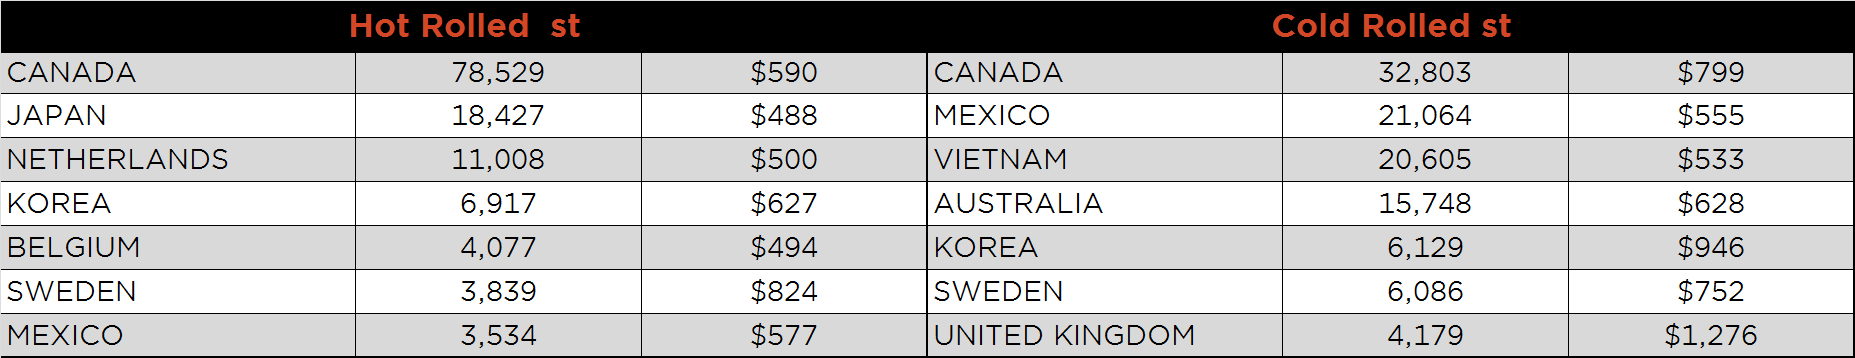
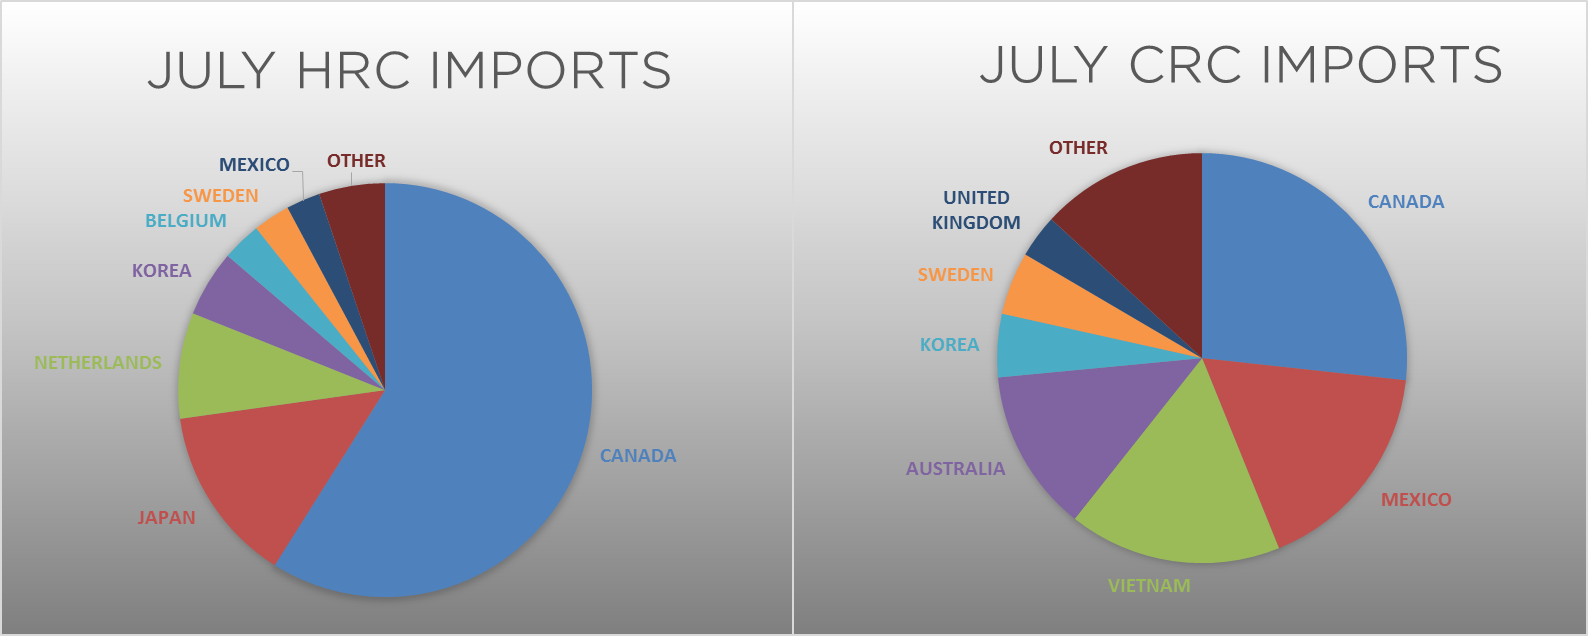
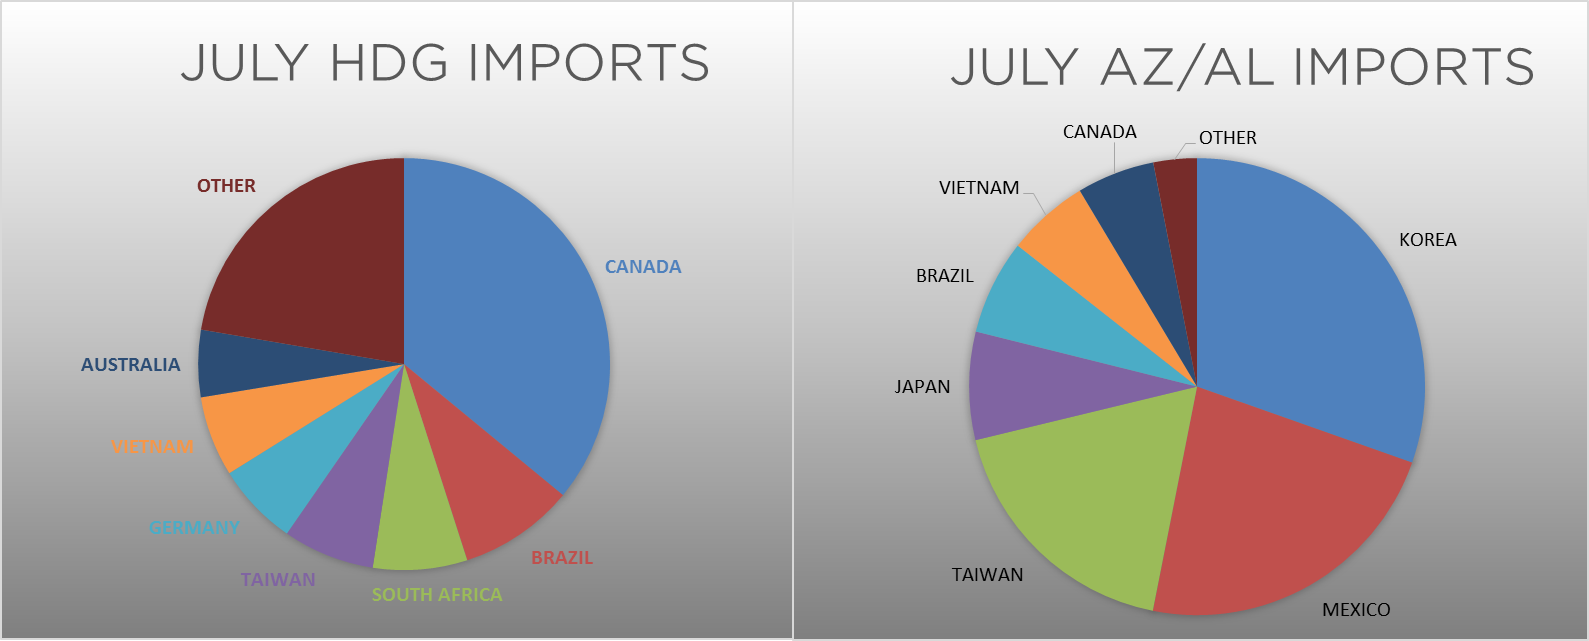
Below is June import license data through July 30, 2019.
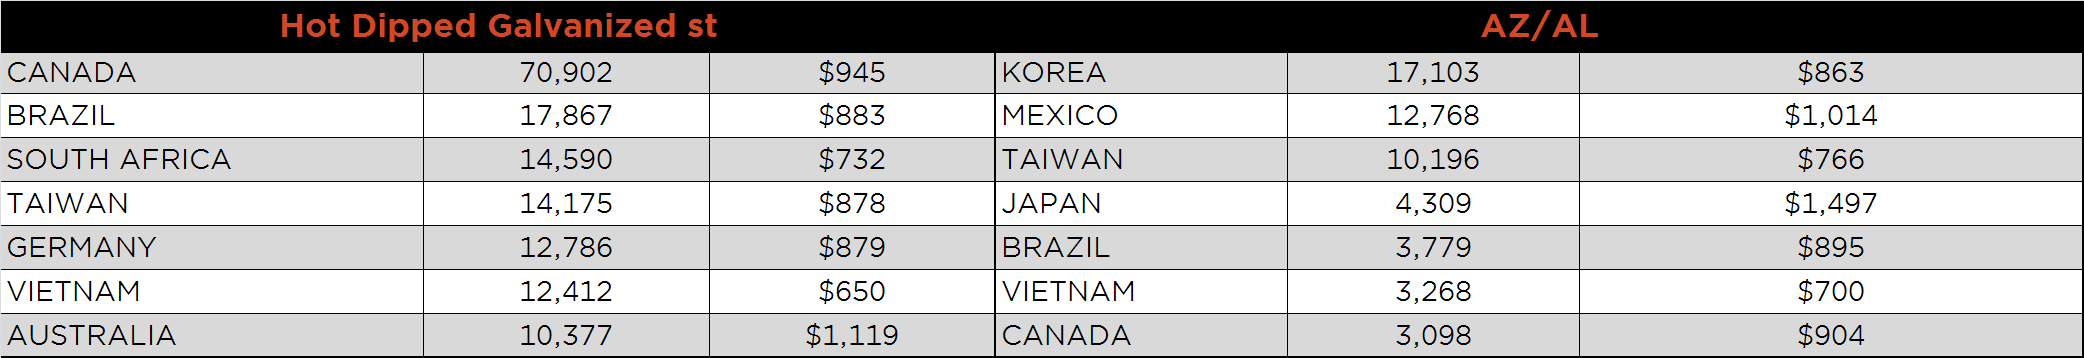
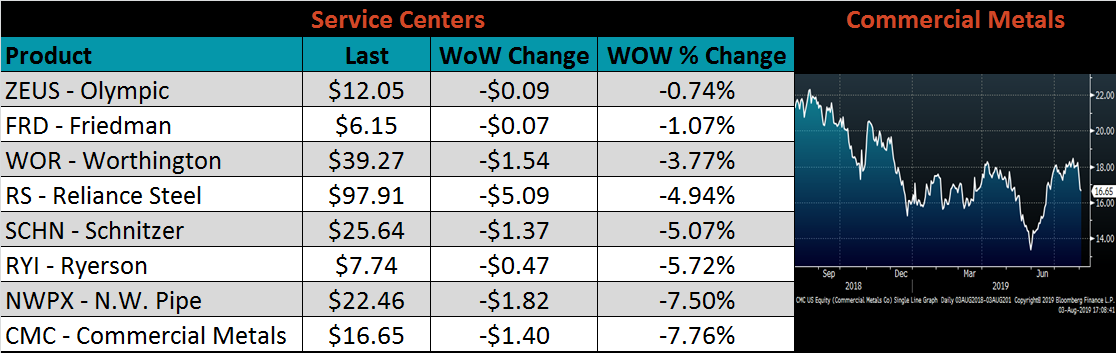
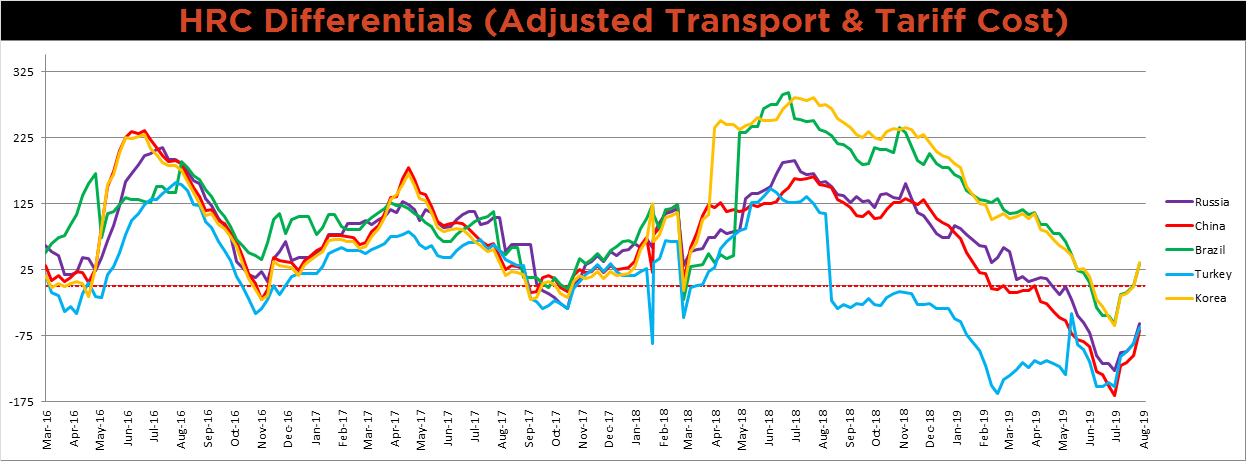
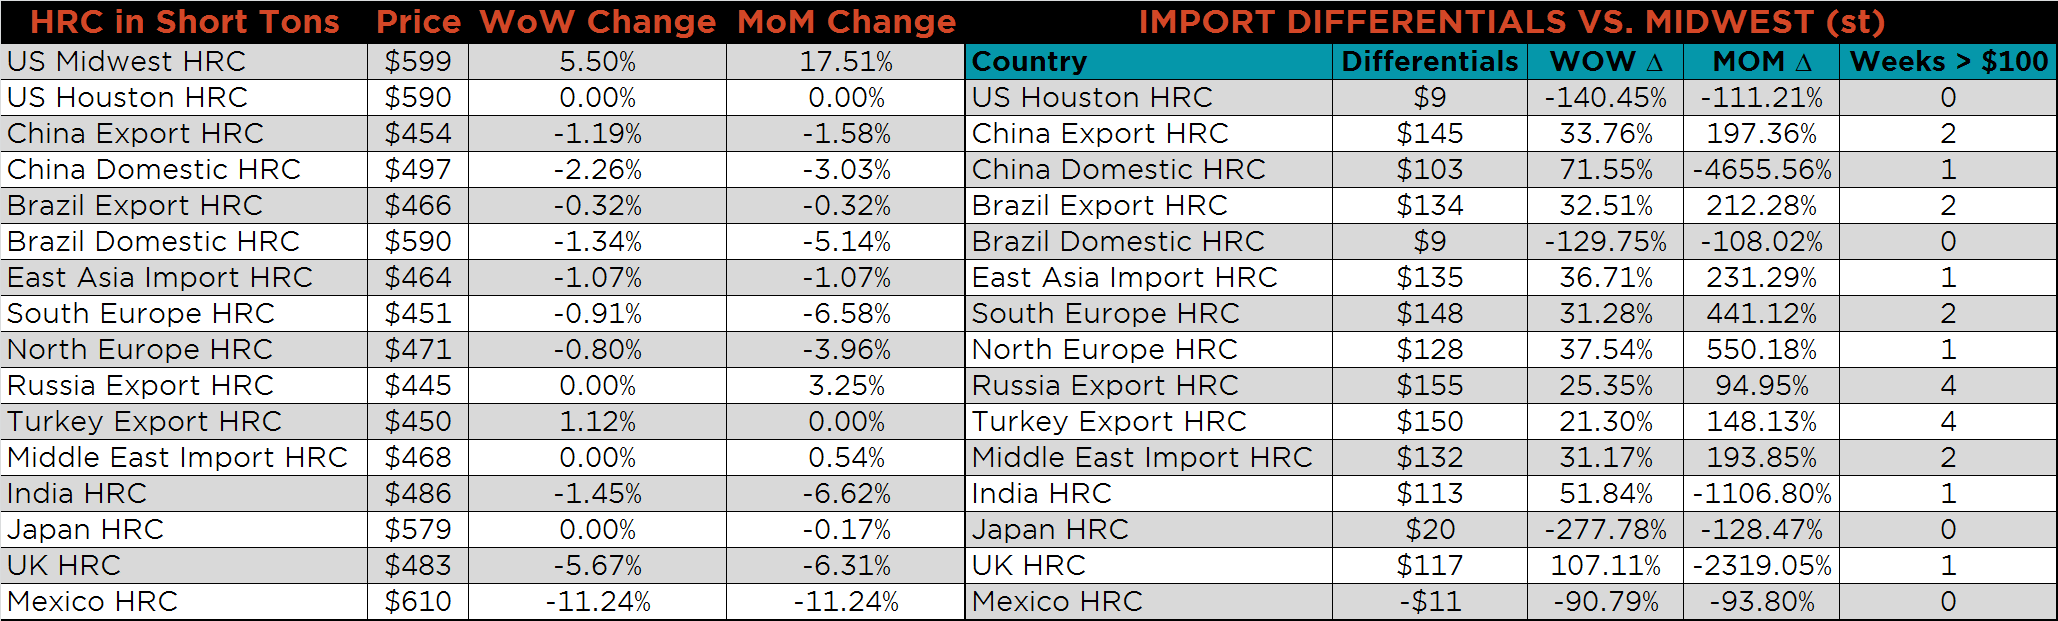
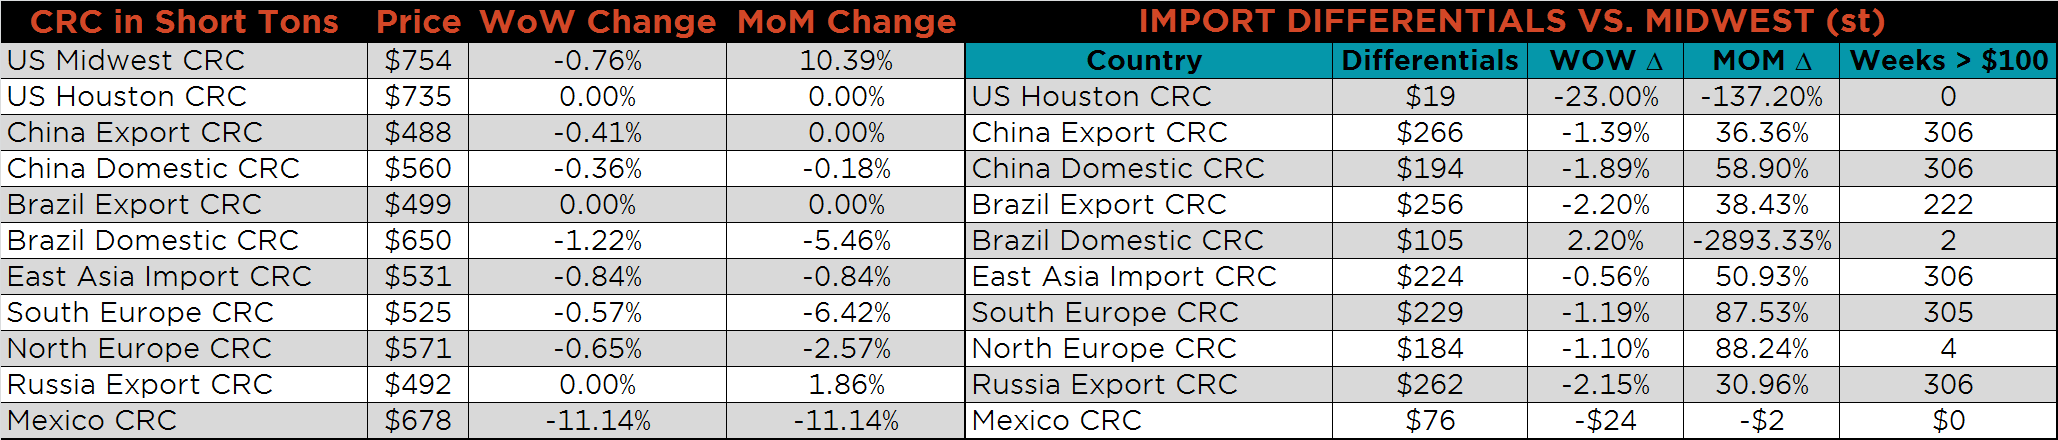
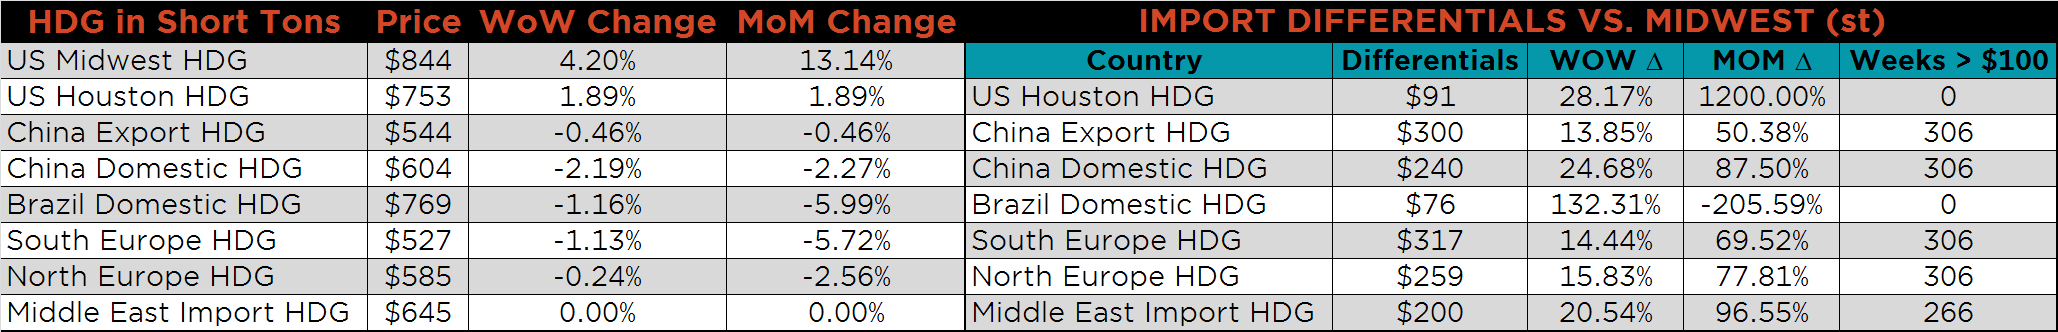
Below is the Midwest HRC price vs. each listed country’s export price using pricing from SBB Platts. We have adjusted each export price to include any tariff or transportation cost to get a comparable delivered price. Differentials continue to increase as U.S. domestic prices rise, while weak global demand is pressuring the global price.
SBB Platt’s HRC, CRC and HDG pricing is below. Midwest HRC and HDG prices were higher on the week up 5.5%, 4.2%, respectively, while the CRC price was down 0.8%. The Mexican HRC and CRC prices were down significantly, 11.2% and 11.1% respectively.
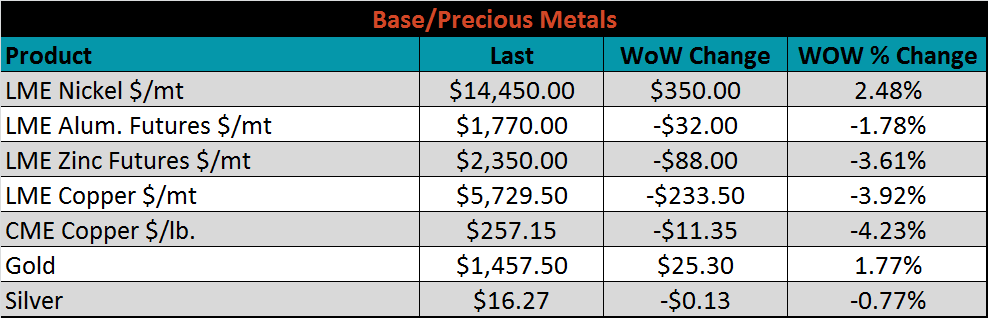
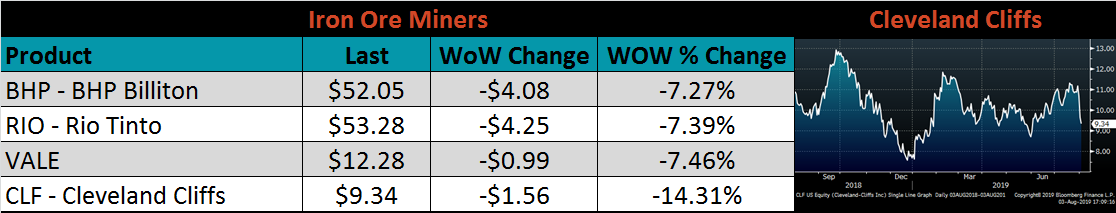
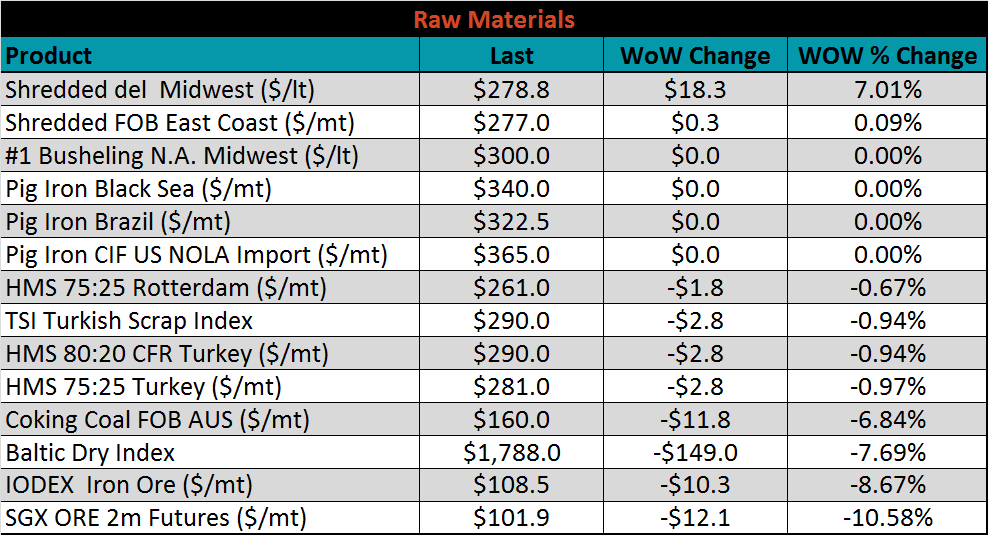
Raw material prices were mostly lower. Midwest delivered shredded was the exception, up 7%, while ore futures and the IODEX were down 10.6% and 8.7%, respectively.
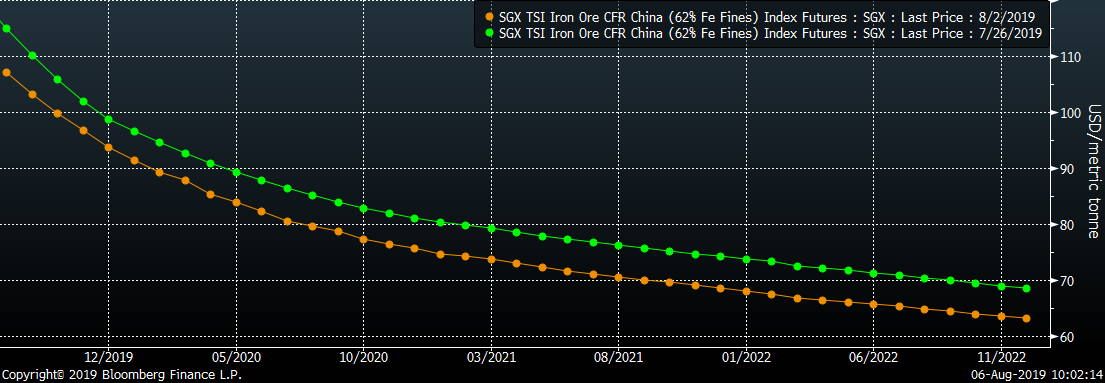
Below is the iron ore future curve with Friday’s settlments in orange, and the prior week’s settlements in green. Iron ore has seen significant declines in price, and the steep backwardatation is easing.
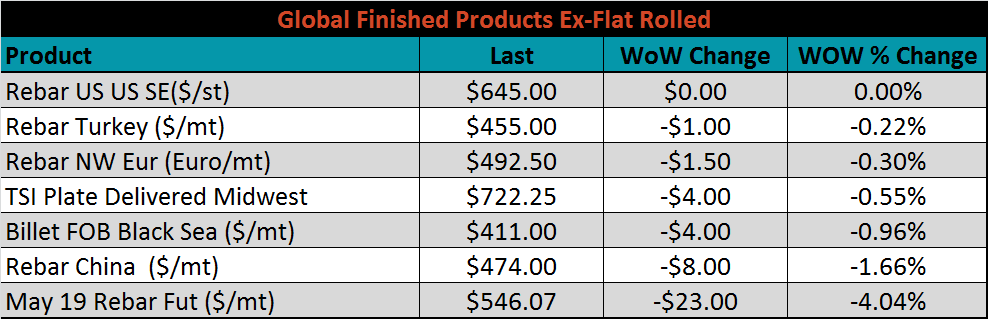
The ex-flat rolled prices are listed below.

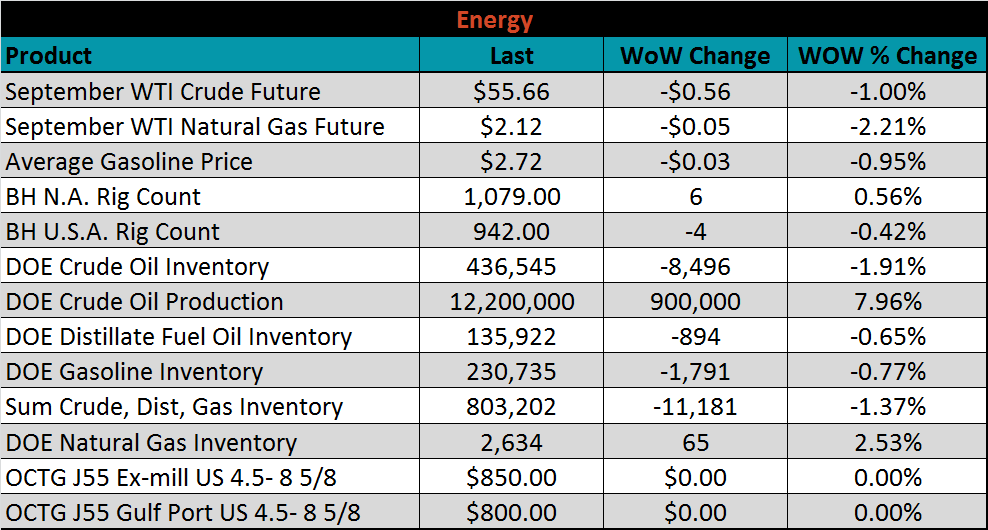
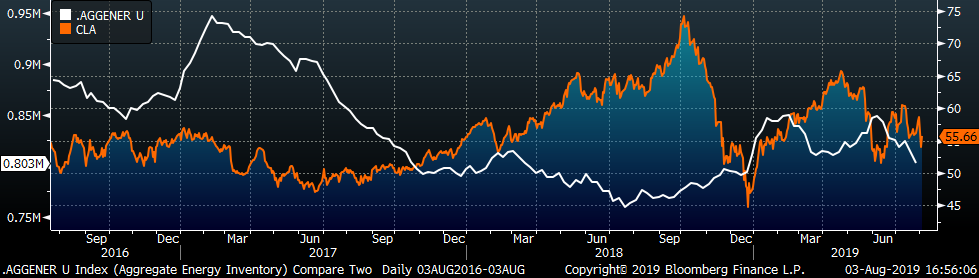
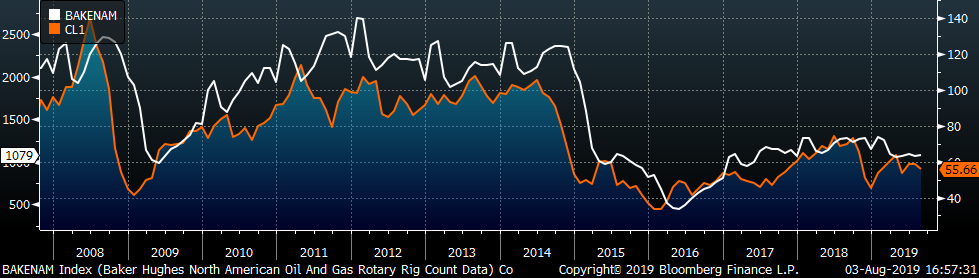
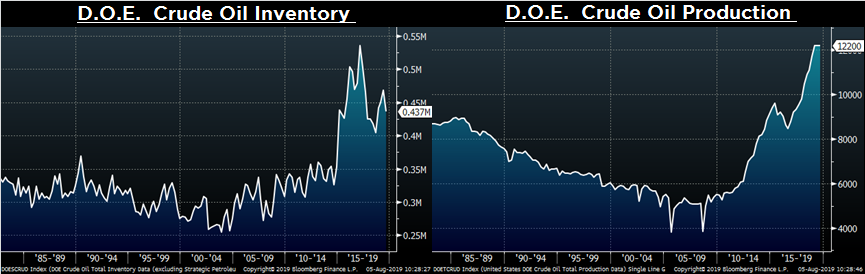
Last week, the Sep WTI crude oil future lost $0.56 or 1% to $55.56/bbl. The aggregate inventory level was up 1.4%, and crude oil production rose back to 12.2m bbl/day. The Baker Hughes North American rig count gained six rigs and the U.S. count lost another for rigs.
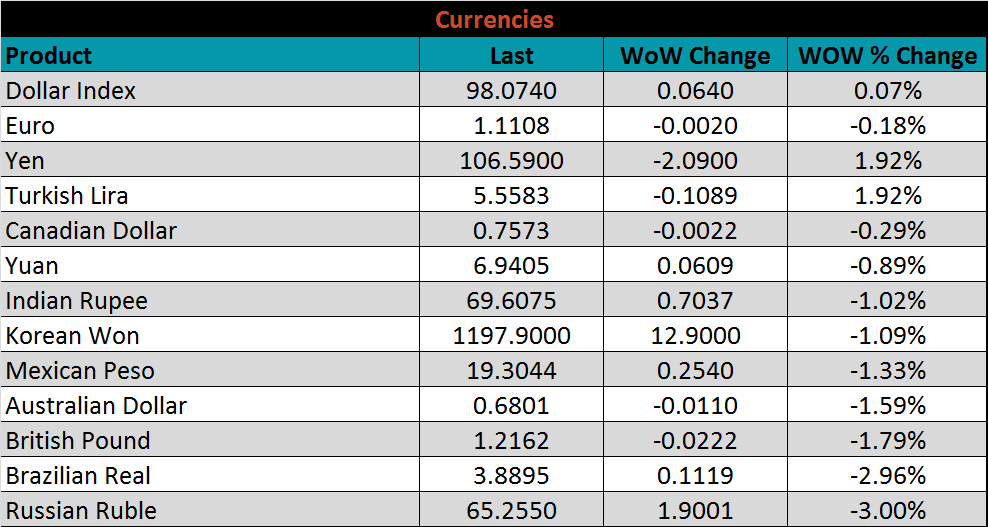
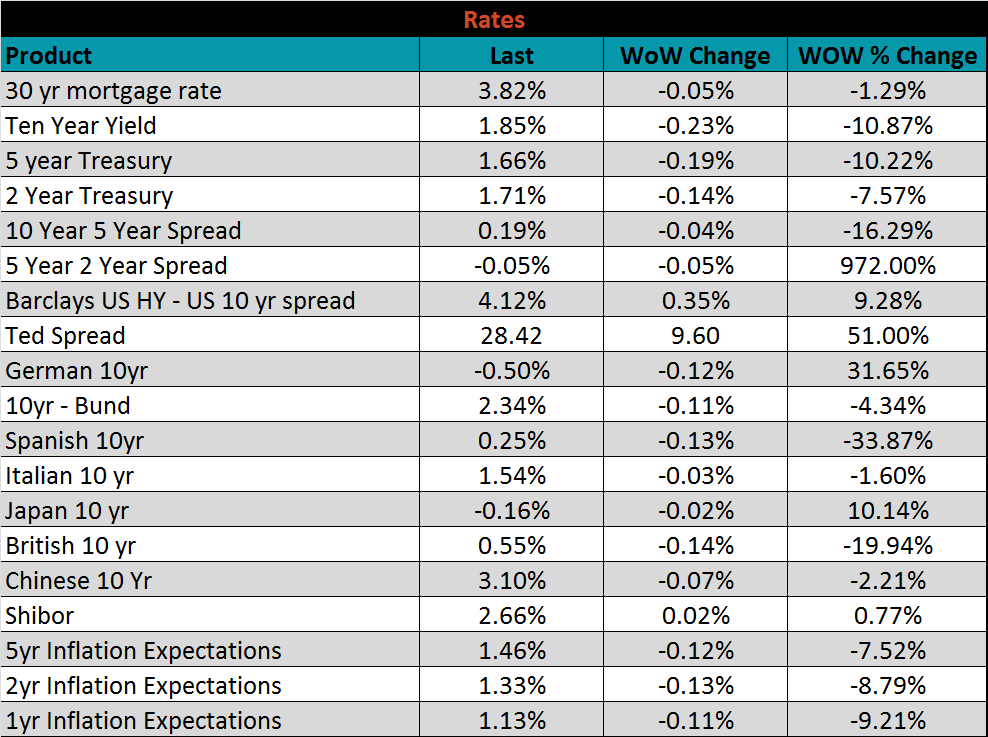
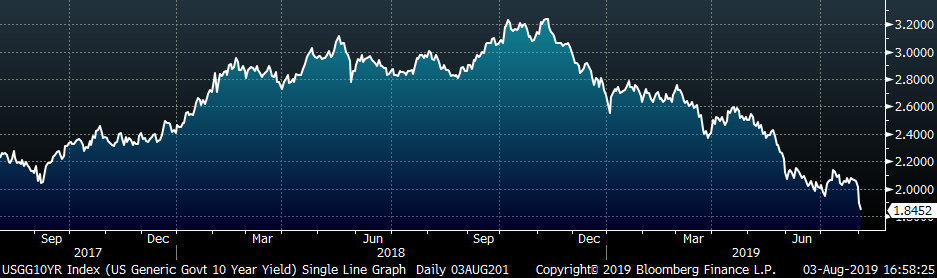
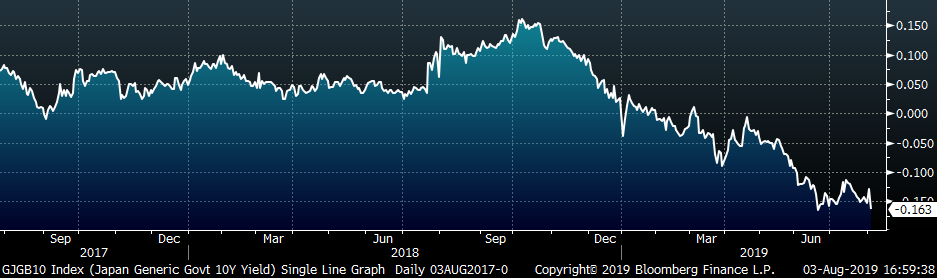
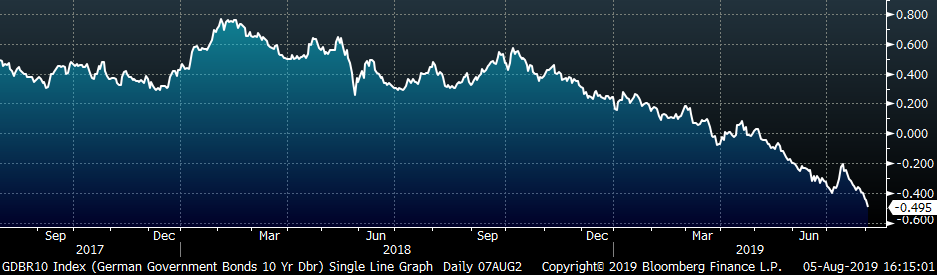
The U.S. 10-year yield was down 23 bps, closing the week at 1.85%. The German 10-year yield was down another 12 bps to minus 0.5% and the Japanese 10-year yield was down 2 bps to minus 0.16%. Yields across the globe plummeted last week, possibly signaling slower economic growth.
The list below details some upside and downside risks relevant to the steel industry. The orange ones are occurring or look to be highly likely. The upside risks look to be in control.
Upside Risks:
Downside Risks: