Content
-
Weekly Highlights
- Market Commentary
- Upside & Downside Risks


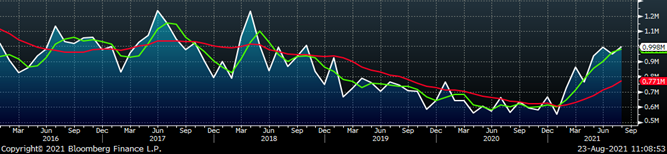
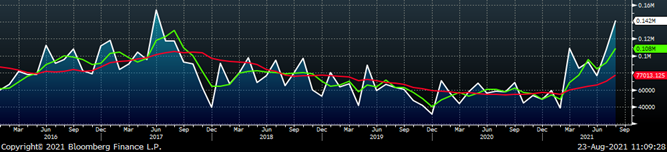
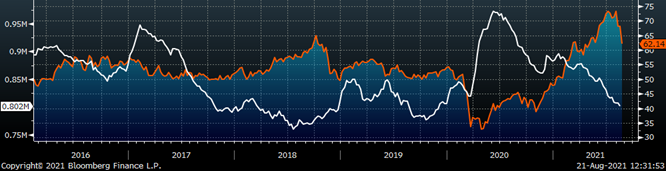
Last week in the physical market, the grind higher in HRC spot pricing continued as participants held their breathe, waiting to see what would come out of the SMU conference in Atlanta. Taking a step back, current tension in the physical market is the result of two misaligned timelines. On one hand, uncertainty and supply chain woes coming from the auto and energy sector have caused more short-term spot ton availability than anyone anticipated for September production. It is also important to recognize, the market has largely absorbed those tons at record high prices, as a sign that pent-up demand remains well in-tact. On the other hand, there are an unprecedented number of planned outages occurring this year, starting in September. We anticipate these dynamics will cause upward price pressure as continued logistical and shipping disruptions will have a heightened impact based on regional supply/demand imbalances.The Mill Fill Index (below) represents tonnage per month that domestic mills must fill based on changes in inventory, shipments, and imports at service centers.
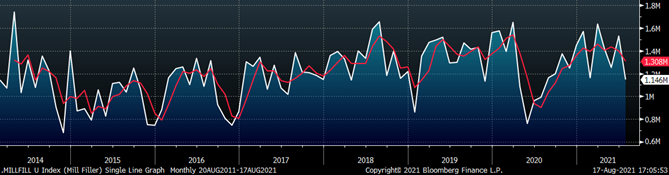
This month, the index shifted lower in July to 1.15 million tons, which is the lowest level since the beginning of our current rally and just below the 5-year average. The main driver of this month’s move came from a larger decrease in shipments, as opposed to a slight increase in inventories, which remain 24% below their 10-year historical average. Current commentary around service center inventory levels is that most are comfortable carrying lower inventories until prices subside, however, this could lead to additional upside price risk if shipments remain elevated while the mills go through their planned outages. Next week has been circled for months by service centers, OEMs, and mills, as contracts were largely placed on hold until after the SMU conference, which concludes on Wednesday, August 25th. Leading up to this point in negotiations, there has been discipline from both sides as end-users are reluctant to do any speculative restocking at these prices, and with the 2018-19 price decline fresh in everyone’s mind. With that said, there has been significant consolidation among mills and the pandemic wreaked havoc on established supply chains. With all of this in mind, we believe there will be a premium for reliable availability in all 2022 contracts and the best opportunity for next year remains in the futures curve, where there is a 30% discount to current spot prices.
Below are the most pertinent upside and downside price risks:
Upside Risks:
Downside Risks:
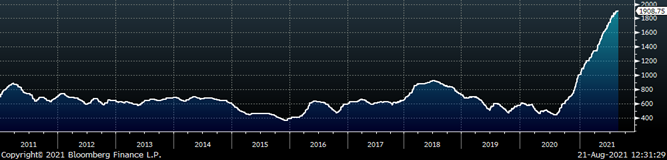
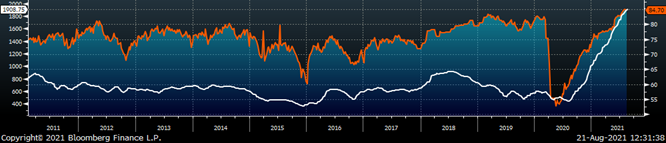
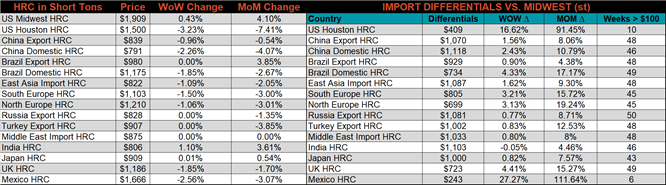
The Platts TSI Daily Midwest HRC Index increased by $8.25 to $1,908.75.
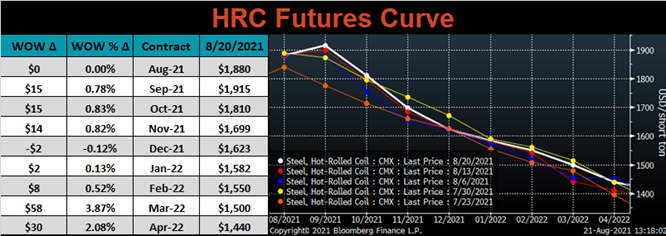
The CME Midwest HRC futures curve is below with last Friday’s settlements in white. Last week, the front of the curve was slightly higher, while the back of the curve was up more significantly.
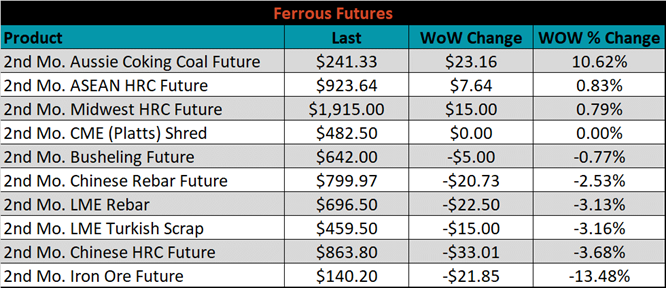
October ferrous futures were mixed. Aussie coking coal future gained another 10.6%, while iron ore lost another 13.5%.
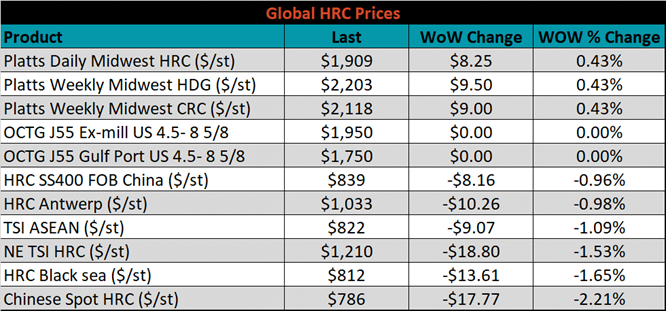
Global flat rolled indexes were mixed. The TSI Platts Midwest HRC price was up another 0.4%, while the Chinese spot HRC price was down 2.2%.
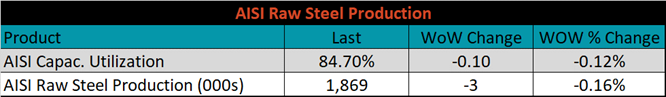
The AISI Capacity Utilization rate decreased 0.1% to 84.7%.
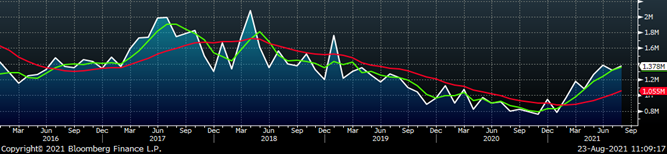
August flat rolled import license data is forecasting an increase of 48k to 998k MoM.
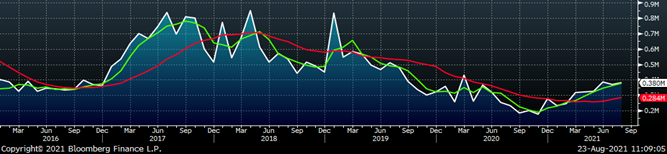
Tube imports license data is forecasting an increase of 12k to 380k in August.
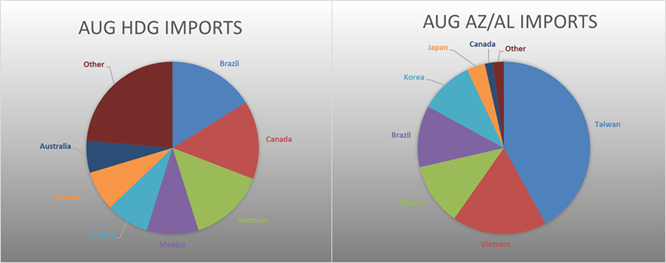
August AZ/AL import license data is forecasting an increase of 35k to 142k.
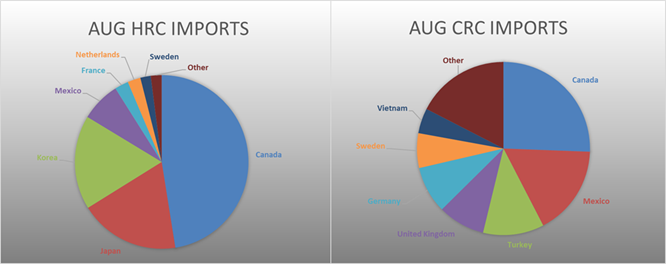
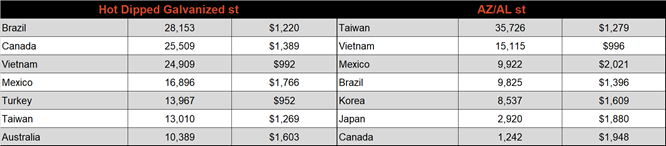
Below is August import license data through August 16th, 2021.
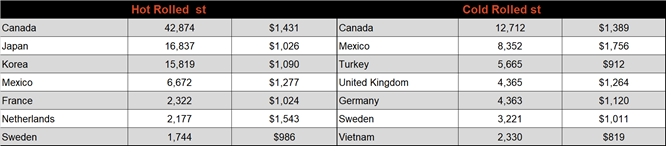
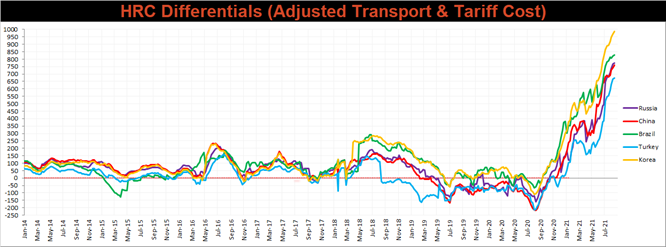
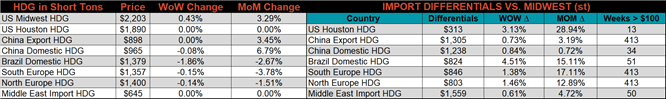
Below is the Midwest HRC price vs. each listed country’s export price using pricing from SBB Platts. We have adjusted each export price to include any tariff or transportation cost to get a comparable delivered price. Differentials for all watched countries increased further this week, as the U.S. price continues grinding higher.
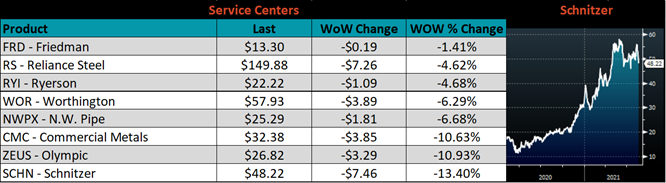
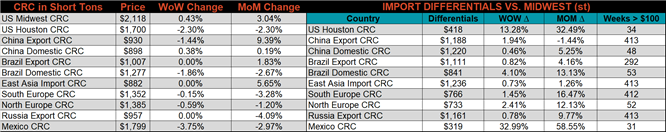
SBB Platt’s HRC, CRC and HDG pricing is below. The Midwest HRC, CRC, & HDG prices were each up by 0.4%, respectively. Globally, the Mexican domestic CRC price was down 3.8%.
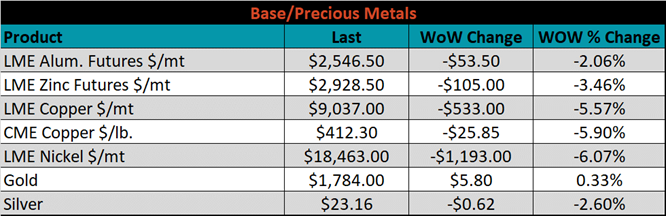
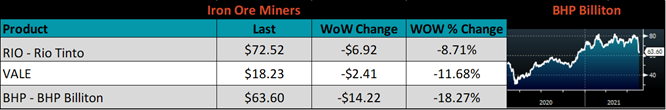
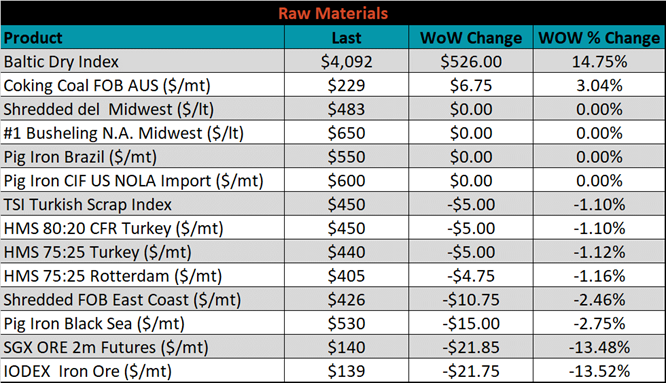
Raw material prices were mostly lower, led by the IODEX iron ore index, down another 13.5%, while Aussie coking coal was up another 3%.
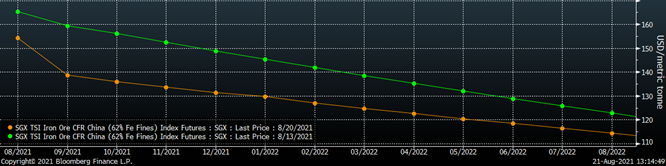
Below is the iron ore future curve with Friday’s settlements in orange, and the prior week’s settlements in green. Last week, the entire curve continued it’s 5 week decline and shifted another step lower.
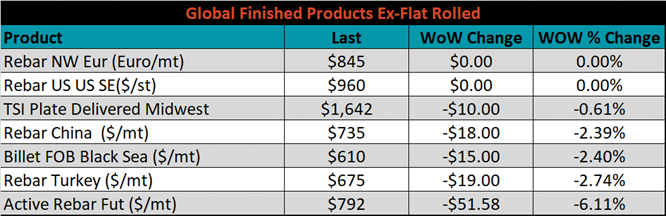
The ex-flat rolled prices are listed below.

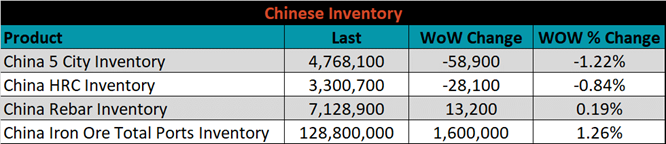
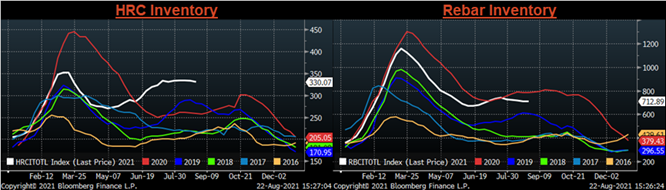
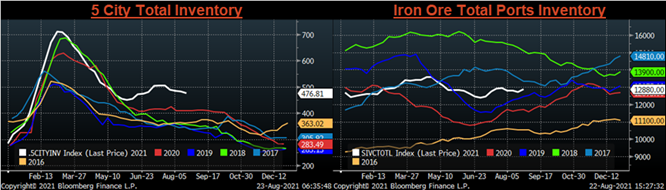
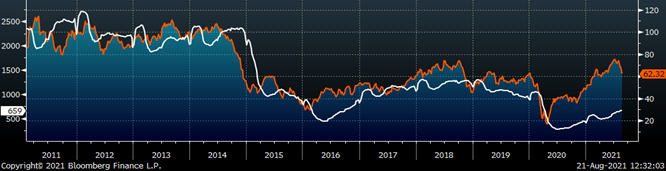
Below are inventory levels for Chinese finished steel products and iron ore. HRC and the 5-city inventory levels continued to decrease, as government actions appear to have finally taken their effect on production. On the other hand, the historic collapse in the iron ore price may lead to additional inventory increases, like we’ve seen over the last 3 weeks.
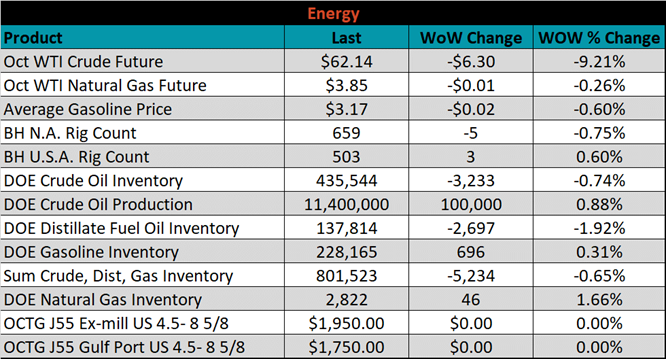
Last week, the October WTI crude oil future was down $6.30 or 9.2% to $62.14/bbl. The aggregate inventory level was down 0.7%, while crude oil production rose to 11.4m bbl/day. The Baker Hughes North American rig count was down 5 rigs, while the U.S. rig count was up 3 rigs.
The list below details some upside and downside risks relevant to the steel industry. The bolded ones are occurring or highly likely.
Upside Risks:
Downside Risks: