Content
-
Weekly Highlights
- Market Commentary
- Risks


The recent HRC price rally continued last week, with spot indexes moving up towards $475/st. Mills are refusing to take orders at lower prices that were easily available in prior weeks, signaling the strength of their orders books. Across the board, the viewpoint is that mills are currently overbooked, pushing out lead times and leaving minimal tonnage available for the spot market. However, there have been few transactions in the spot market, allowing small tonnage deals to push spot indexes higher rather than broad support for higher prices from the buying community. We are still several weeks away from an inflection point where buyers must return to the spot market to replenish material that was purchased over the past few months near $400/st. Most of these companies are still working through or waiting to receive this material, leaving their buyers on the sidelines for now.
With that being said, both the sentiment among those who are participating in the spot market and several short-term market dynamics are supportive of higher prices. First, import levels remain at historically low levels and there have been rumors of adjustments to Brazil’s fourth quarter quota to limit additional slabs into year-end. Moreover, the strength in global ferrous market prices means import material is not a viable alternative, limiting the supply in the domestic market. Next, domestic production levels remain depressed, and maintenance outages over the next few months will further limit domestic supply. Finally, the scrap market appears to have bottomed in August, and the expectation is for busheling to trade up $30/t in September as the market tightens. These forces, among others, are supporting the current price, but the vital question is – What will drive prices higher from here?
Sentiment can have an outsized role in commodity pricing, and specifically in the ferrous market where, for example, the simple belief that prices will fall causes buyers to wait for lower prices. This sentiment is often driven, right or wrong, by recent price levels and the trend in prices. The chart below shows the past two years of the Platts Daily Midwest HRC Index.
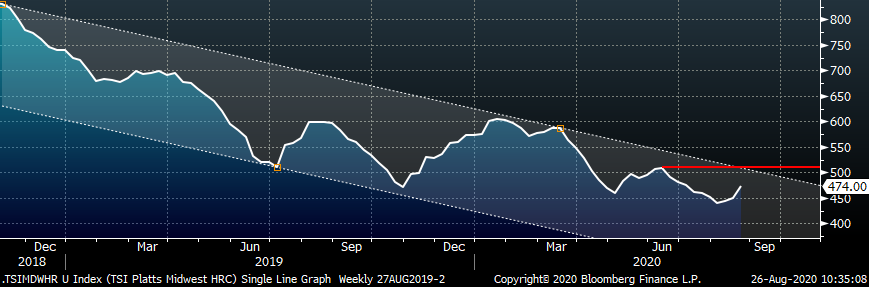
While prices have rallied slightly, they remain in the same long-term downtrend that started in the second half of 2018. Downtrends are characterized by lower bottoms and lower peaks in each successive price cycle. If buyers believe that prices will not surpass the peak in June of approximately $510, they will likely hold off on buying until they are able to restock at lower levels. However, if prices continue toward $500 over the next few weeks, and buyers need for additional material outweighs their desire for lower prices, we could see a breakout of this downtrend. If breakout prices above this peak present adverse outcomes for your business, we recommend you lock in prices today in either the spot or forward markets. Price breakouts tend to occur swiftly and intensely.
Below are the most pertinent upside and downside price risks:
Upside Risks:
Downside Risks:
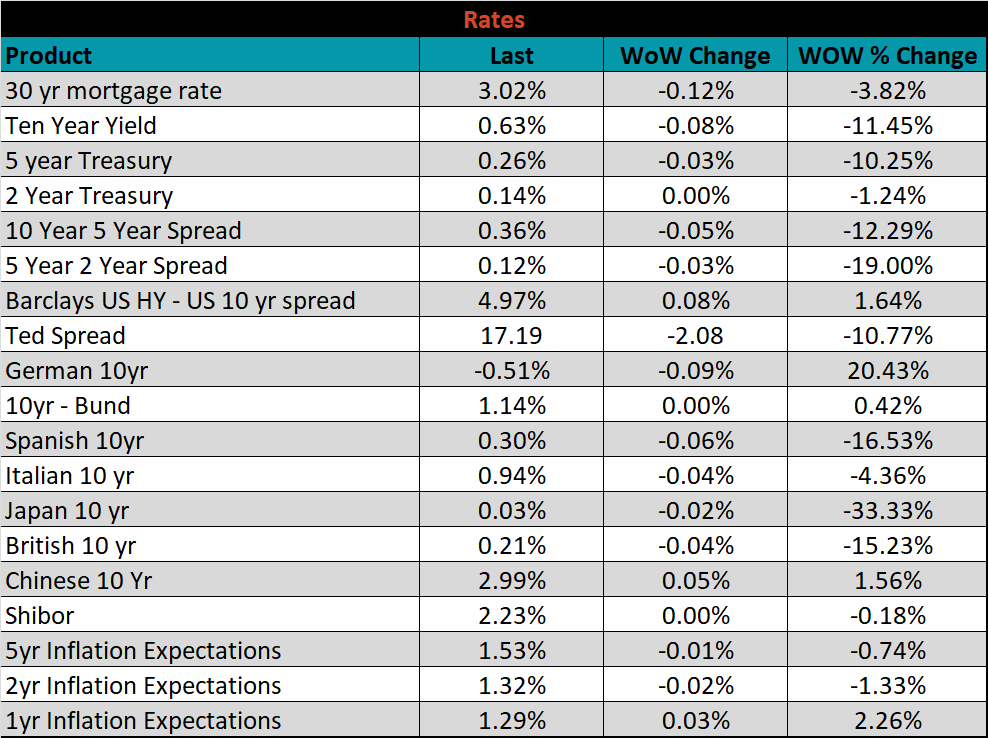
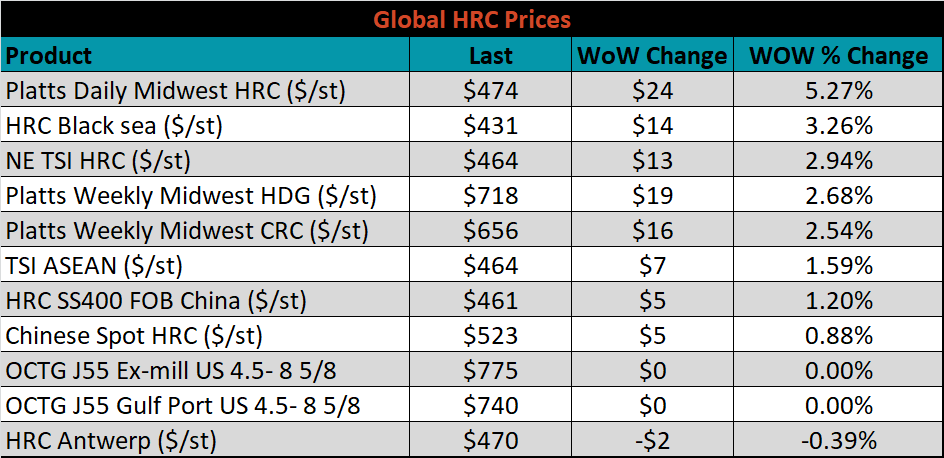
The Platts TSI Daily Midwest HRC Index was up $23.75 to $474.
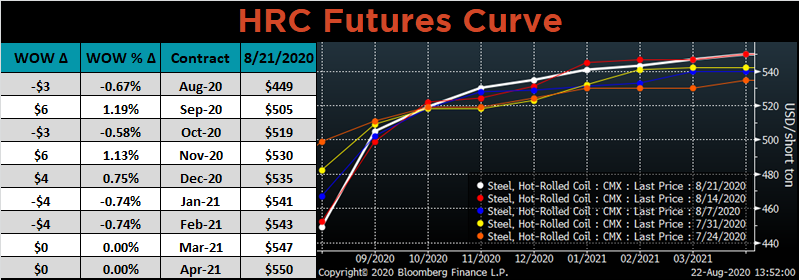
The CME Midwest HRC futures curve is below with last Friday’s settlements in white. The curve was relatively unchanged this week.
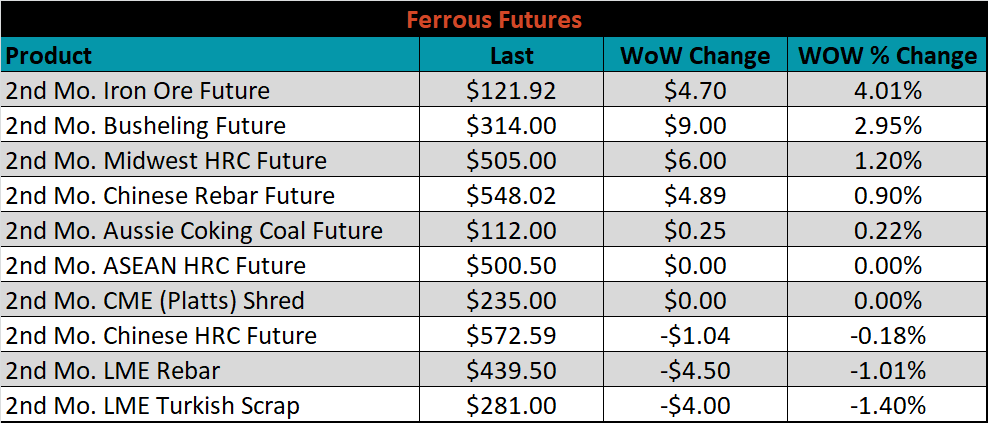
October ferrous futures were mixed. Iron ore gained 4%, while LME Turkish scrap lost 1.4%.
The global flat rolled indexes were mostly higher, led by TSI Midwest HRC, up 5.3%; while TSI Antwerp HRC was down 0.4%.
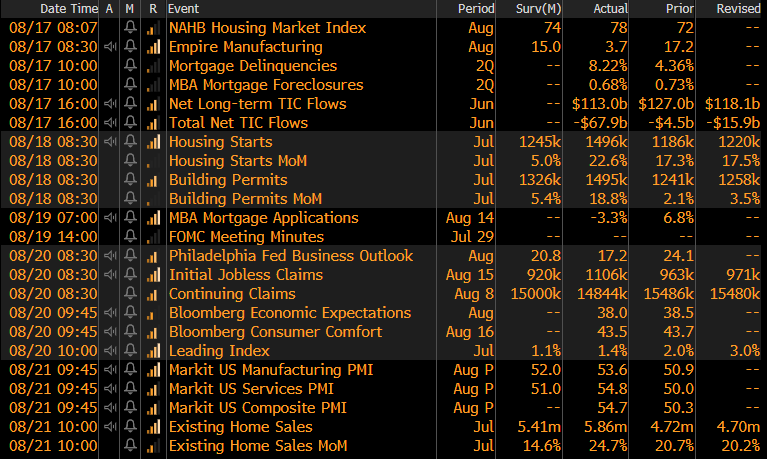
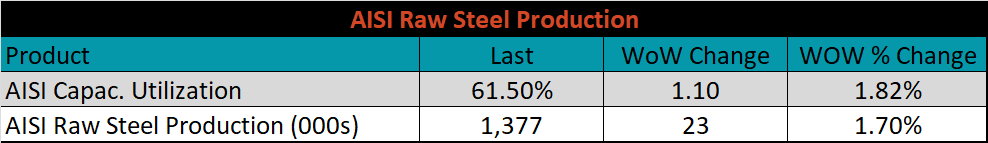
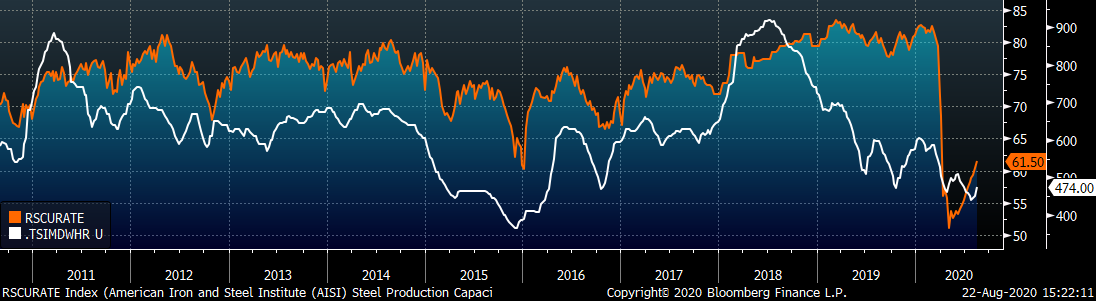
The AISI Capacity Utilization Rate was up another 1.1% to 61.5%.
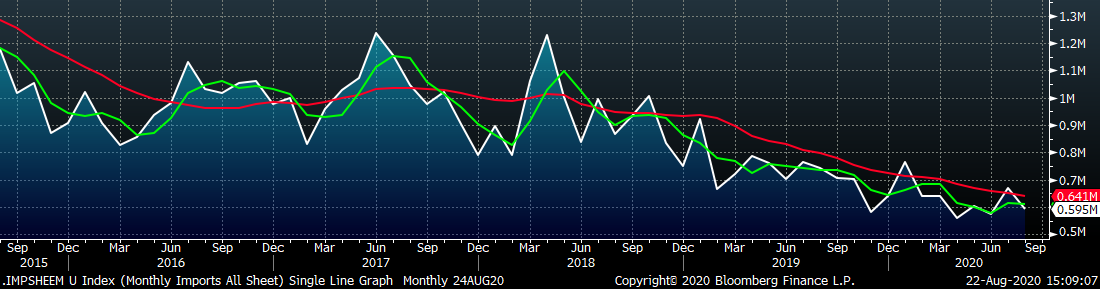
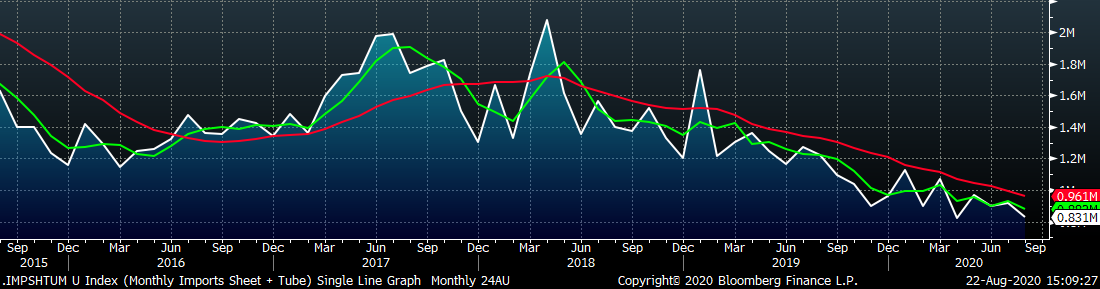
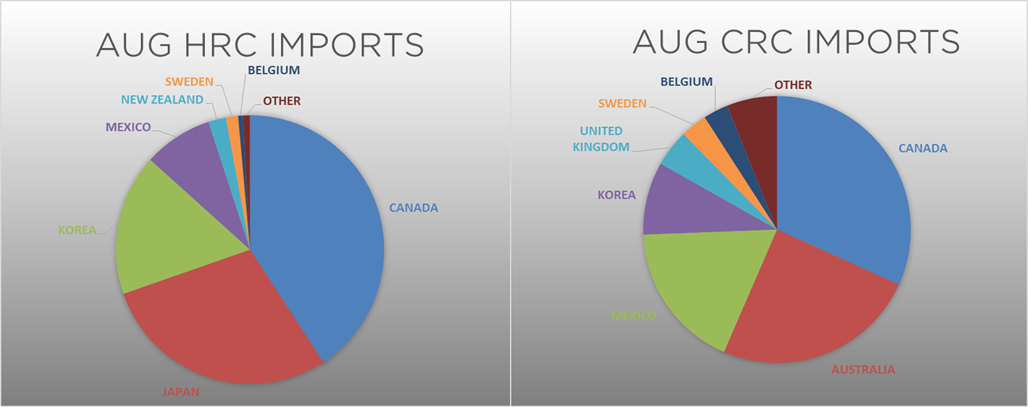
August flat rolled import license data is forecasting a decrease of 77k to 595k MoM.
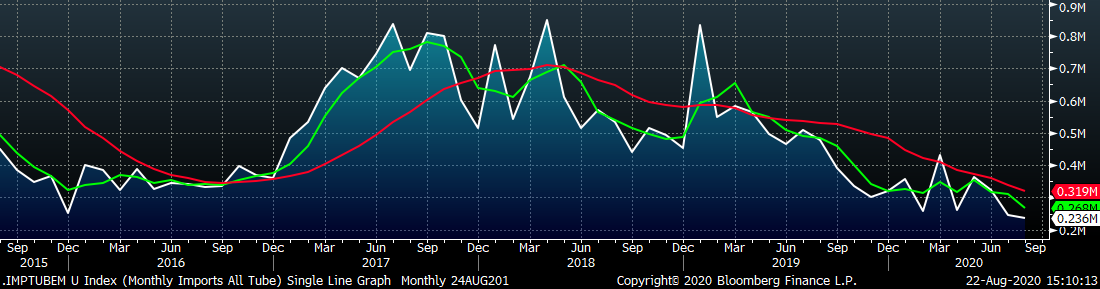
Tube imports license data is forecasting a MoM increase of 16k to 262k tons in August.
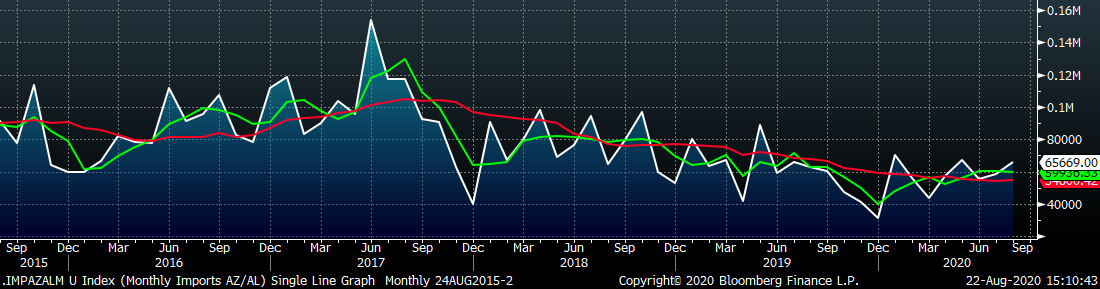
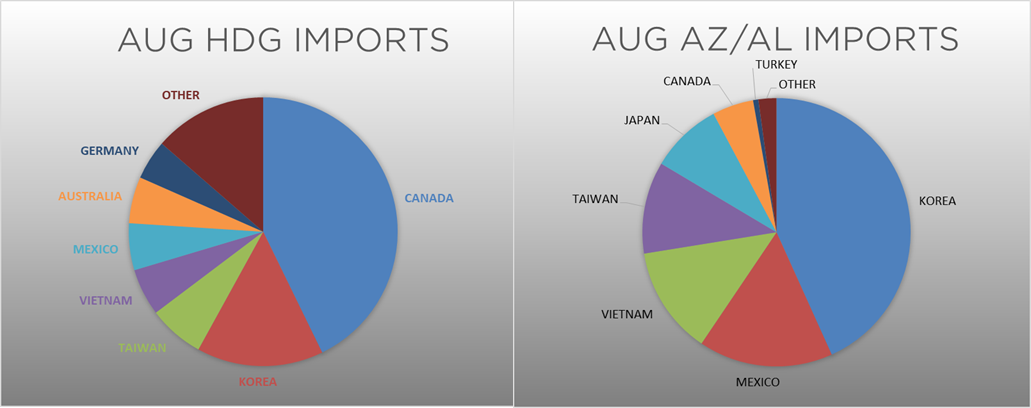
August AZ/AL import license data is forecasting an increase of 7k to 67k MoM.
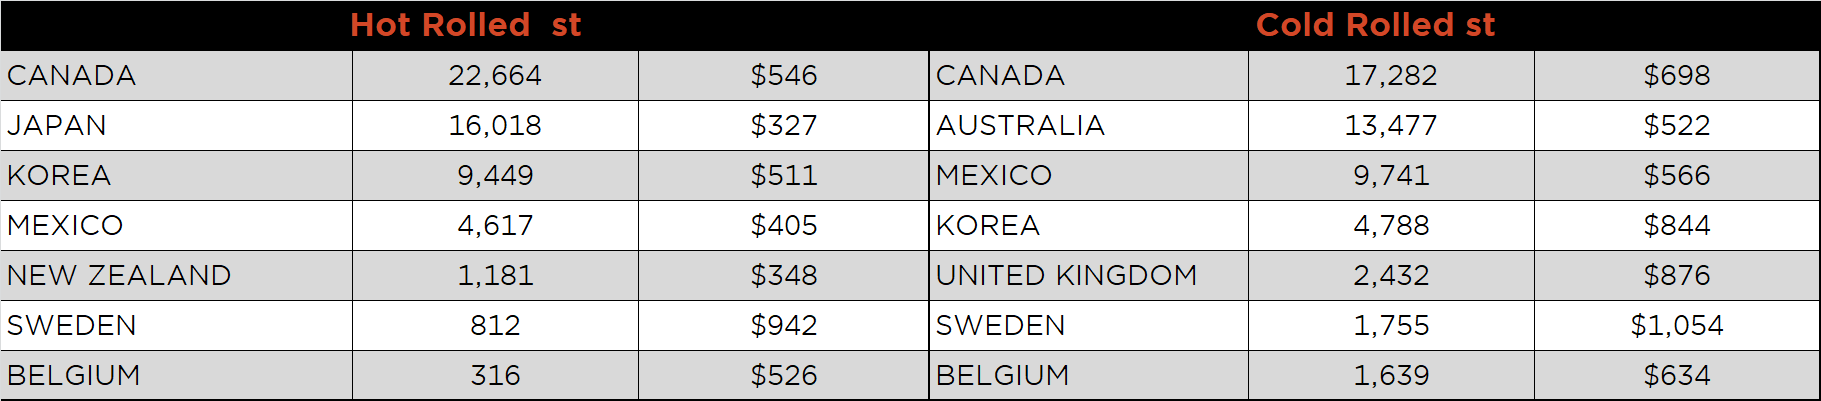
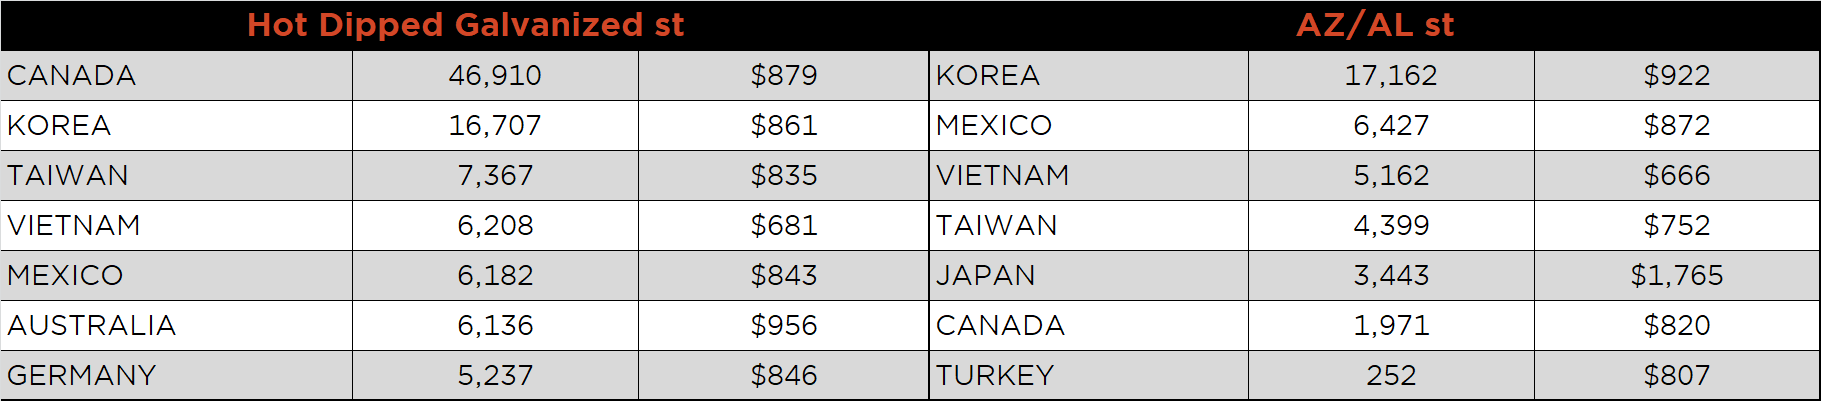
Below is July import license data through August 18, 2020.
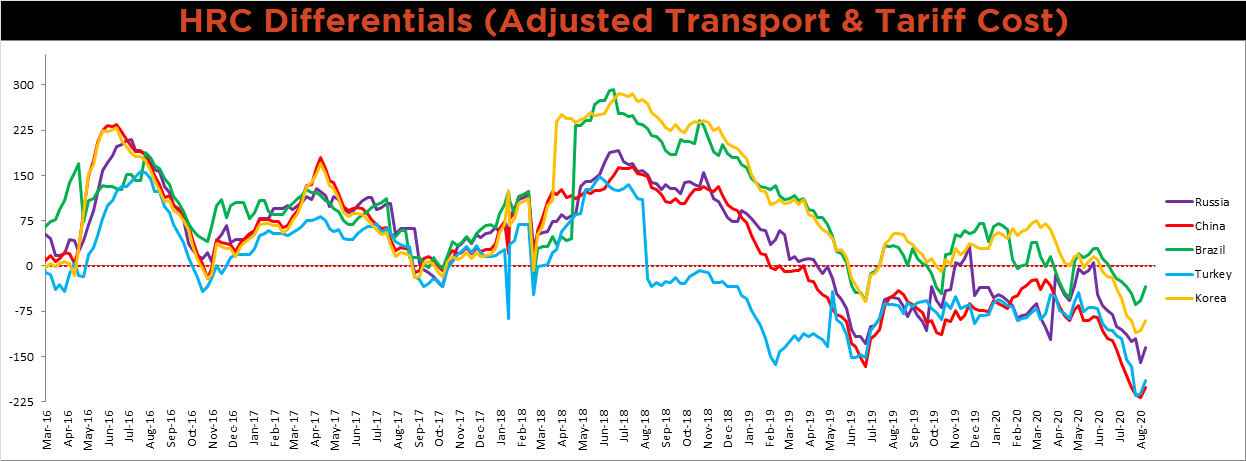
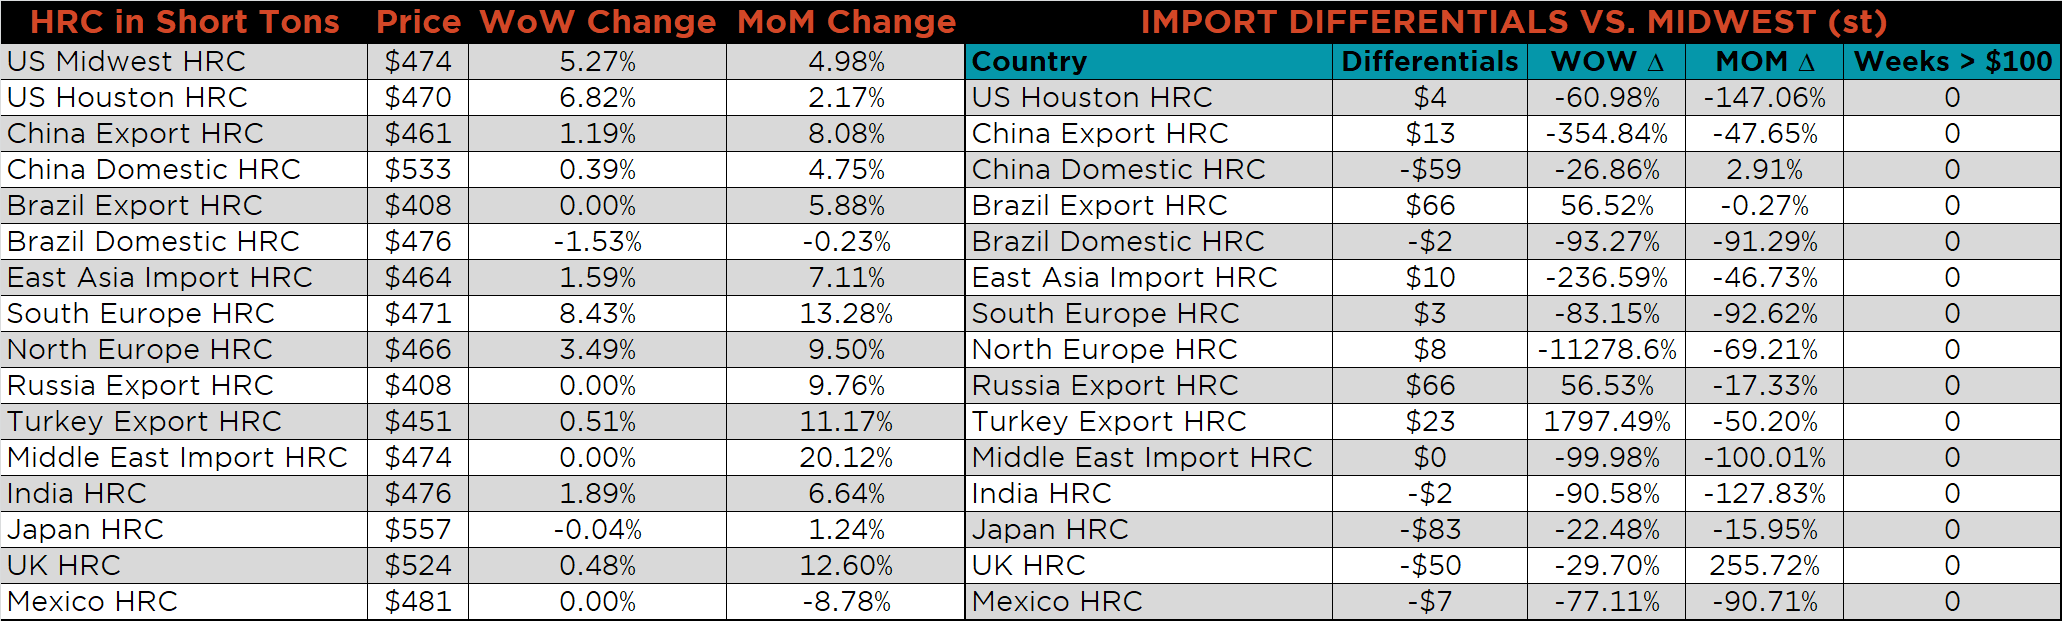
Below is the Midwest HRC price vs. each listed country’s export price using pricing from SBB Platts. We have adjusted each export price to include any tariff or transportation cost to get a comparable delivered price. All the differentials increased significantly as the U.S. domestic price dramatically increased.
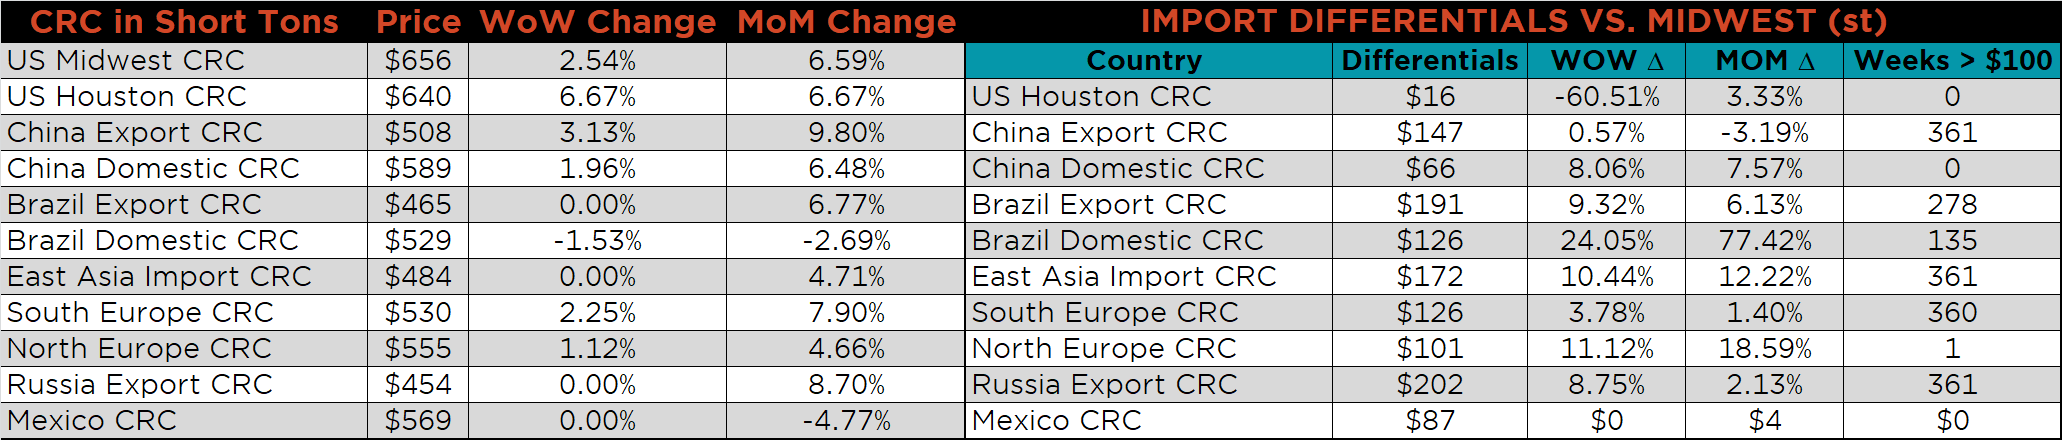
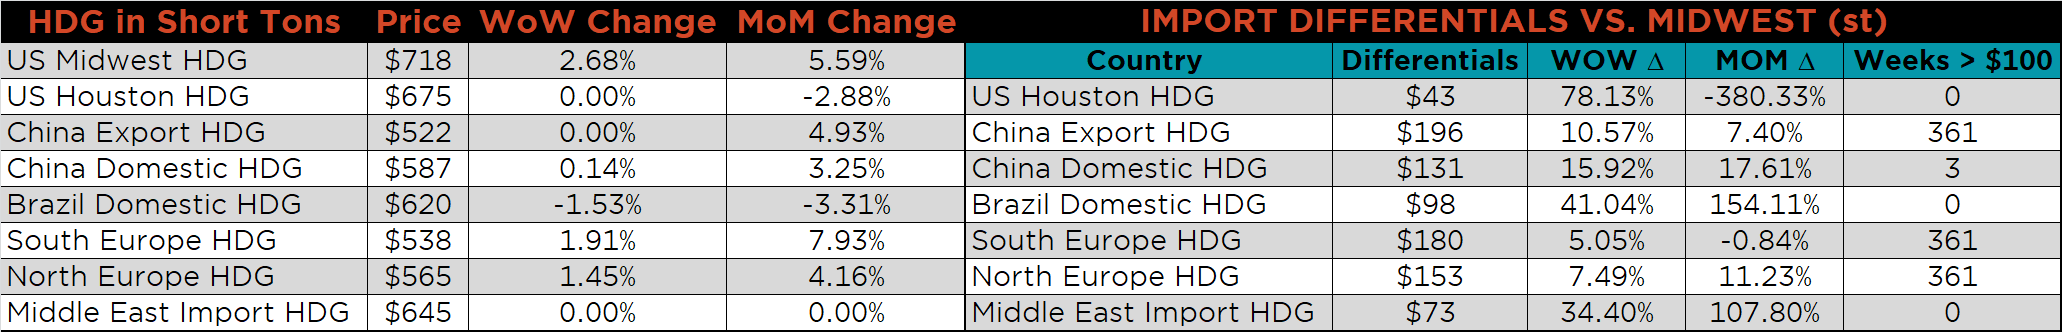
SBB Platt’s HRC, CRC and HDG pricing is below. The Midwest HRC, HDG and CRC prices were up, 5.3%, 2.7% and 2.5%, respectively. Globally, the Chinese export CRC and HRC prices were up, 3.1% and 1.2%, respectively.
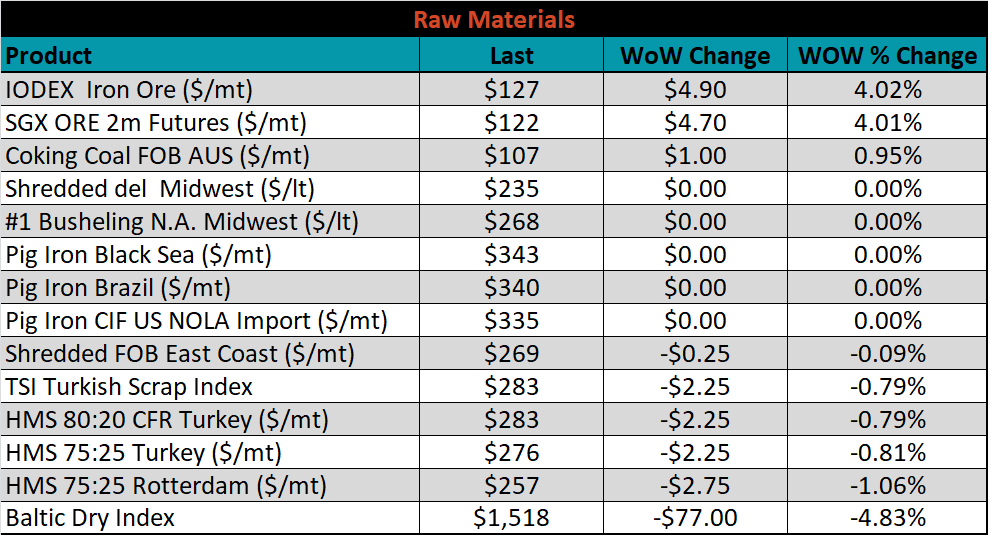
Raw material prices were mixed. The IODEX was up 4%, while Rotterdam HMS was down 1.1%.
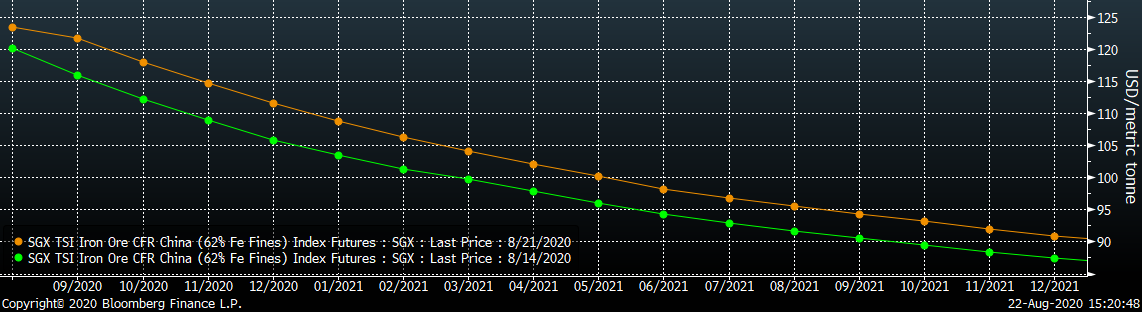
Below is the iron ore future curve with Friday’s settlements in orange, and the prior week’s settlements in green. The curve shifted higher across all expirations.
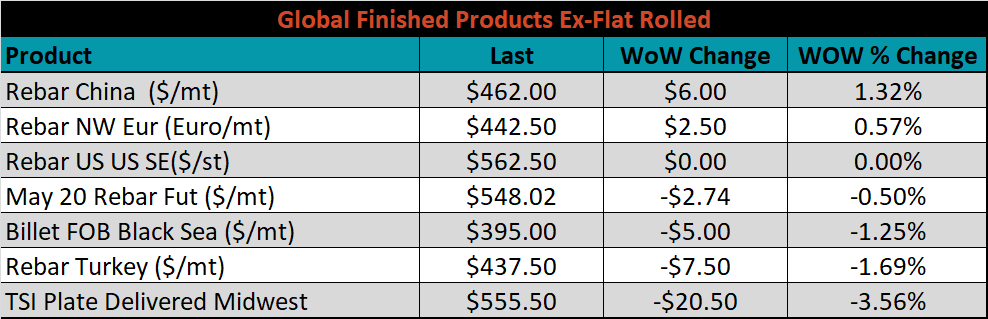
The ex-flat rolled prices are listed below.

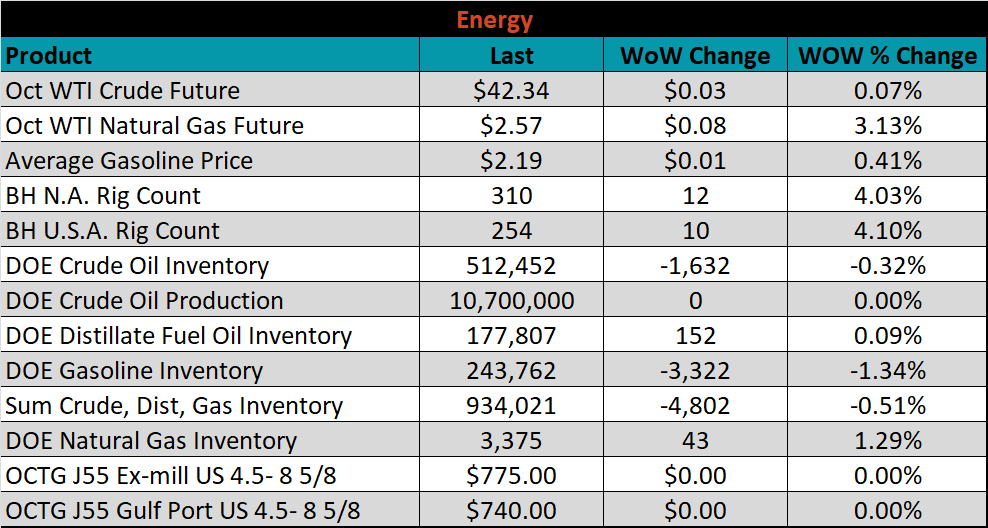
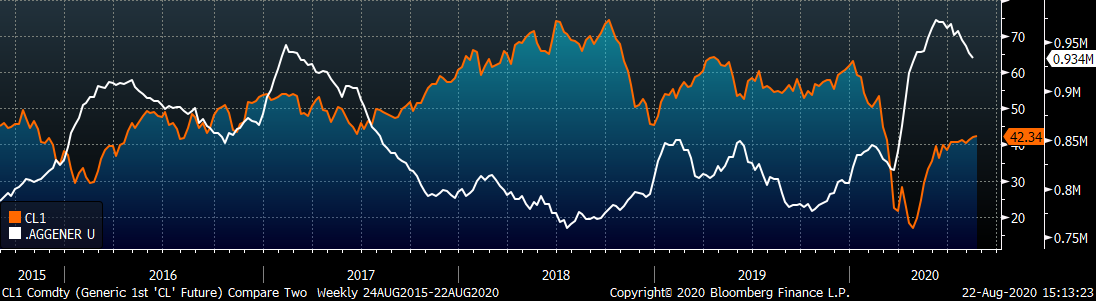
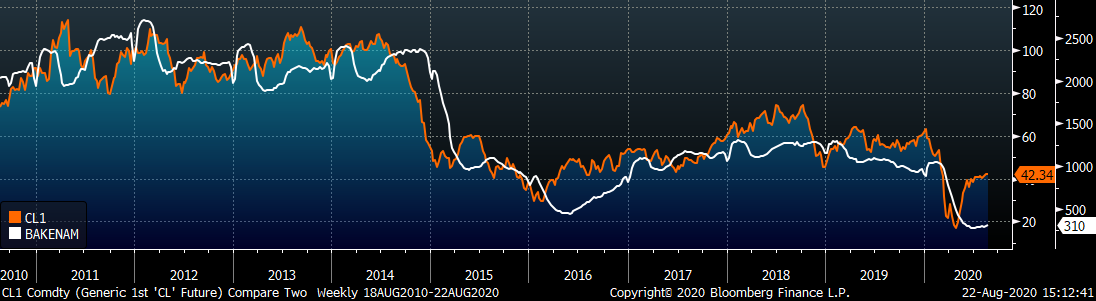
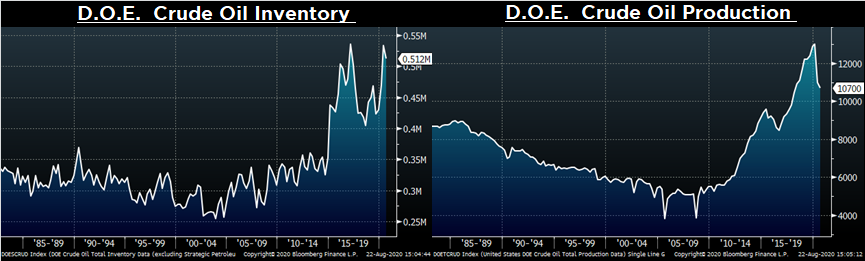
Last week, the October WTI crude oil future gained $0.03 or 0.1% to $42.34/bbl. The aggregate inventory level was down another 0.5%, while crude oil production remains at 10.7m bbl/day. The Baker Hughes North American rig count was up 12 rigs and the U.S. rig count was up 10.
The list below details some upside and downside risks relevant to the steel industry. The orange ones are occurring or look to be highly likely. The upside risks look to be in control.
Upside Risks:
Downside Risks: