Content
-
Weekly Highlights
- Market Commentary
- Risks


Below are the most pertinent upside and downside price risks:
Upside Risks:
Downside Risks:
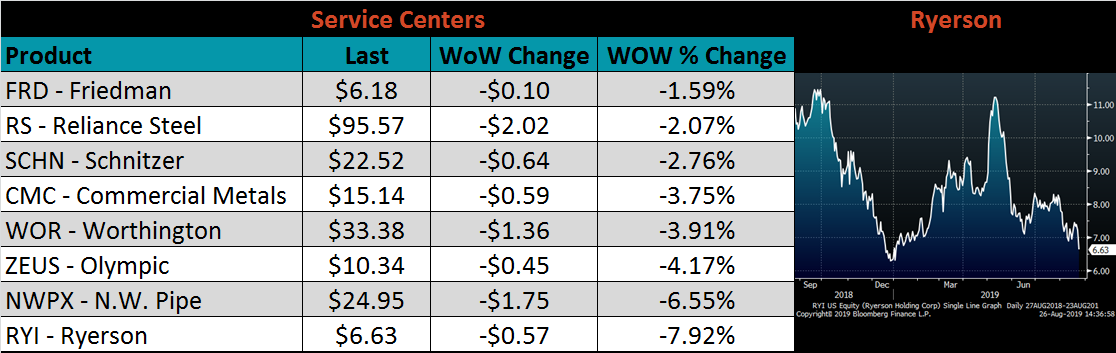
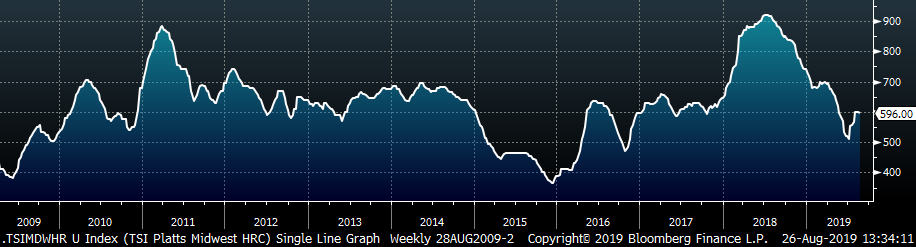
The Platts TSI Daily Midwest HRC Index was down $2.25 to $596.
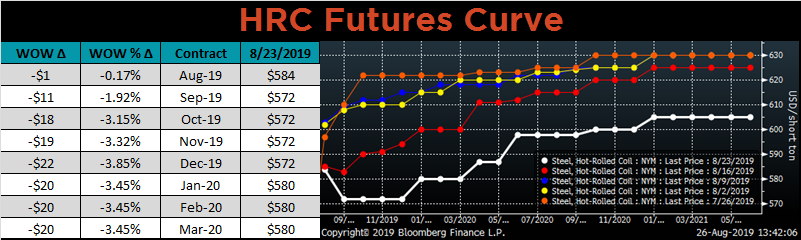
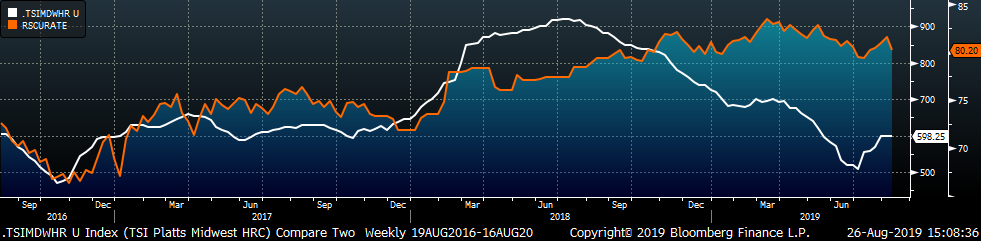
The CME Midwest HRC futures curve, shown below with last Friday’s settlements in white, shifted dramatically lower across all expirations.
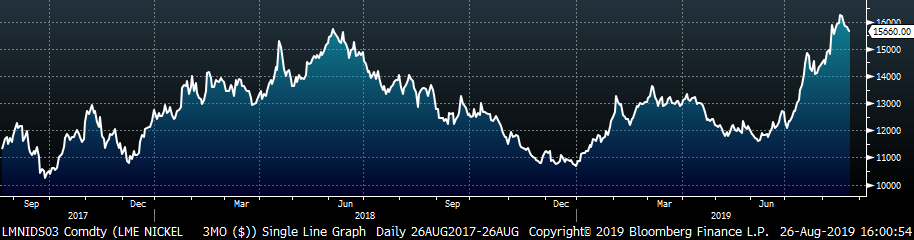
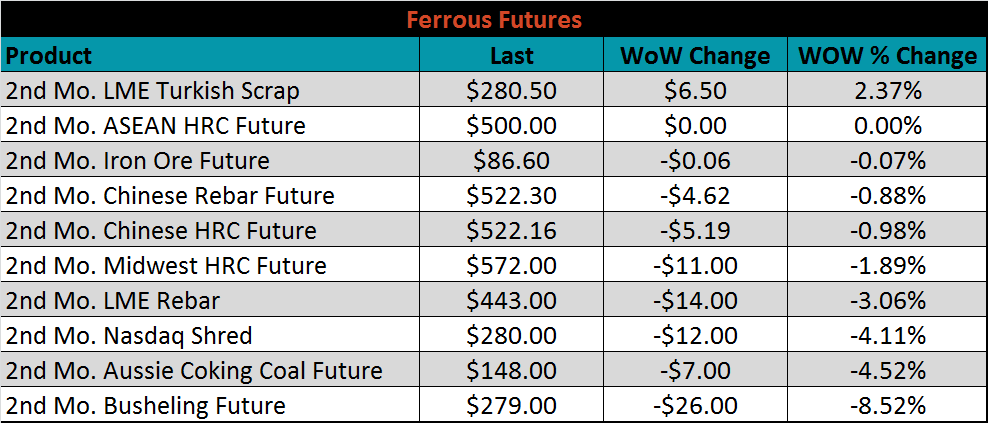
October ferrous futures were mixed. Busheling futures lost 8.5%, while LME Turkish scrap gained 2.4%.
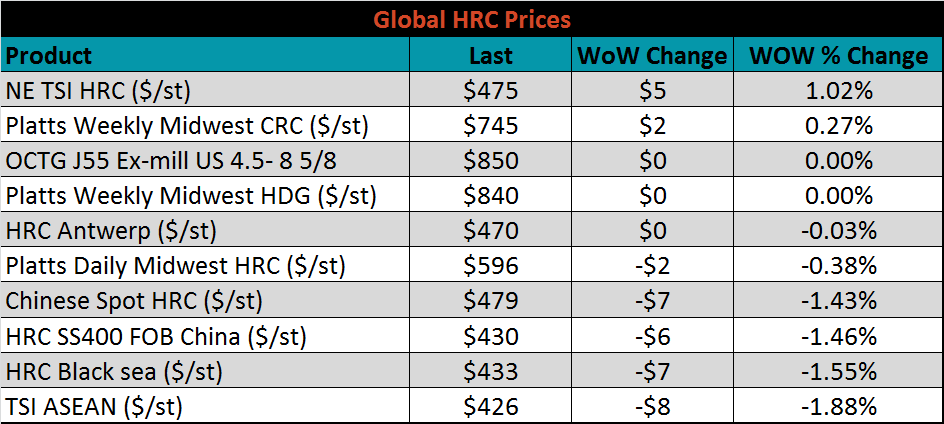
The global flat rolled indexes were mixed. Northern European HRC was up 1%, while ASEAN HRC was down 1.9%.
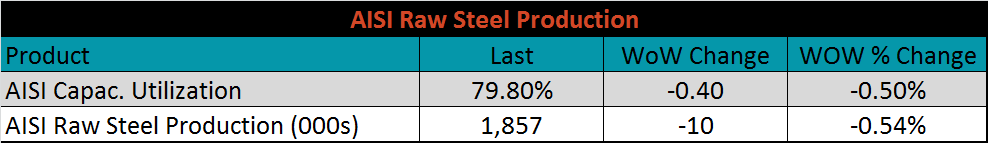
The AISI Capacity Utilization Rate fell again last week, down 0.4% to 79.8%. This rate has been hovering around the 80% goal set by the Trump administration since October.
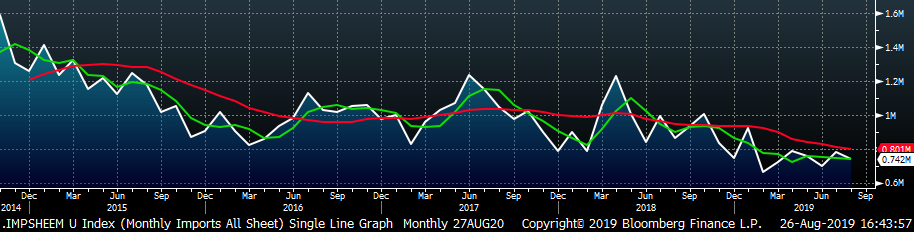
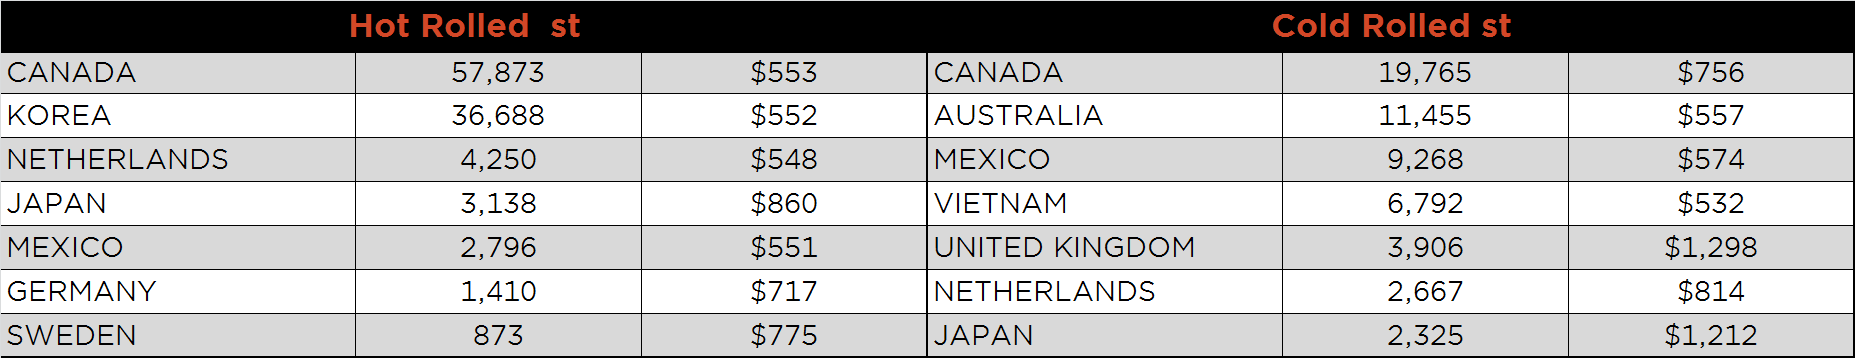
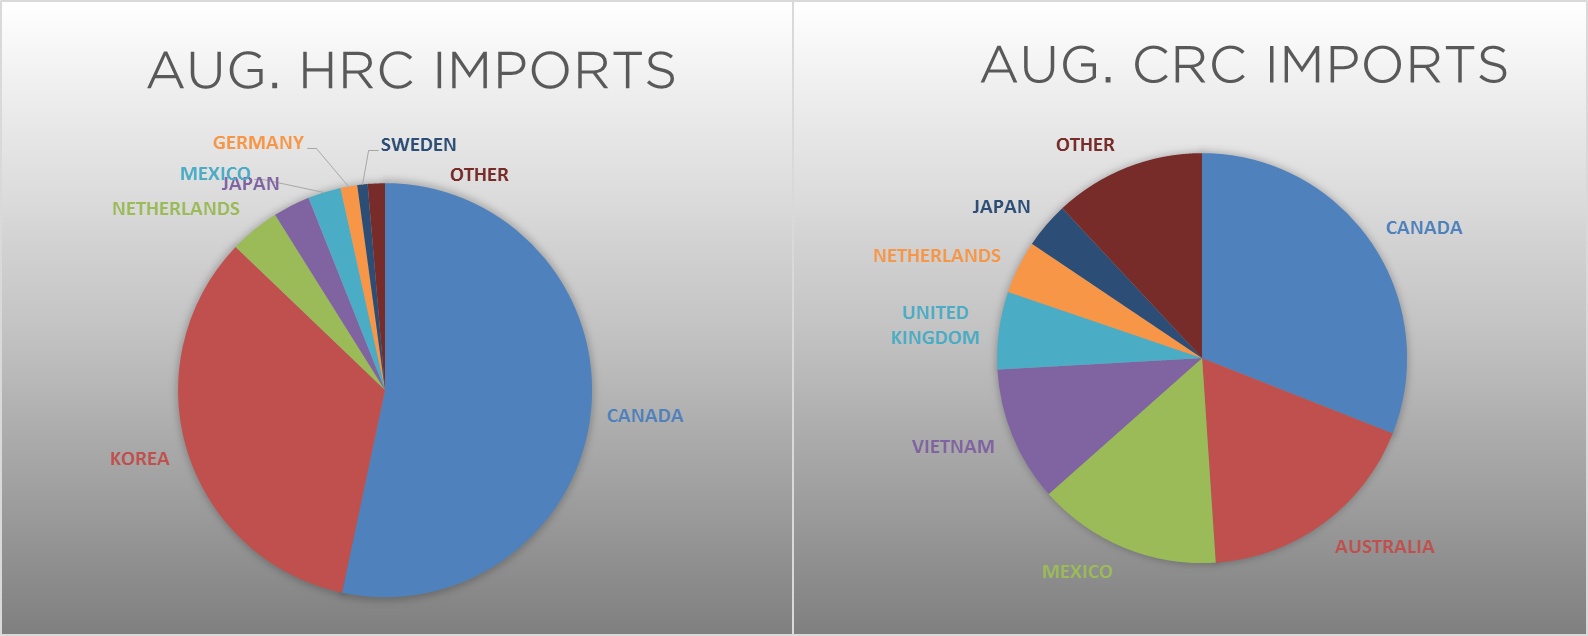
August flat rolled import license data is forecasting a decrease of 42k to 742k MoM.
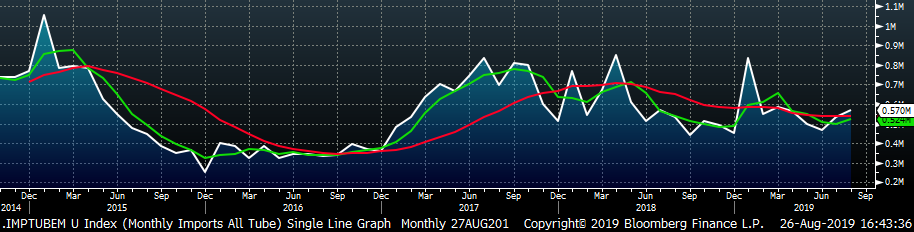
Tube imports license data is forecasting a MoM increase of 33k to 570k tons in August.
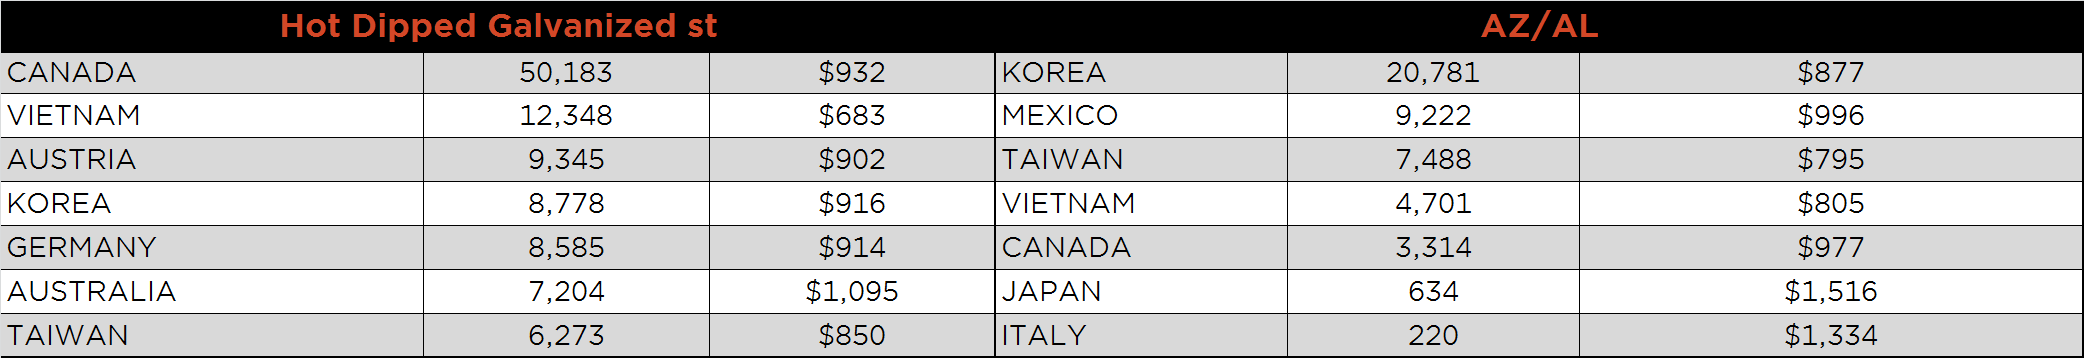
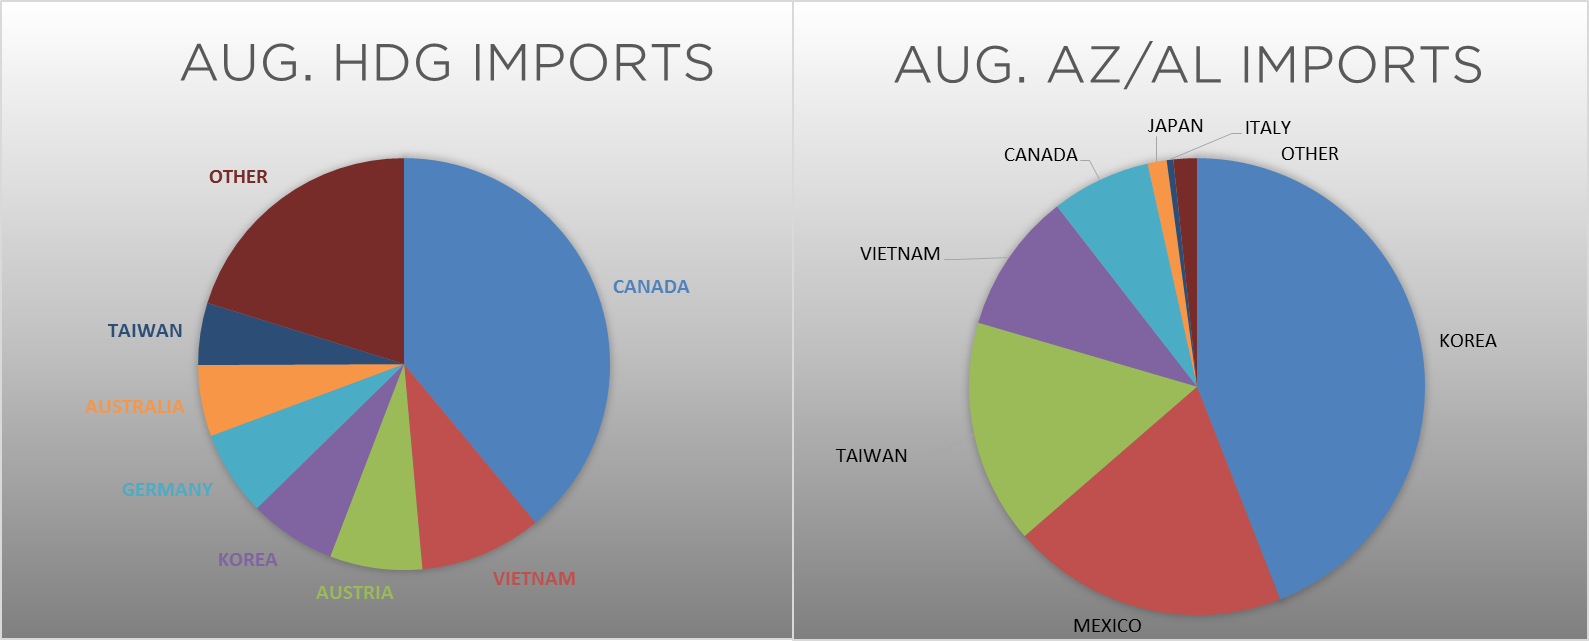
AZ/AL import licenses are forecast to increase 12k in August to 73k.
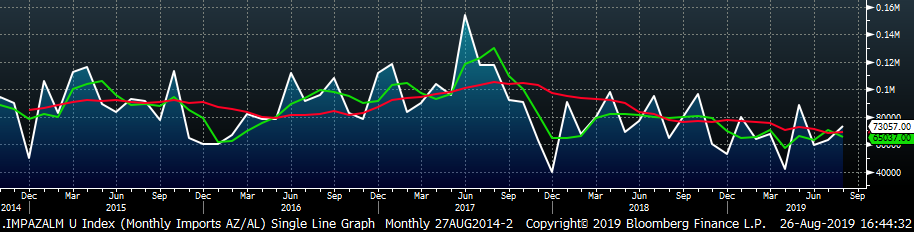
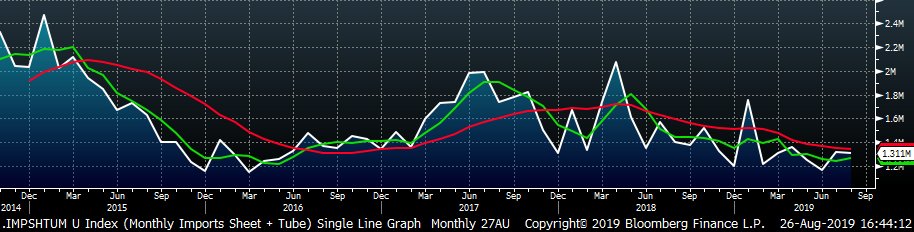
Below is August import license data through August 20, 2019.
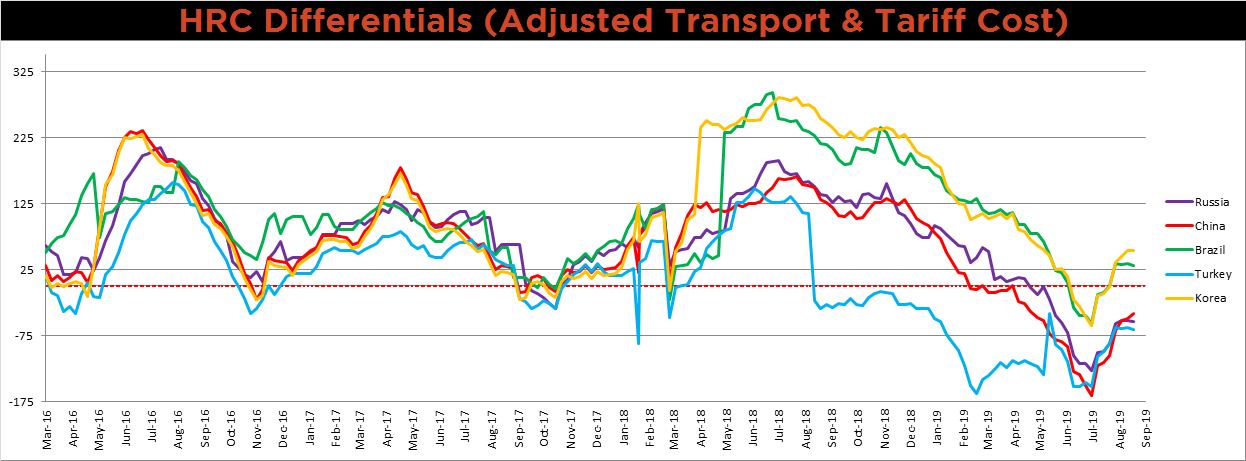
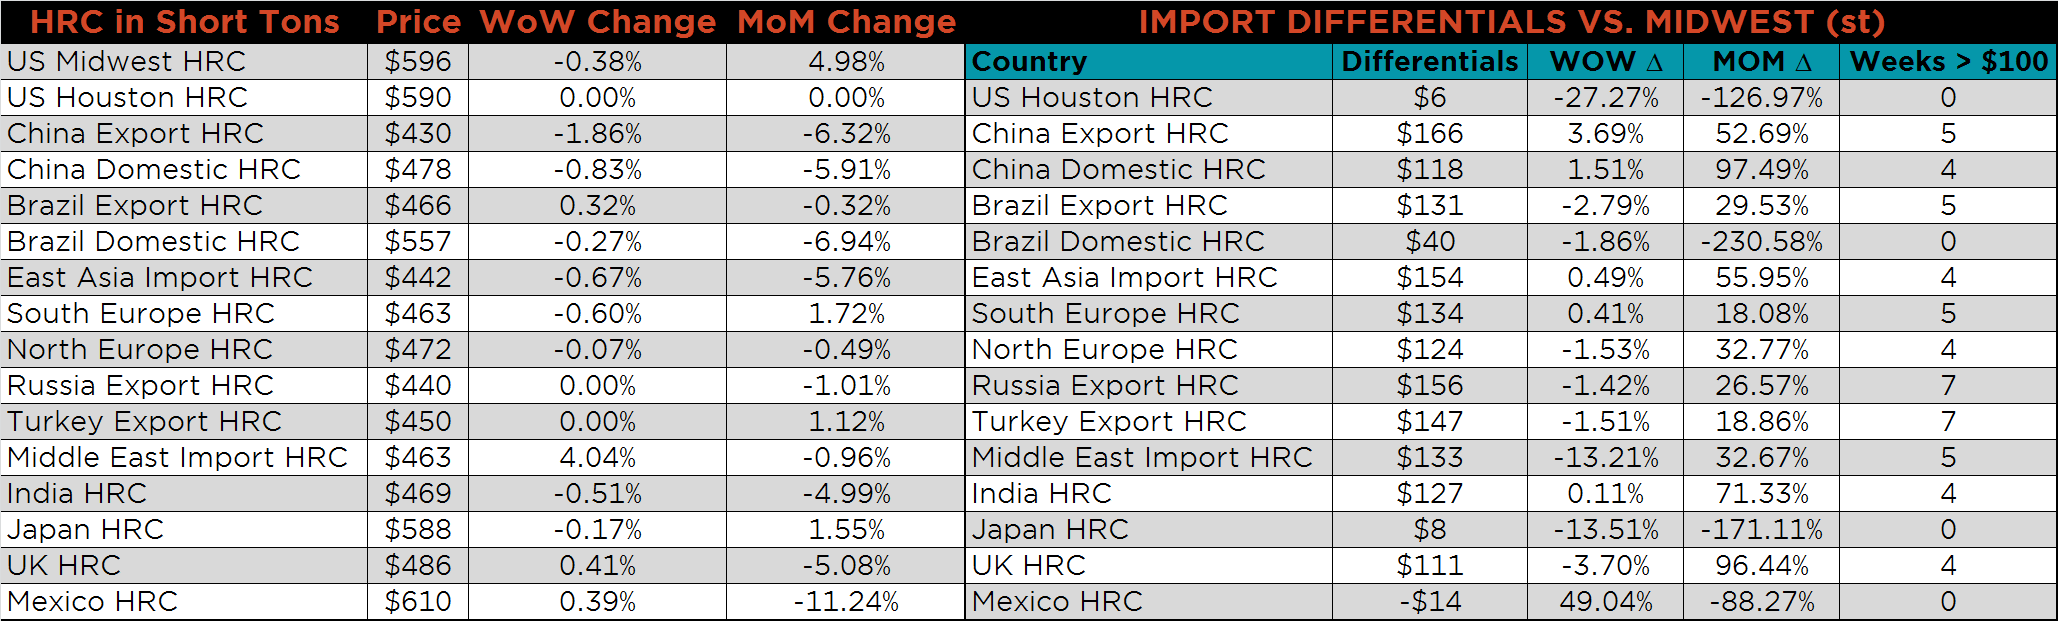
Below is the Midwest HRC price vs. each listed country’s export price using pricing from SBB Platts. We have adjusted each export price to include any tariff or transportation cost to get a comparable delivered price. Differentials have been relatively stable since the end of July as global demand has cooled off.
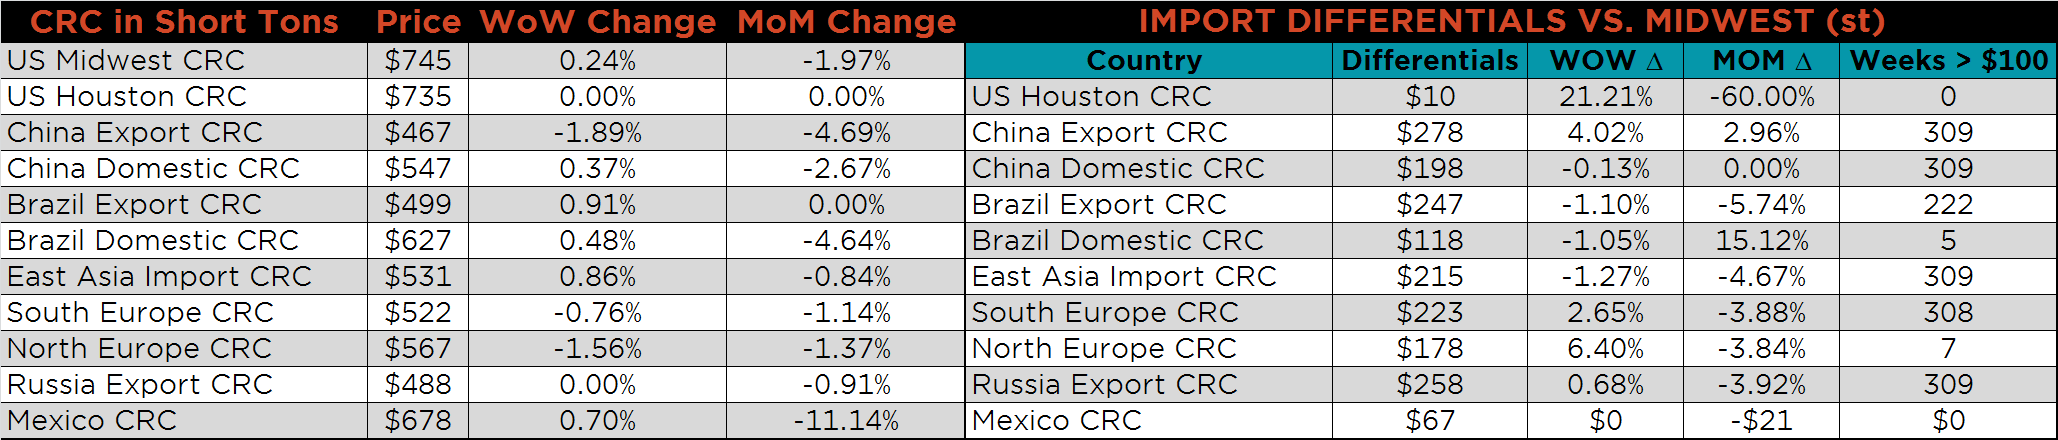
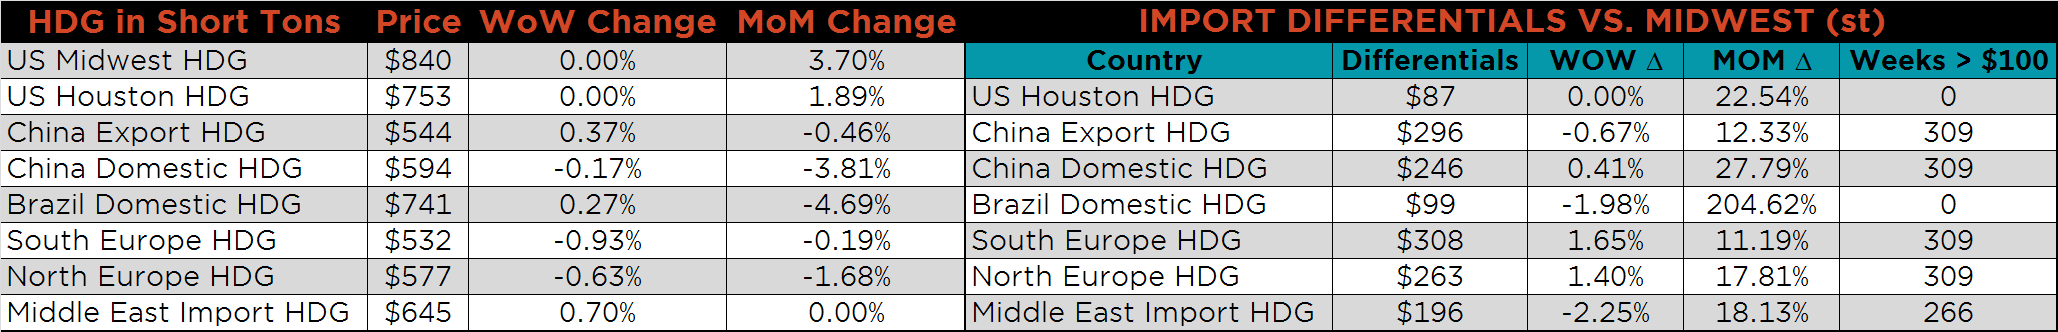
SBB Platt’s HRC, CRC and HDG pricing is below. Midwest prices were flat on the week, while the Chinese CRC and HRC export prices were each down 1.9%.
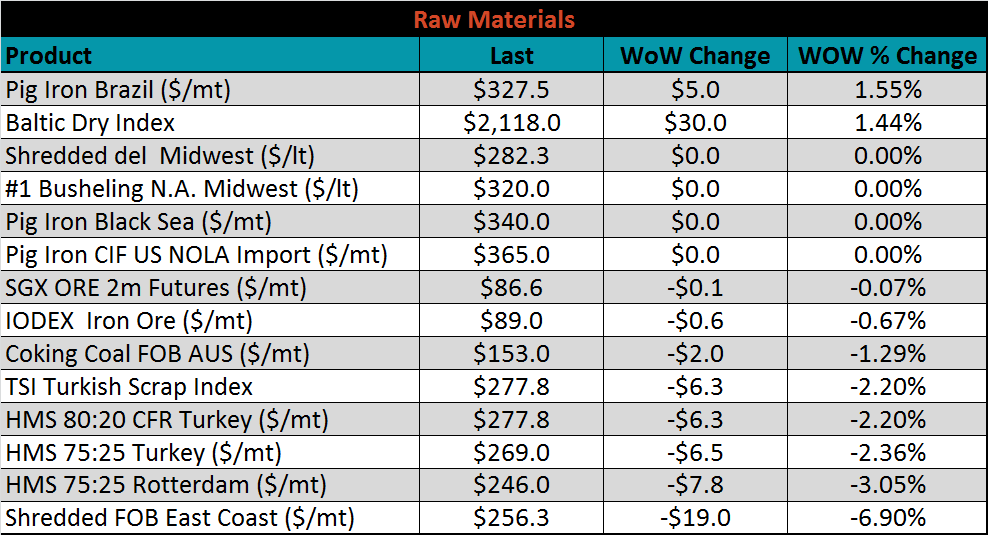
Raw material prices were mixed. FOB East Coast shredded was down 6.9%, while Brazilian pig iron was up 1.6%.
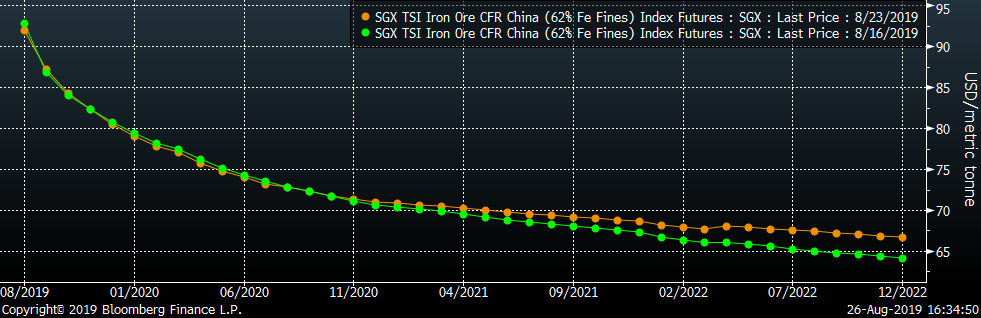
Below is the iron ore future curve with Friday’s settlments in orange, and the prior week’s settlements in green. The front of the curve saw very little change, while the later months sold off.
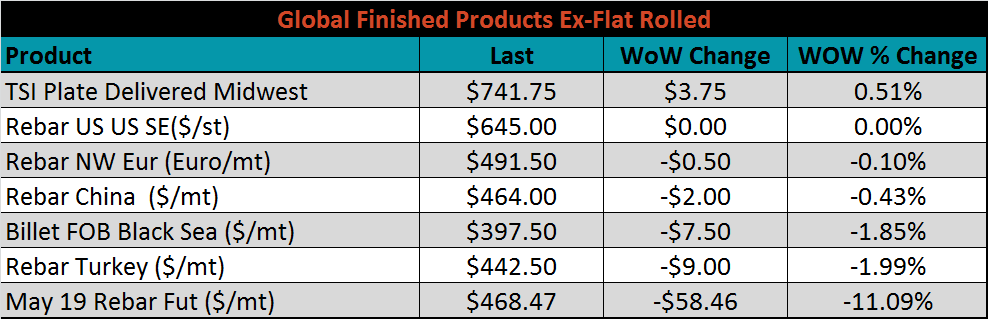
The ex-flat rolled prices are listed below.

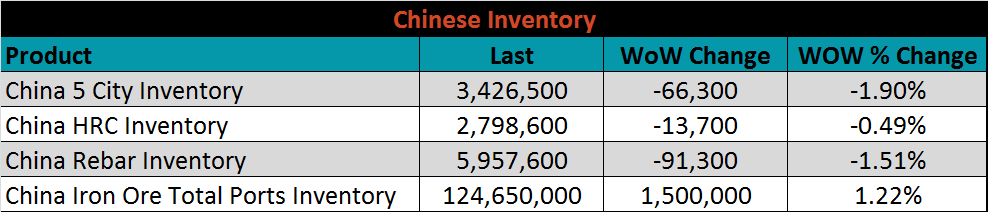
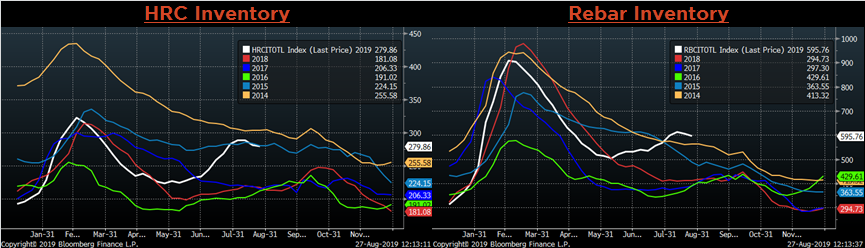
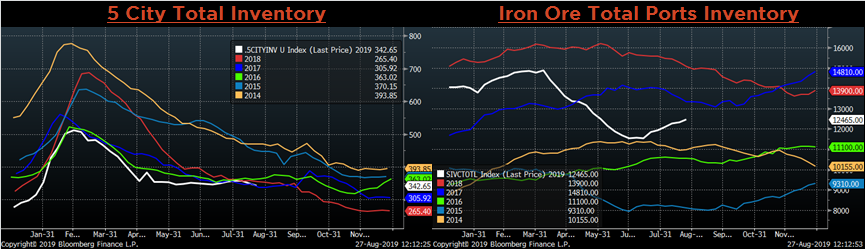
Below are inventory levels for Chinese finished steel products and iron ore. HRC, Rebar and 5-City inventory levels were lower again, while Iron Ore port inventory continues to increase. This could be a sign that production cuts anticipated in Q4 have begun early due to weak global demand.
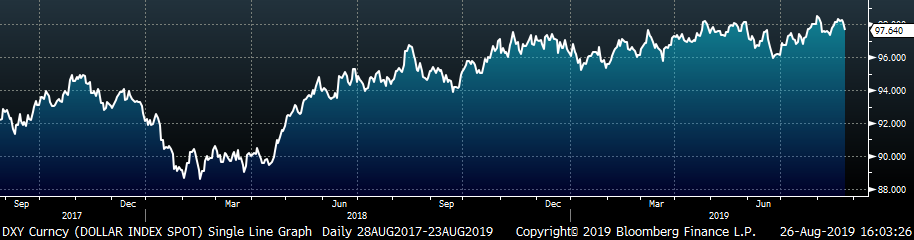
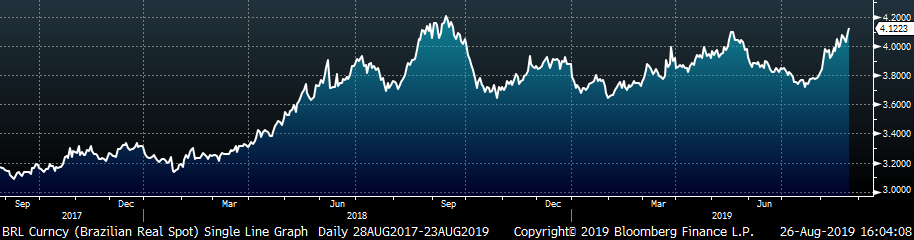
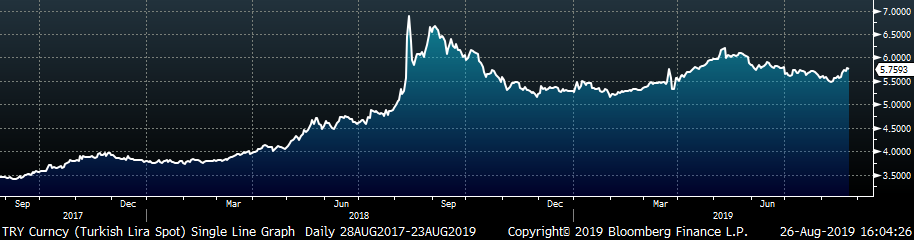
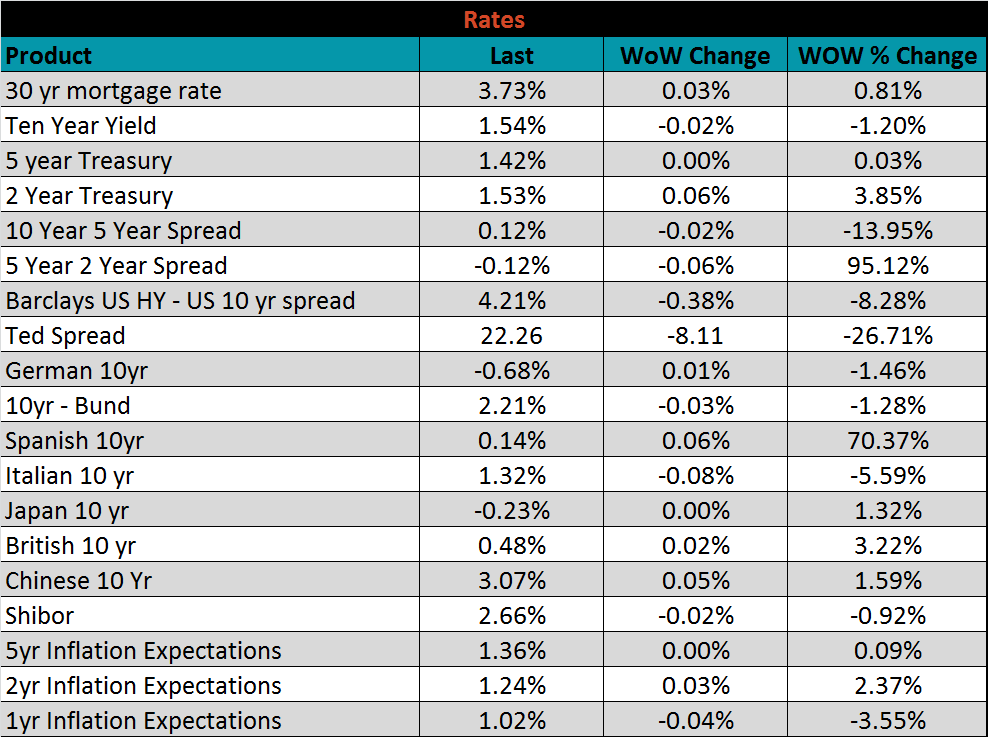
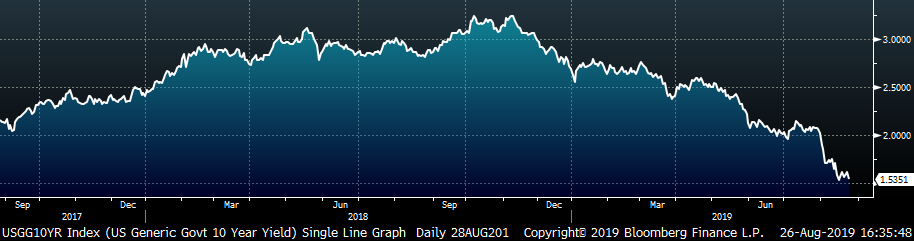
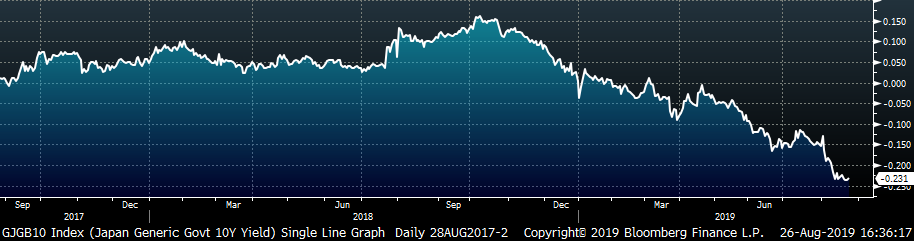
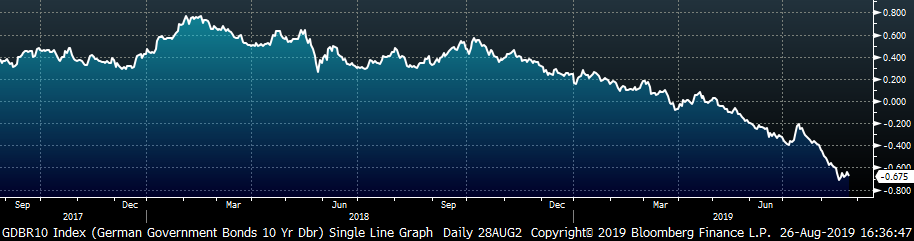
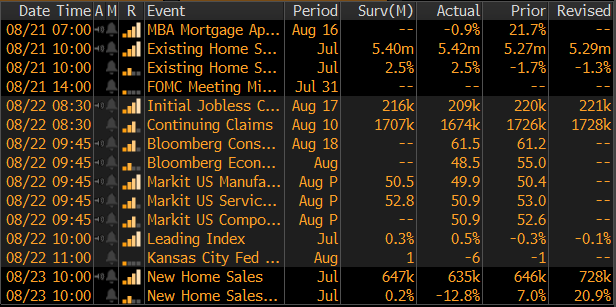
The remainder of the pertinent economic data is below. FED Chair Jay Powell hinted that the FOMC would remain accommodative (i.e. additional cuts to the FED Funds Rate) in his prepared remarks on Friday in Jackson Hole. However, it is not clear what will happen during the September meeting, as there are at least two voting members (Eric Rosengren and Esther George) with dissenting opinions.
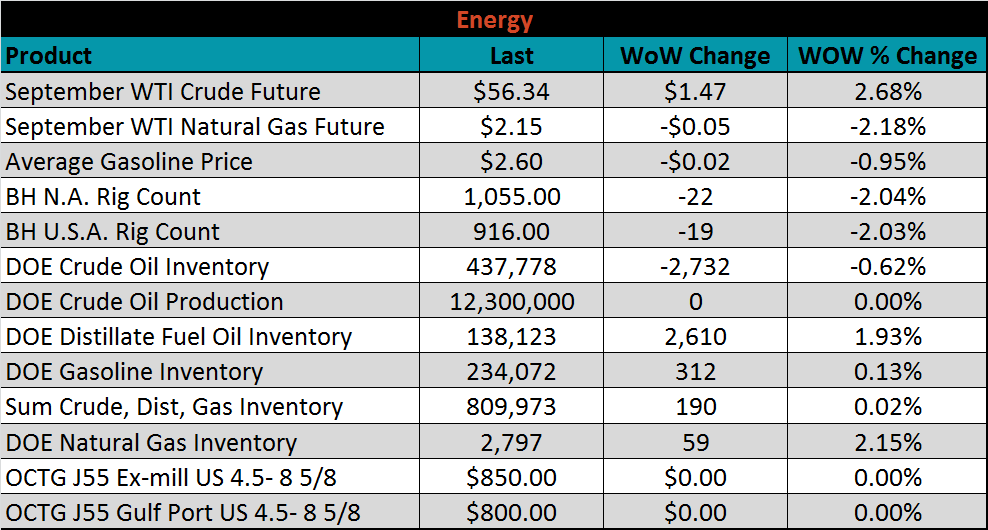
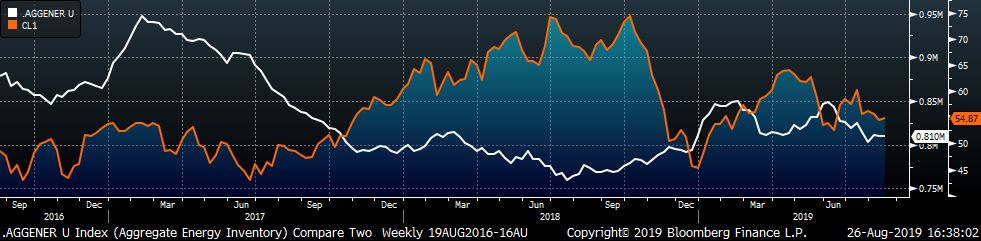
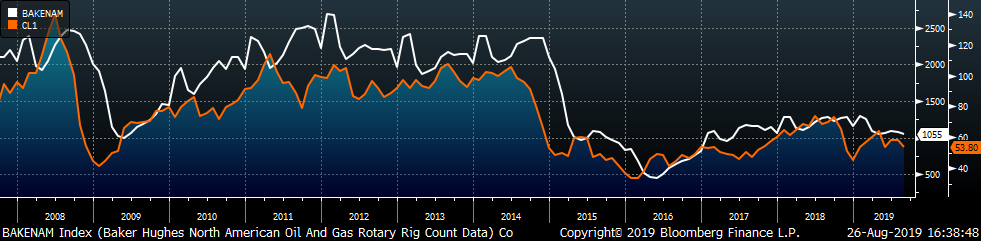
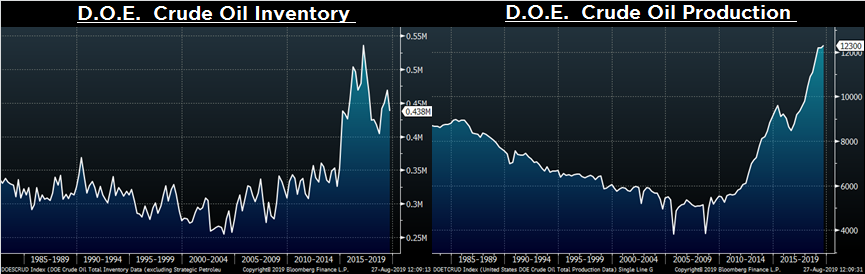
Last week, the September WTI crude oil future gained $1.47 or 2.7% to $56.34/bbl. The aggregate inventory level was essentially flat, and crude oil production was unchanged at 12.3m bbl/day. The Baker Hughes North American rig count lost twenty-two rigs and the U.S. count lost nineteen.
The list below details some upside and downside risks relevant to the steel industry. The orange ones are occurring or look to be highly likely. The upside risks look to be in control.
Upside Risks:
Downside Risks: