Content
-
Weekly Highlights
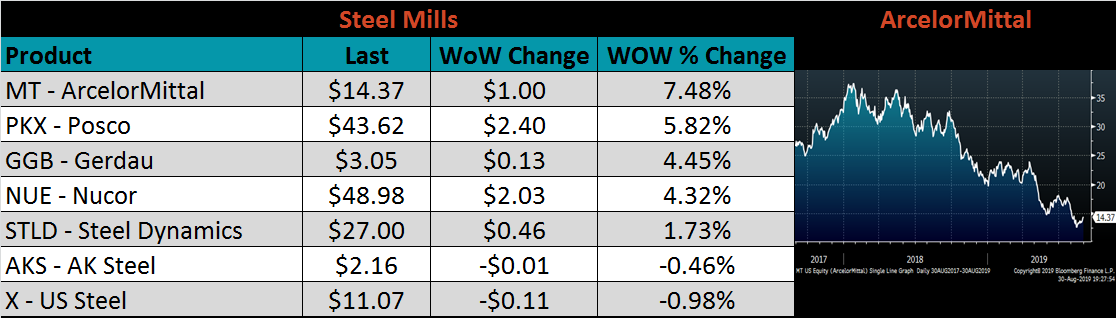
- Market Commentary
- Risks


When economists analyze economic data, they categorize incoming data into two buckets based on what economic aspect the data is portraying – “hard” and “soft” data. “Hard” data is released by governmental and statistical agencies describing concreate economic activity, while “soft” data is a gauge of confidence and sentiment in the economy. To understand a full picture of an economy, both types of data must be considered. We can use the same structure to understand the dynamics of the domestic steel market.
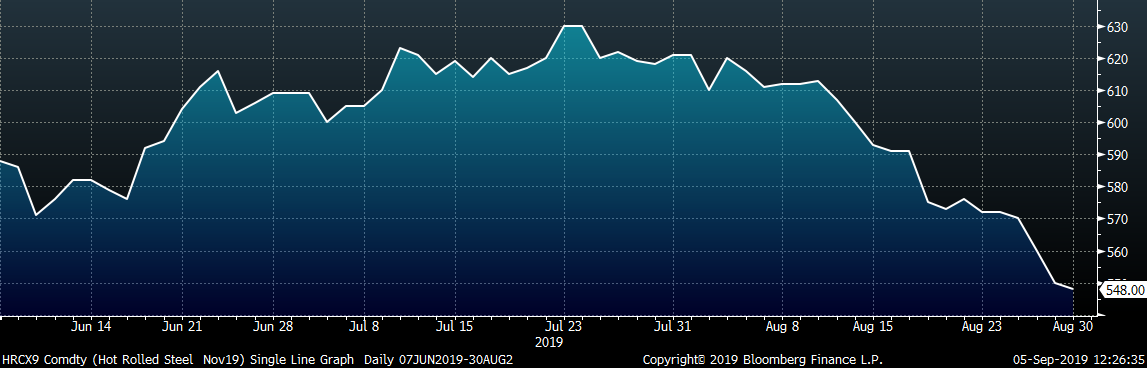
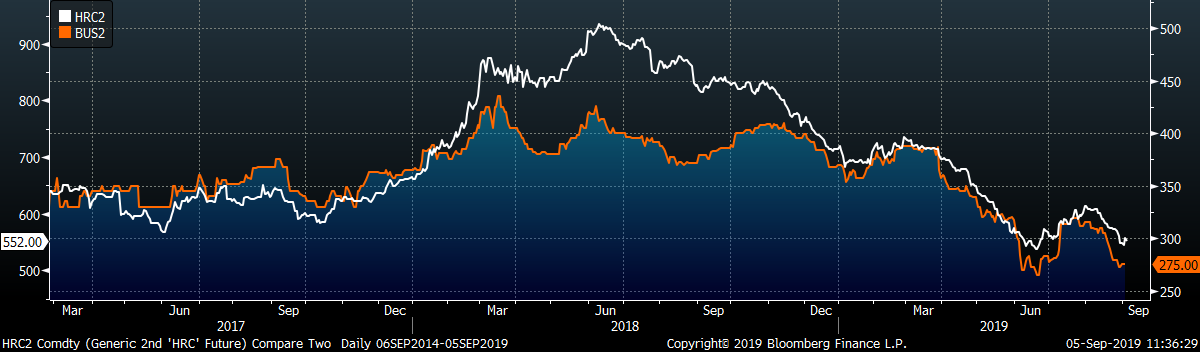
Overall steel market sentiment has been weak over the last month. Pricing outlook, expressed by many steel buyers, indicates expectations of lower spot prices over the next few months. This is driven by their reluctance to purchase material until it is absolutely needed. Inventory levels of end users continue to decline, and uncertainty surrounding the US/China trade war is delaying large capital spending plans. This has been the prevailing buyer sentiment over the last year. It is also apparent in the futures market, which gauges expectations of future spot pricing. The November HRC future has declined over $70/st since the end of July.
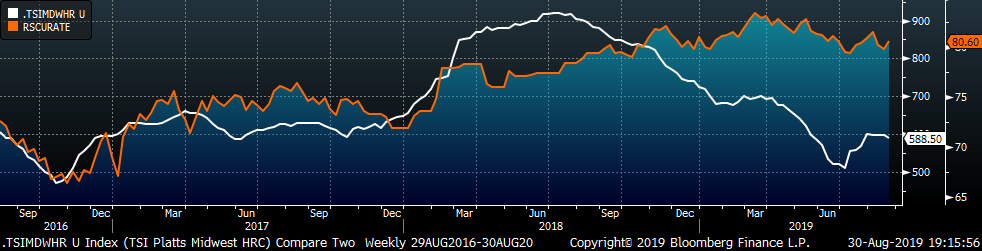
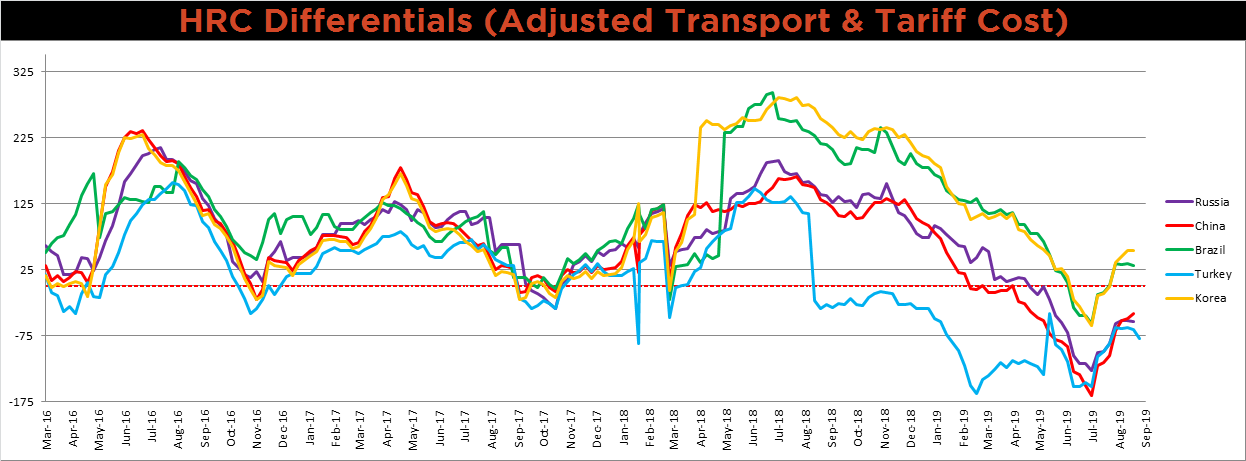
However, the hard data, i.e. data pertaining to supply and demand, paints a much different picture. Imports remain at low levels and current price differentials will discourage further imports this year. While future prices have declined recently, lead times remain strong, indicating mills have filled their order books. BOF and EAF profitability has remained steady over the last few weeks as raw material prices have declined simultaneously. The below chart shows HRC prices relative to scrap pricing, which explains why mills were able to negotiate lower prices while maintaining profitable sales.
Considering both these “hard” and “soft” dynamics in the steel market, the upside and downside risks appear balanced, which is consistent with the current, flat futures curve. However, the flat curve is an appealing opportunity to lock in prices out into 2020 at levels well below the historical average HRC price of $625.
Below are the most pertinent upside and downside price risks:
Upside Risks:
Downside Risks:
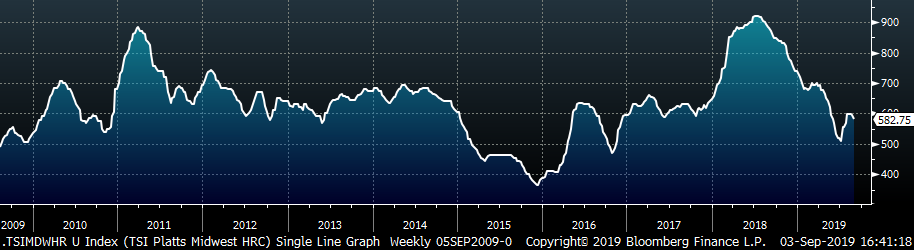
The Platts TSI Daily Midwest HRC Index was down $15.50 to $582.75.
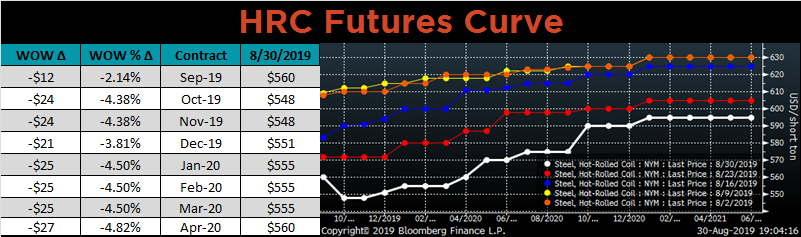
The CME Midwest HRC futures curve is below with last Friday’s settlements in white. The curve shifted lower across all expirations again last week.
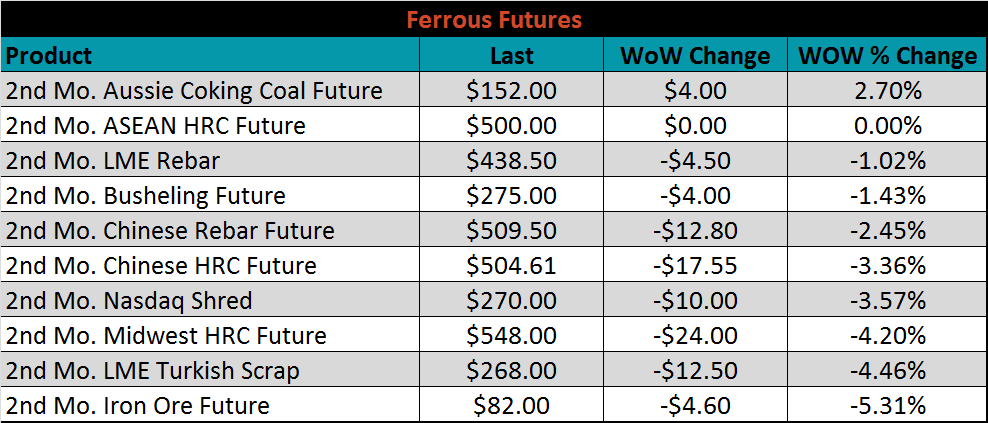
October ferrous futures were mixed. Iron ore futures lost 5.3%, while coking coal gained 2.7%.
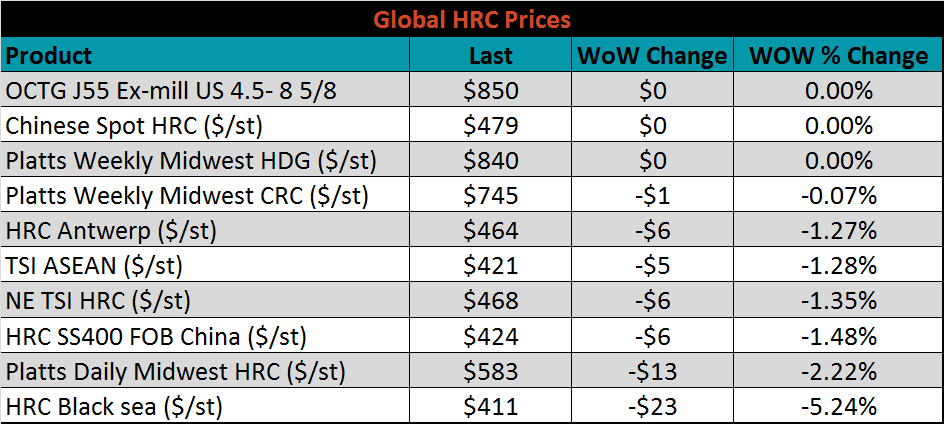
The global flat rolled indexes were all lower. Black Sea and TSI Midwest HRC were down the most, 5.2% and 2.2%, respectively.
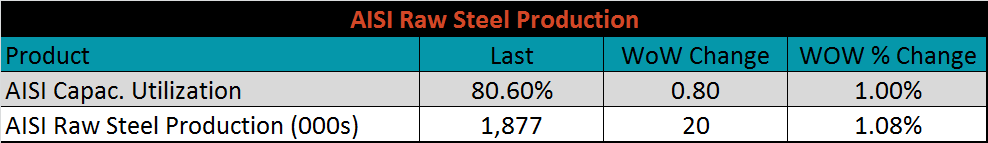
The AISI Capacity Utilization Rate was up 0.8% to 80.6%, back above the 80% goal set by the Trump administration since October.
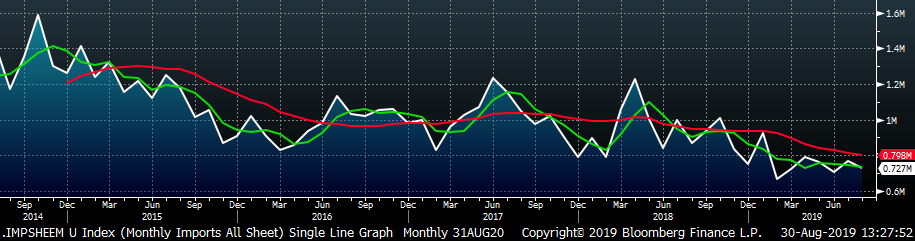
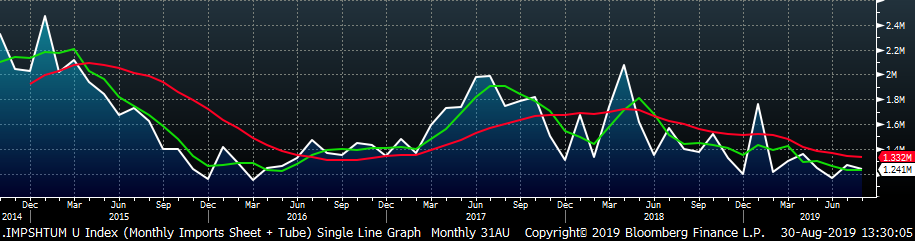
August flat rolled import license data is forecasting a decrease of 37k to 727k MoM.
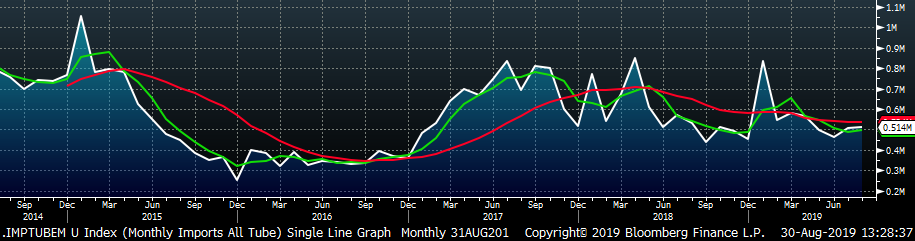
Tube imports license data is forecasting a MoM increase of 5k to 514k tons in August.
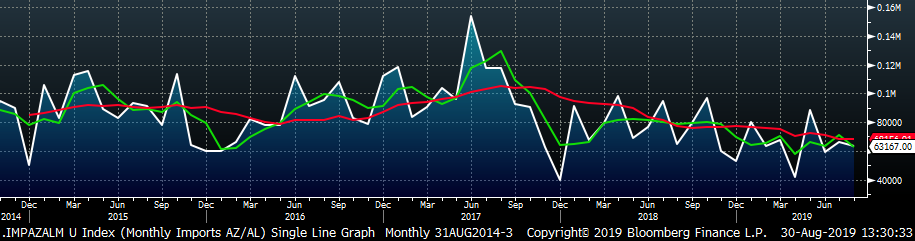
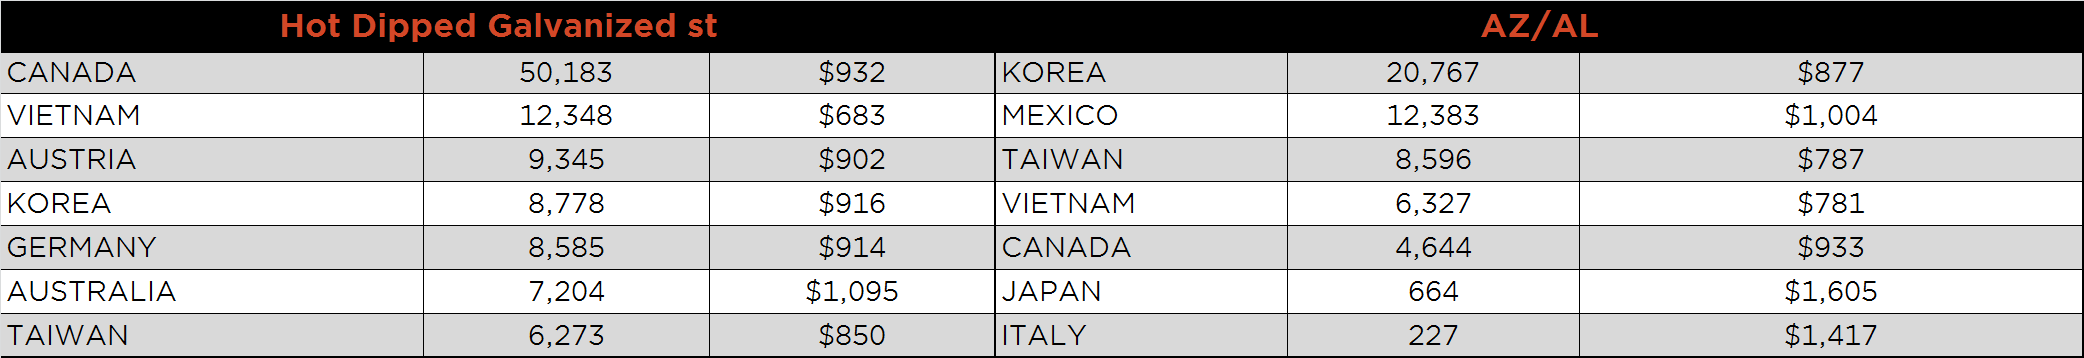
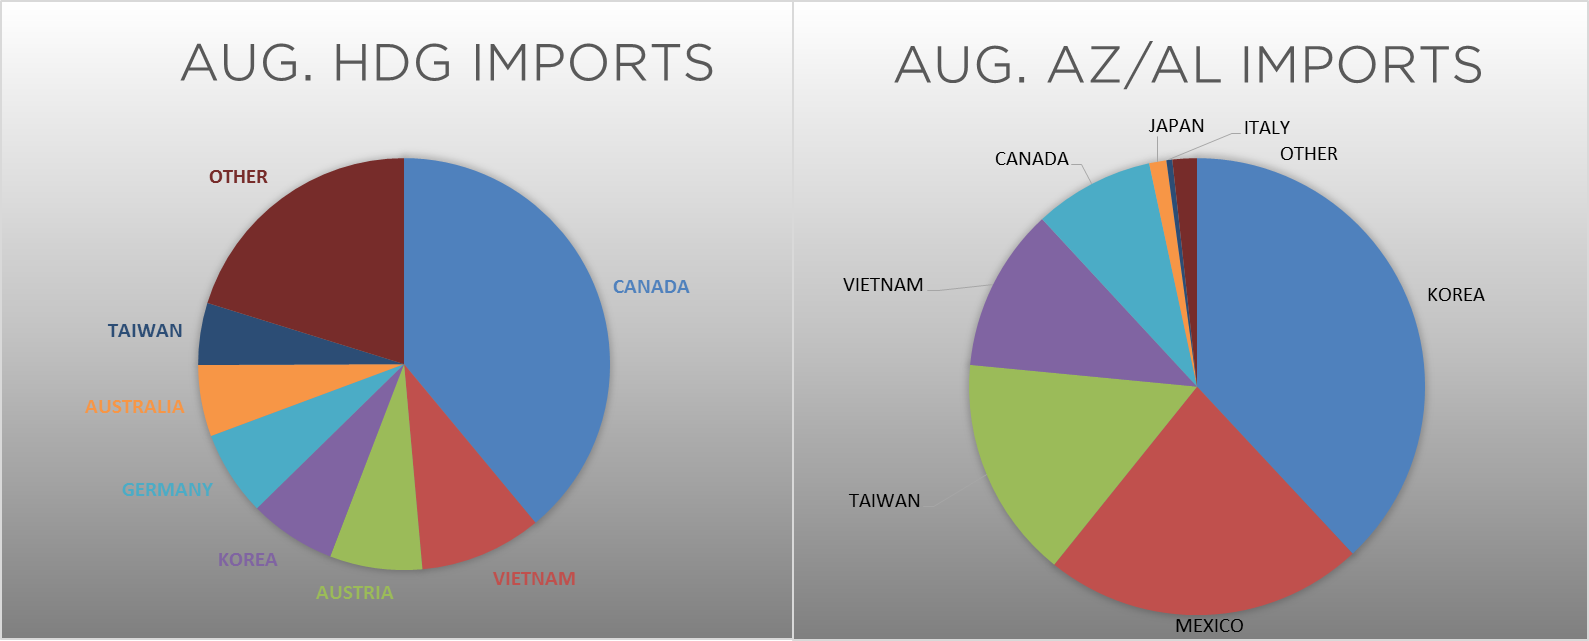
AZ/AL import licenses are forecast to decrease 3k in August to 63k.
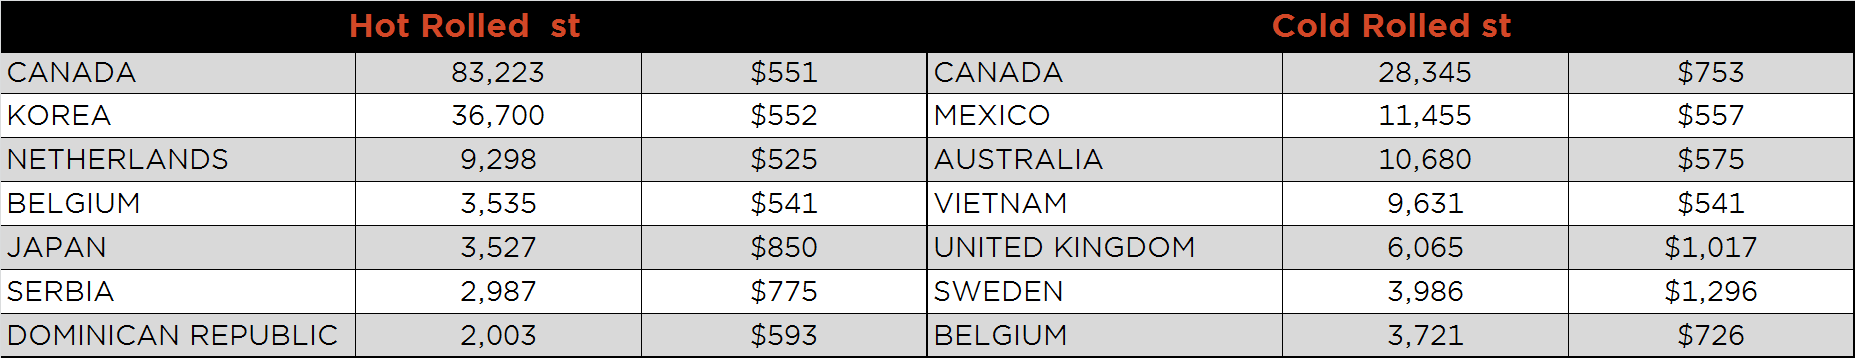
Below is August import license data through August 27, 2019.
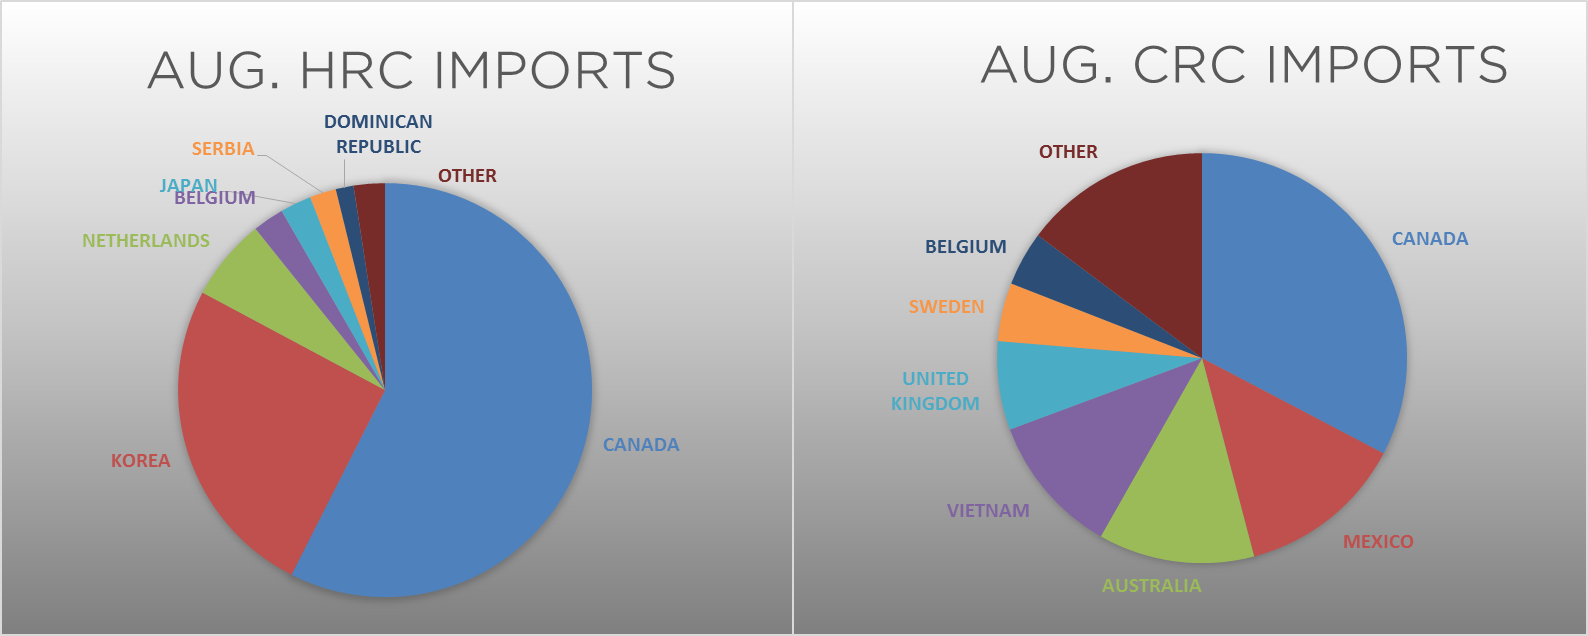
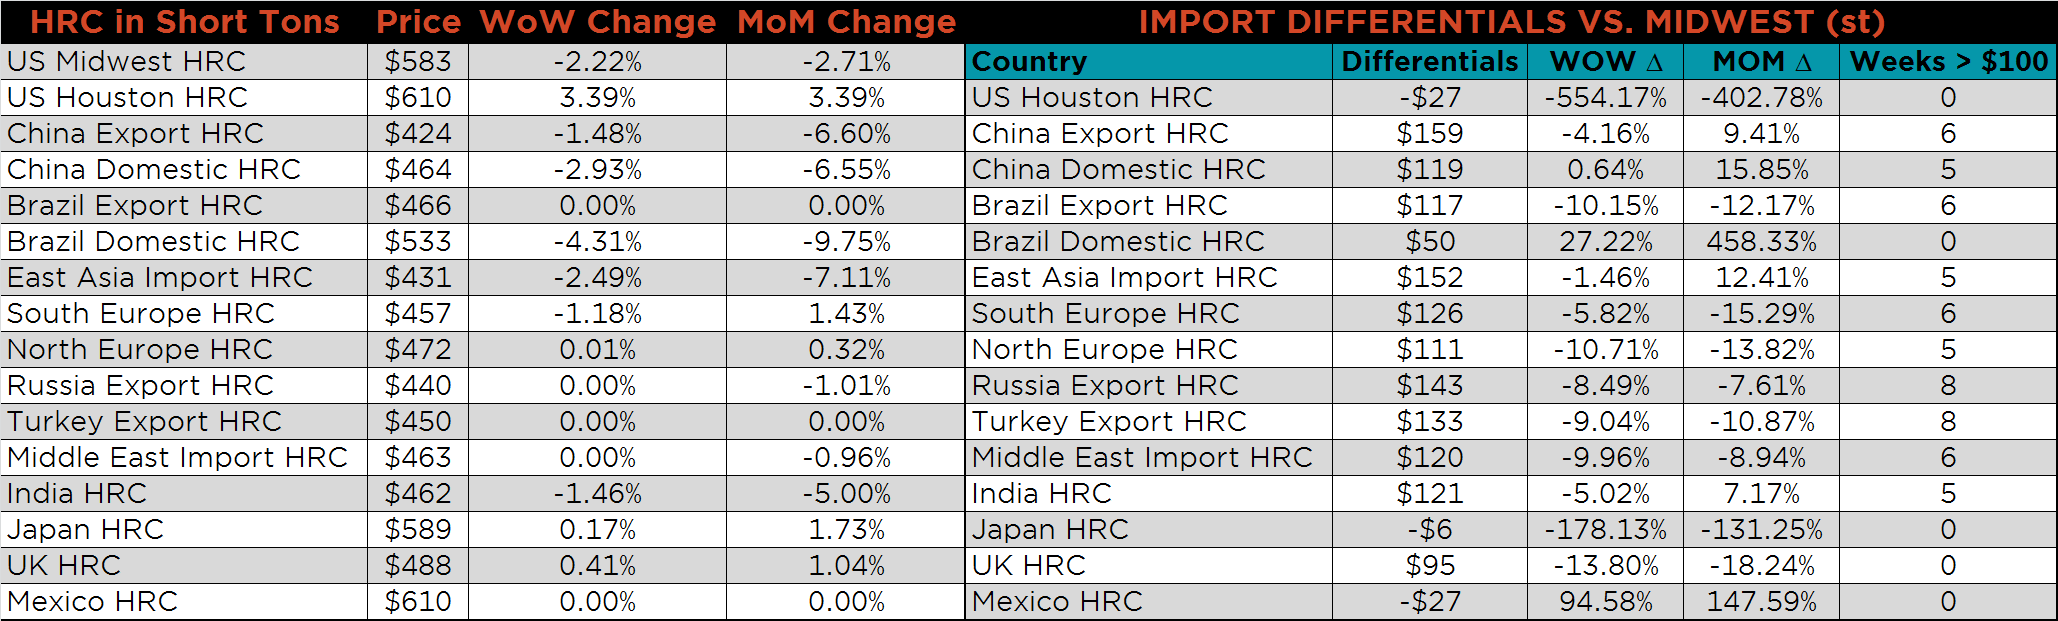
Below is the Midwest HRC price vs. each listed country’s export price using pricing from SBB Platts. We have adjusted each export price to include any tariff or transportation cost to get a comparable delivered price. The Midwest HRC price has steadily declined over the previous three weeks, while global prices have remained stable, causing differentials to plateau and decline.
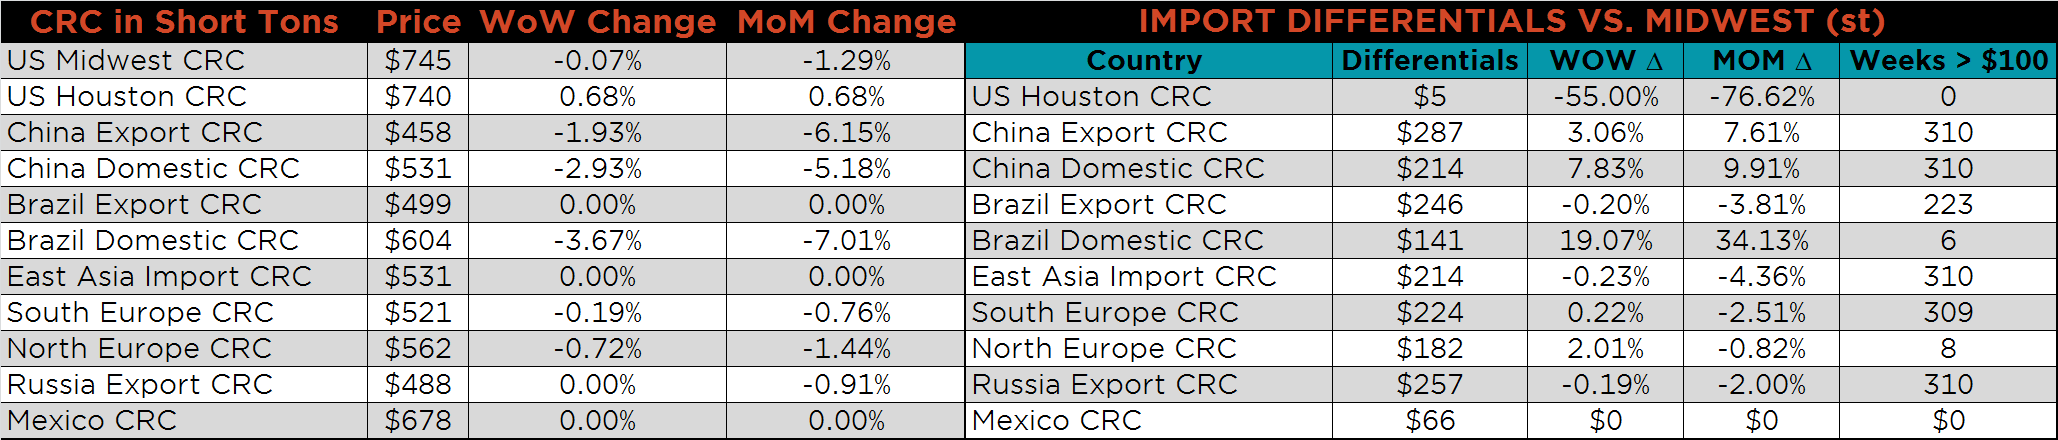
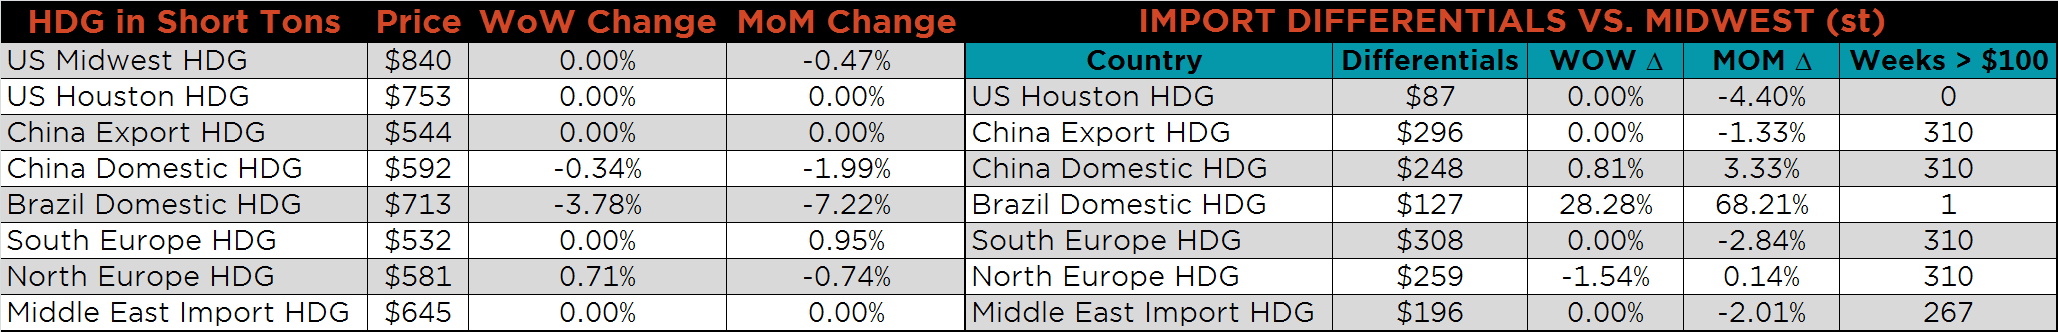
SBB Platt’s HRC, CRC and HDG pricing is below. The Midwest HRC price was down 2.2%, while the CRC and HDG prices were flat on the week. Global export prices showed little change on the week.
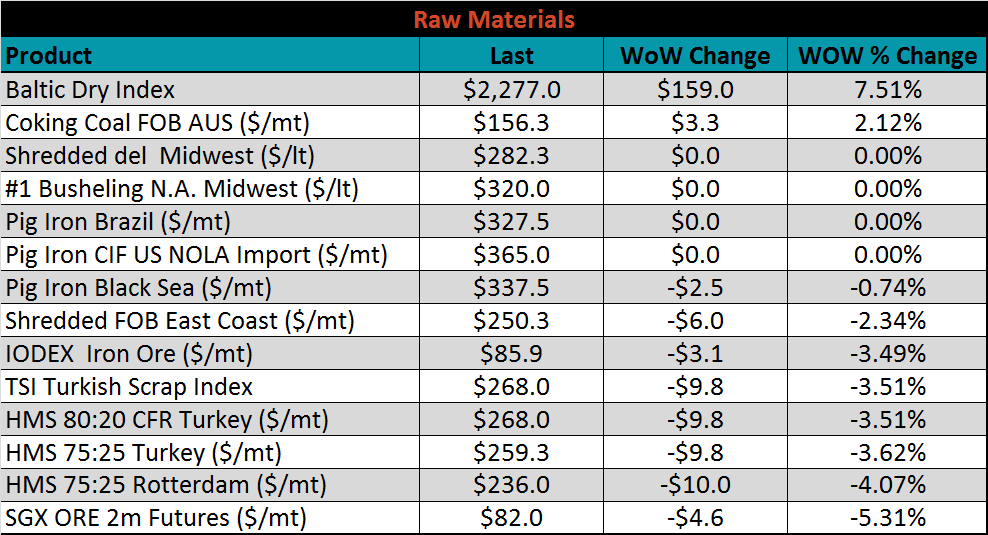
Raw material prices were mostly lower. Coking coal was up 2.1%, while SGX iron ore futures were down 5.3%.
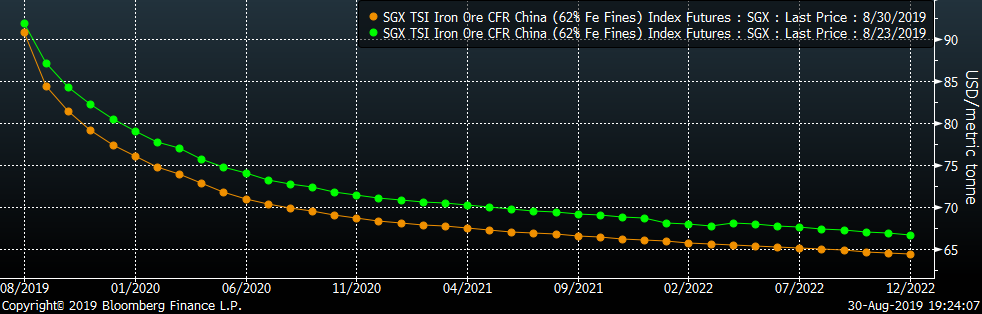
Below is the iron ore future curve with Friday’s settlments in orange, and the prior week’s settlements in green; the entire curve continued to sell off.
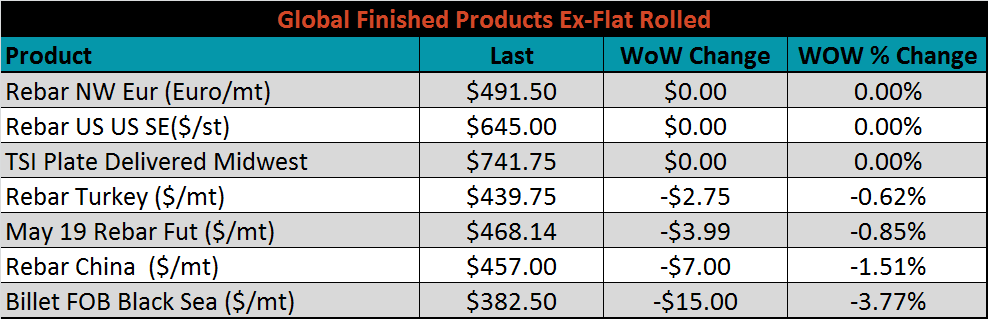
The ex-flat rolled prices are listed below.

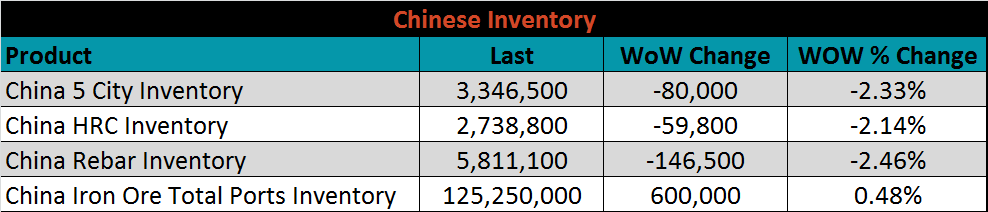
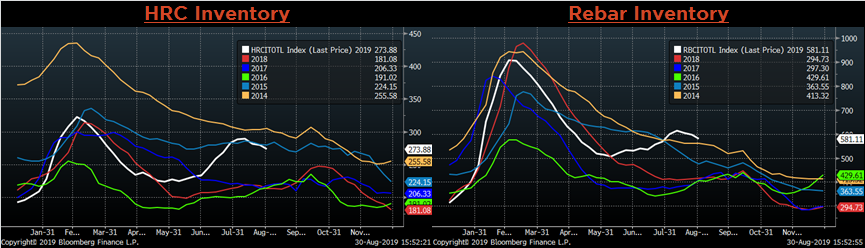
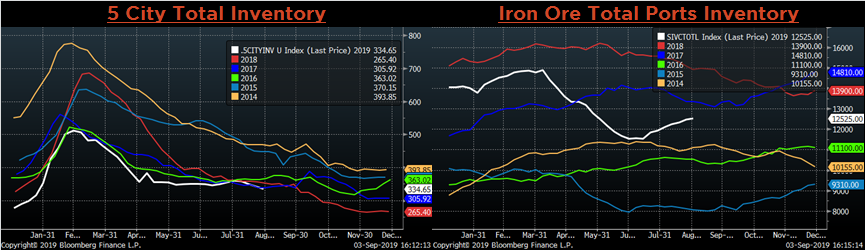
Below are inventory levels for Chinese finished steel products and iron ore. Overall trends have continued, HRC, Rebar and 5-City inventory levels were lower, while Iron Ore port inventory continues to increase. Destocking in finished goods is likely due to diminished domestic and global demand.
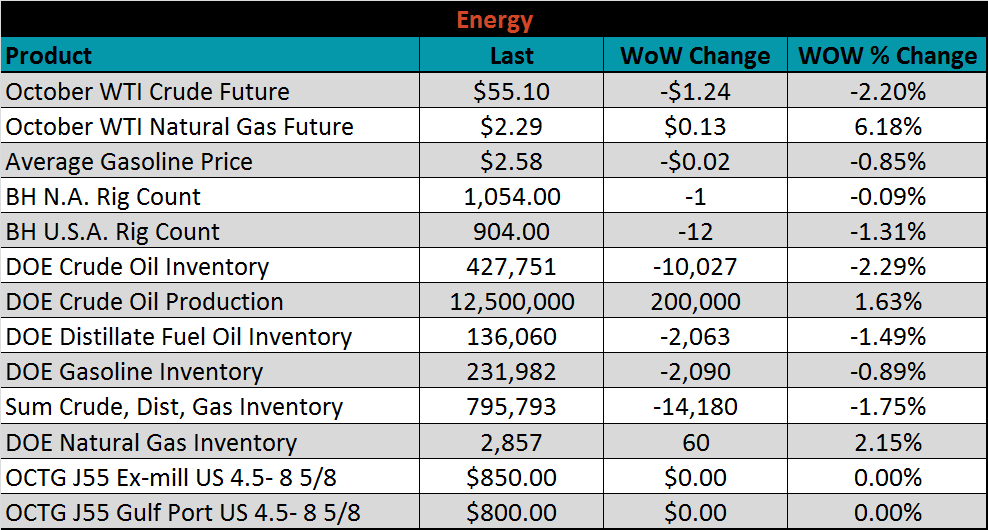
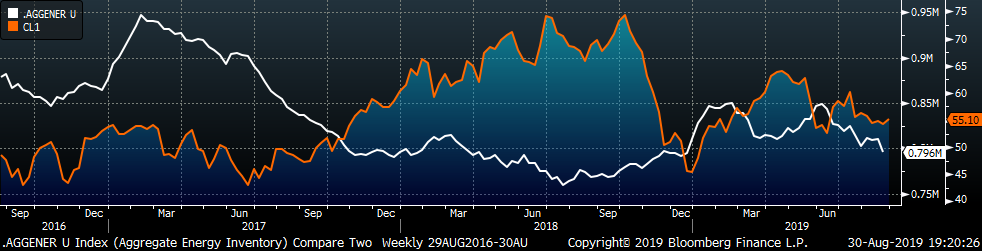
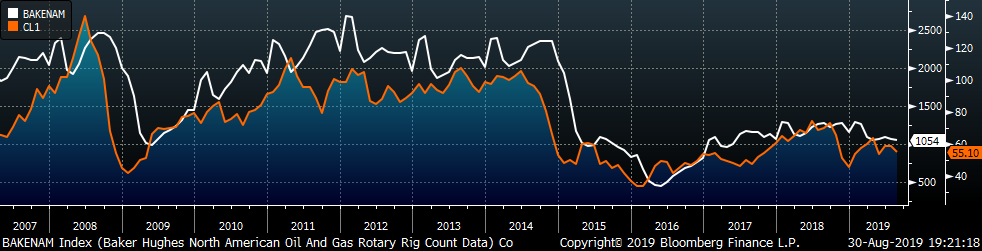
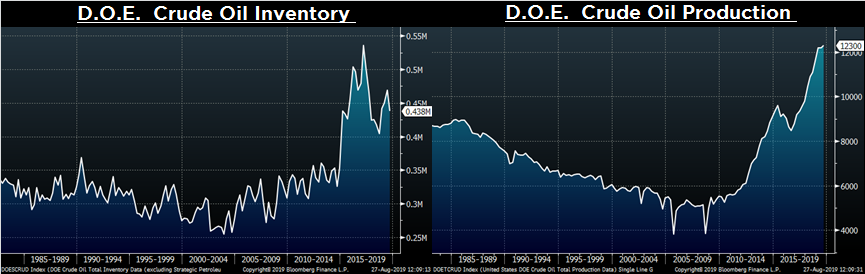
Last week, the October WTI crude oil future lost $1.24 or 2.2% to $55.10/bbl. The aggregate inventory level was 1.8% lower, and crude oil production rose to 12.5m bbl/day. The Baker Hughes North American rig count lost one rig and the U.S. count lost twelve.
The list below details some upside and downside risks relevant to the steel industry. The orange ones are occurring or look to be highly likely. The upside risks look to be in control.
Upside Risks:
Downside Risks: