

August 5, 2022

Market Commentary
For the steel industry, there are two valuable components of the jobs report and unemployment figures. First, the historical relationship between auto sales and unemployment, which we publish every month (below). Another valuable component of the report comes from digging into specific industries related to steel demand. The chart below shows the breakdown of the unemployment rate for manufacturing (white) and construction (orange).
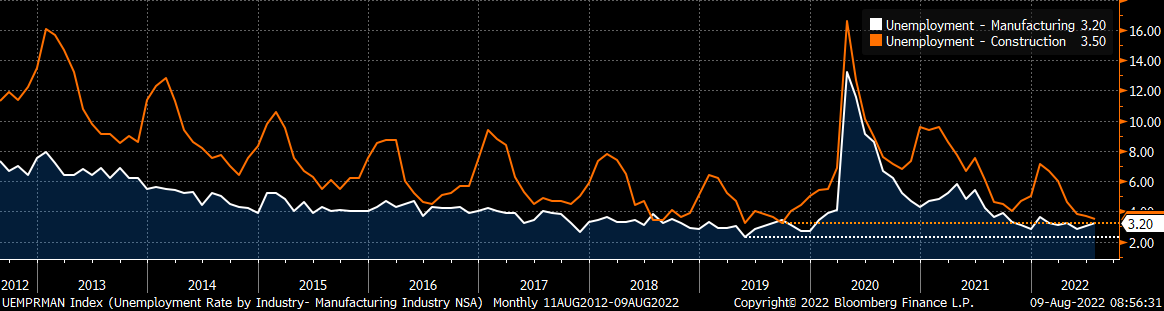
When the data was released on Friday morning, the headline was better-than-expected. The July unemployment rate in the U.S. matched its pre-pandemic levels with the lowest rate (3.5%) in the last 50 years. While manufacturing and construction tell a similar story to the topline figures, the nuance provides insight in where the steel industry may be headed in the coming months.
- In construction, a highly seasonal industry, the unemployment rate currently sits at 3.5%, just above its record low from September 2019 (3.2%). With a few months remaining in construction season, it is possible that we could see this rate continuing its trend lower.
- For manufacturing, on the other hand, the record low rate of 2.3% came in May 2019. Since December, this industry rate has gone as low as 2.8% twice but is now trending higher. The idea that manufacturing job growth already reached its peak in the sector is further supported by the employment subindex in the ISM Manufacturing PMI, which has been in contraction for the last 3 months.
ISM PMI
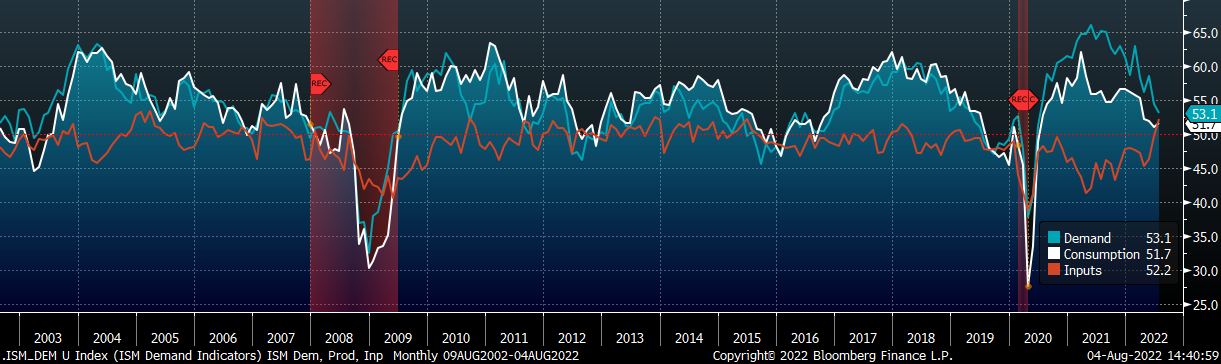
The key takeaway from the ISM Manufacturing PMI is that demand subindexes remain under pressure, while the manufacturing sector is continuing to grow.
- The new orders subindex moved further into contraction territory.
- Easing supply-chain issues and a significant reduction in prices helped the Input subindex move into expansion territory for the first time since early 2019
ISM Manufacturing PMI: Demand (blue), Consumption (white), & Inputs (orange)
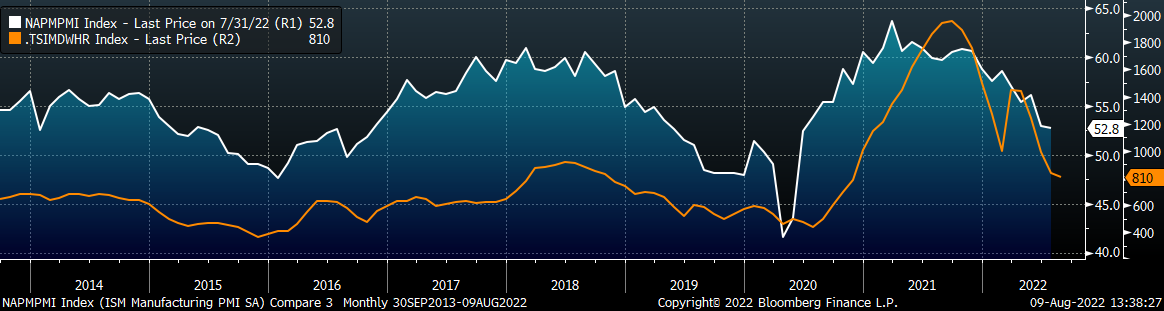
The chart below is the Platts Midwest HRC index (orange) and the ISM Manufacturing PMI (white). The topline ISM Manufacturing PMI index printed below expectations, but remains in expansion territory, while the Midwest HRC price fell further in July.
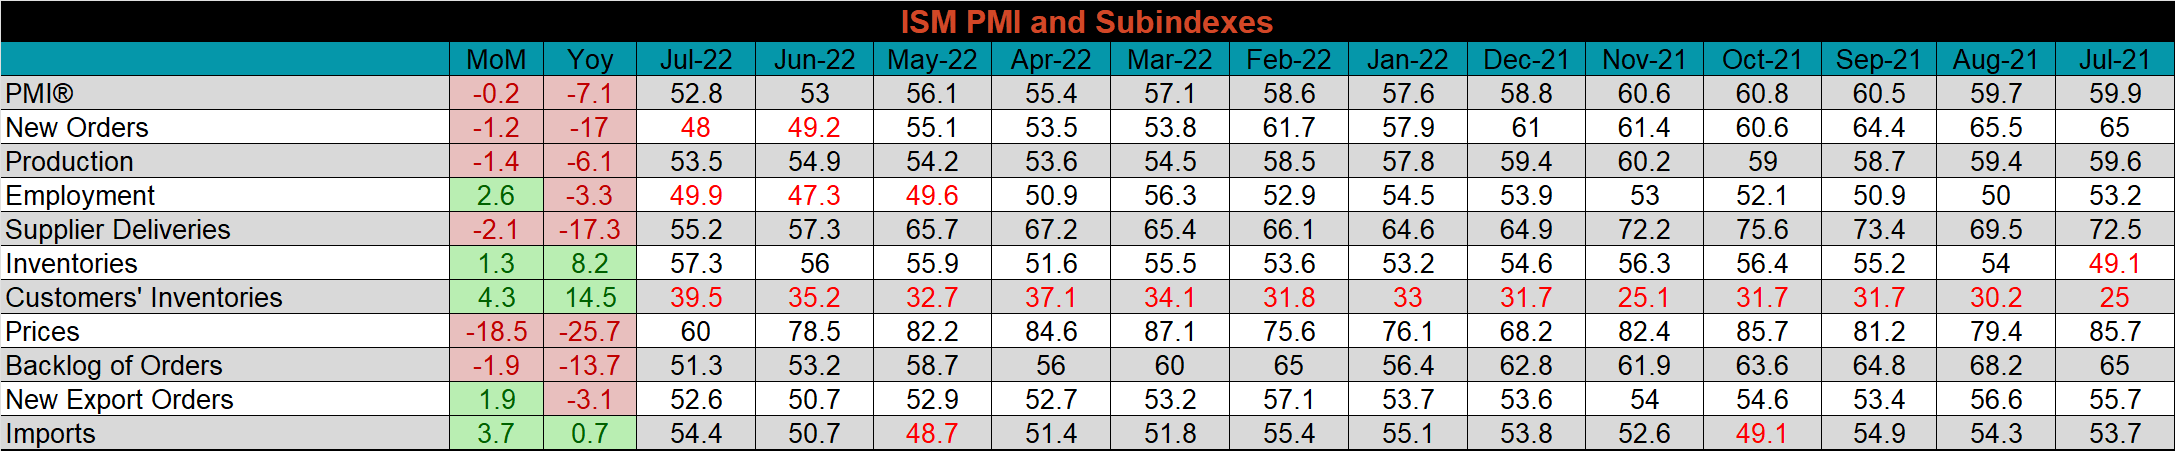
The July ISM Manufacturing PMI and subindexes are below.
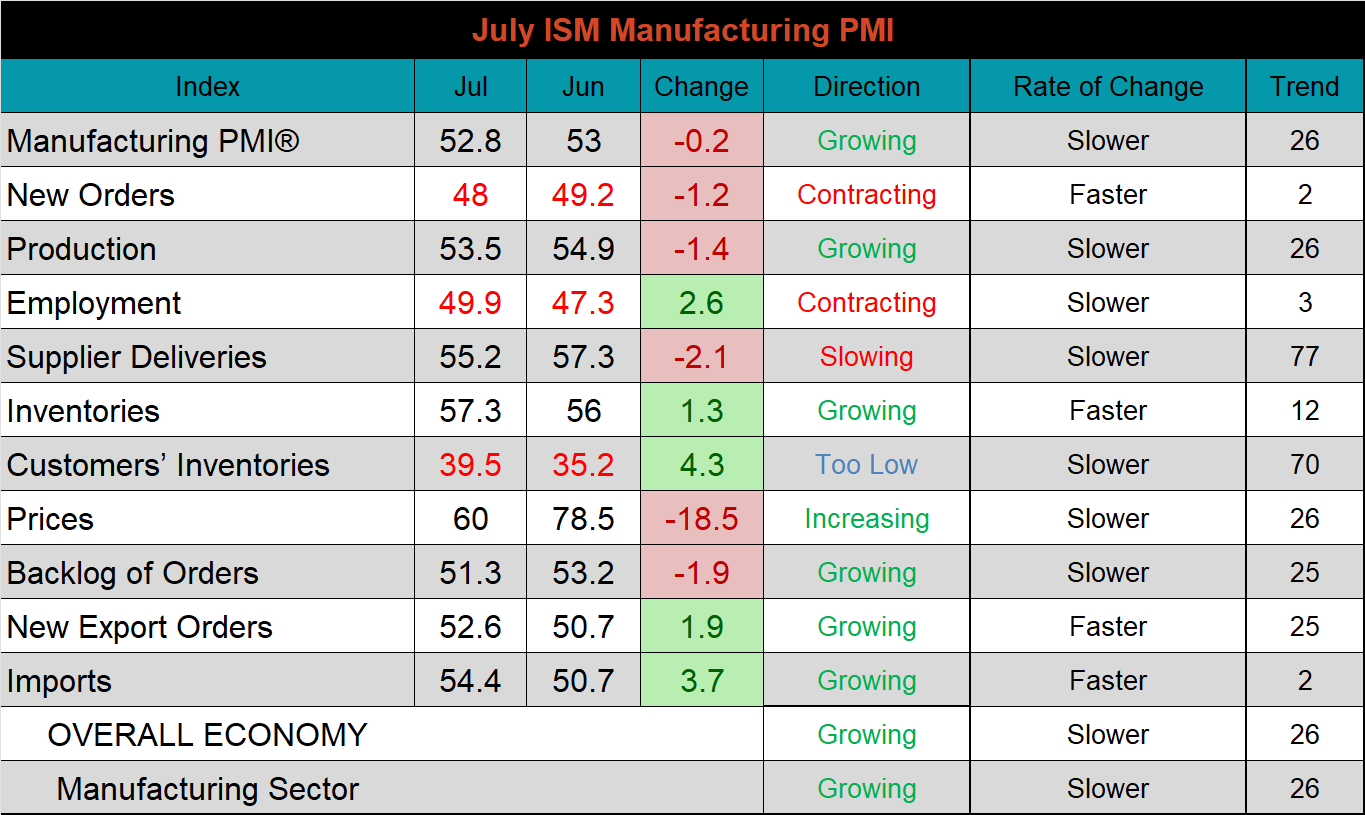
The table below shows the historical values of each subindex over the last twelve months. Inventories, customer inventories, and imports are the only subindexes that are higher, YoY. On the other hand, supplier deliveries and prices were down most significantly and both at their lowest levels since the beginning of the post-COVID economic reopening. The two subindexes easing are a welcome sign that the two most significant impediments are being reduced.
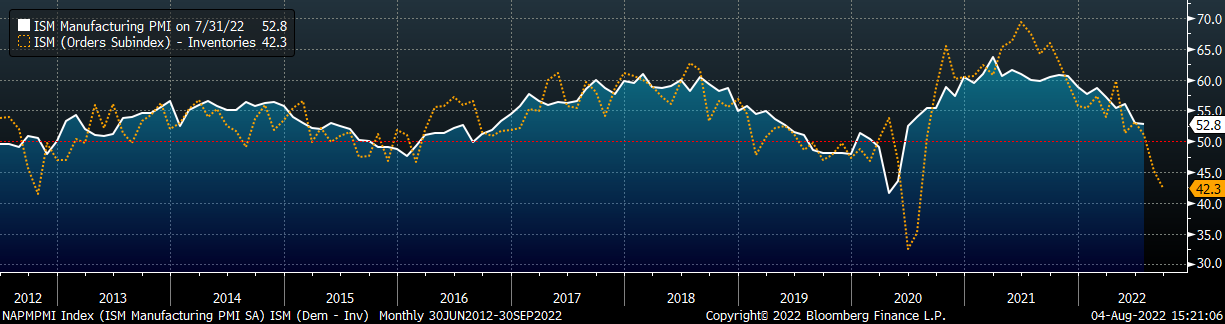
The chart below is comprised of the orders subindexes (new orders & backlog) minus inventories. Over time, this has been a reliable forward-looking indicator. As it currently stands, this relationship points to a contraction in the manufacturing sector as early as next month, with both inventories increasing and demand falling.
Global PMI
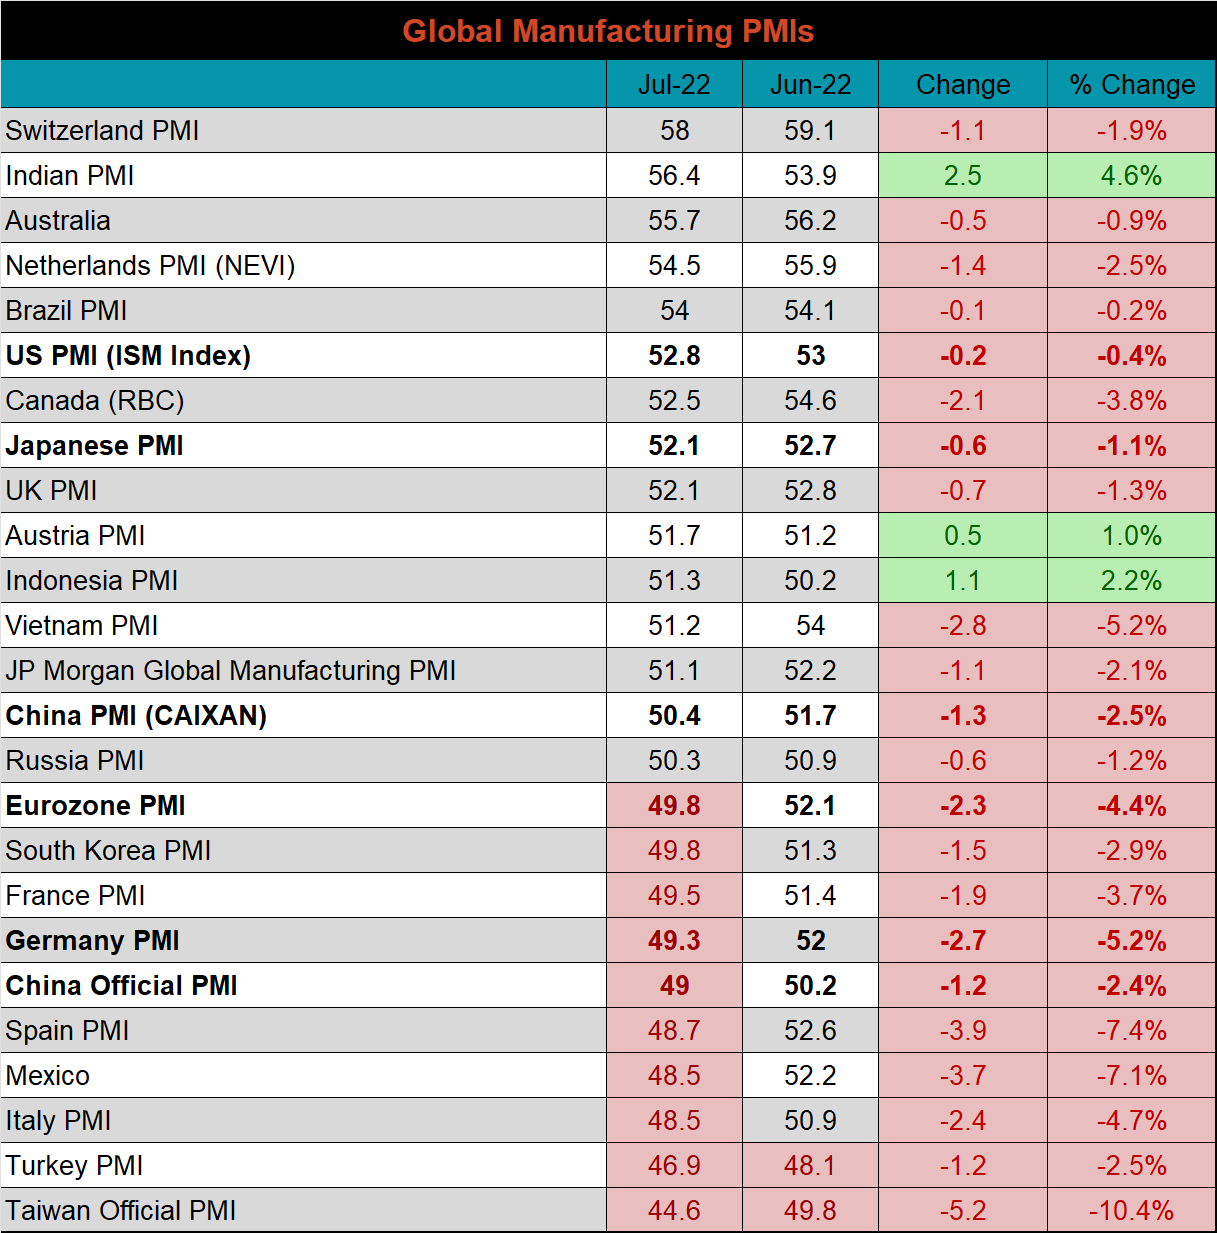
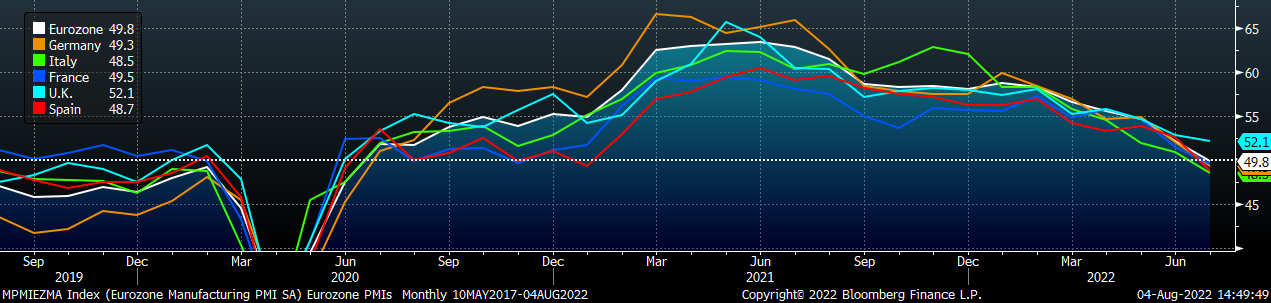
Global PMI data released in July was dismal. 7 of the 23 watched countries manufacturing sectors, slipping into contraction, most notably Germany, Europe (broadly), and China (official). On top of that, only India, Austria, and Indonesia moved further into expansion territory.
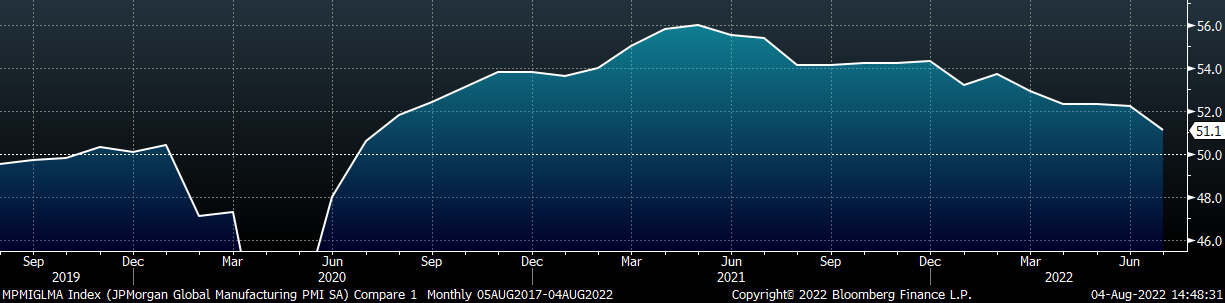
J.P. Morgan Global Manufacturing
Eurozone (white), German (orange), Italian (green), Spanish (red), and French (blue), U.K. (teal) Manufacturing PMIs
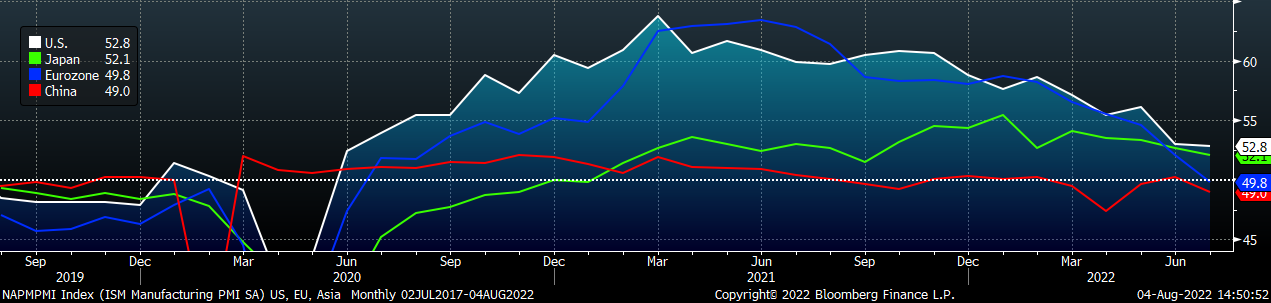
US (white), Euro (blue), Chinese (red) and Japanese (green) Manufacturing PMIs
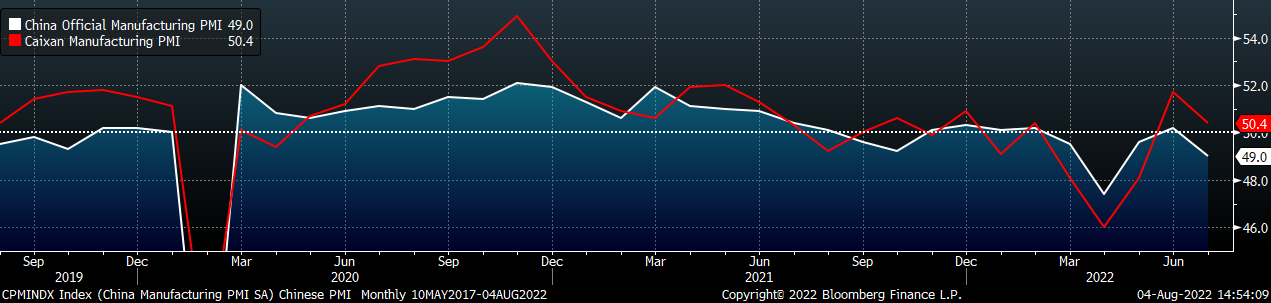
The Caixin and Chinese official PMI indexes both printed lower with the official PMI moving back into contraction territory.
China Official (white) and Caixan (red) Manufacturing PMIs
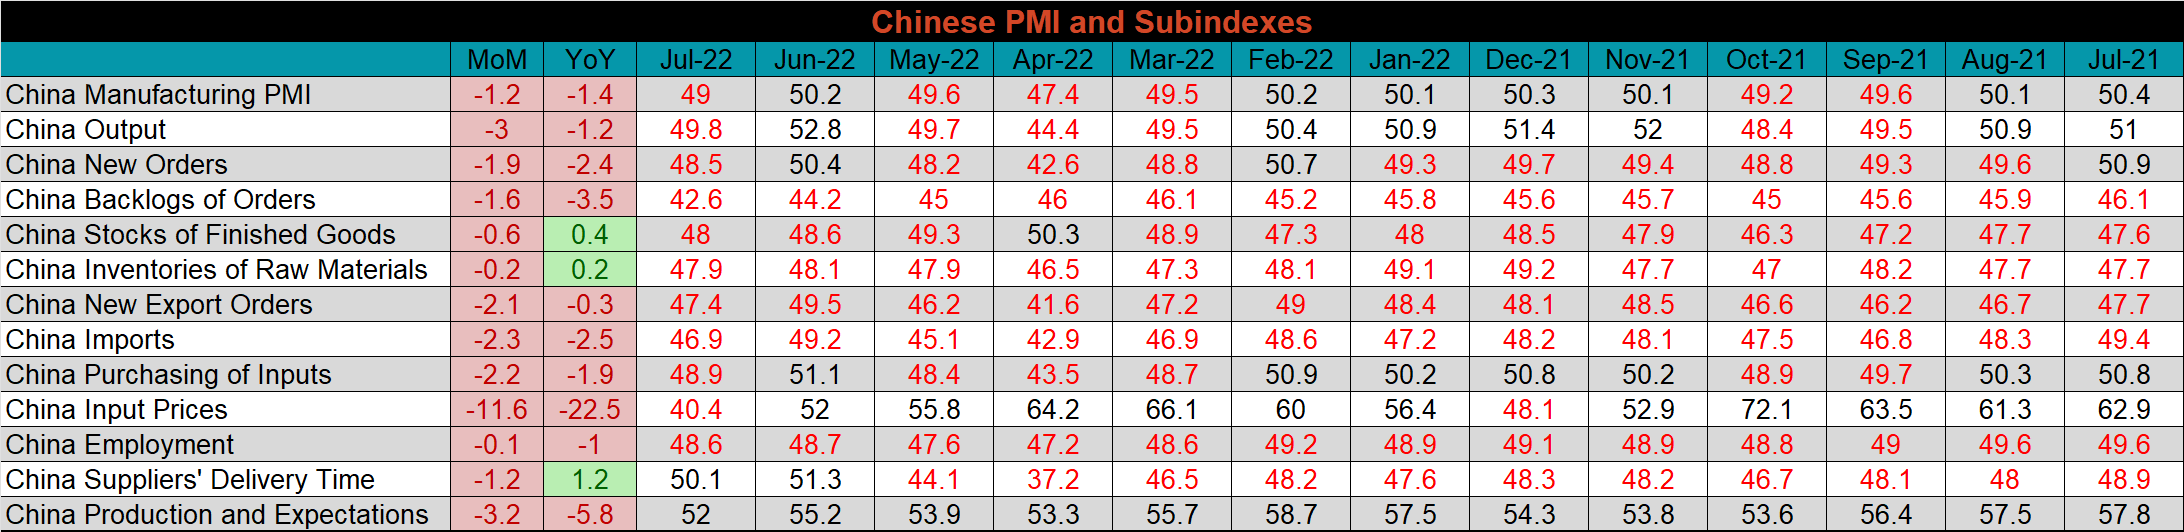
The table below breaks down China’s official manufacturing PMI subindexes. Input prices were down the most MoM and YoY for the third month in a row. Without the relief from prices, the number would likely be significantly worse, output and new orders both also moved back into contraction territory and all the other subindexes were lower than in June.
Construction Spending
June seasonally adjusted U.S. construction spending was down 1.1% MoM. Spending continues to outperform YoY, albeit at a slower rate, 8.3% higher than July 2021.
June U.S. Construction Spending
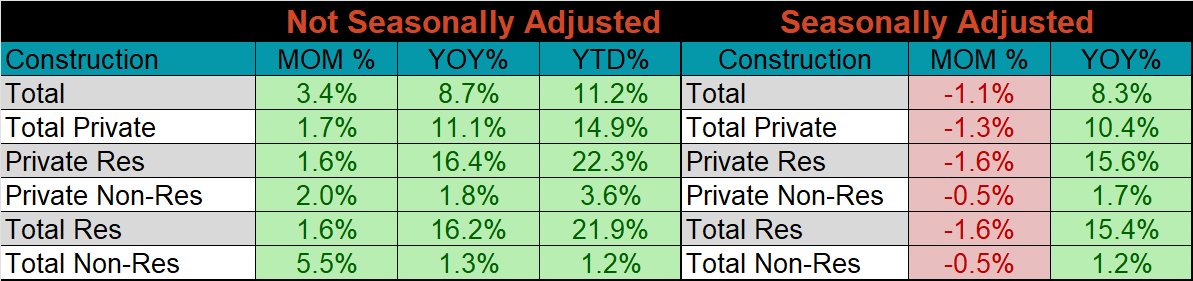
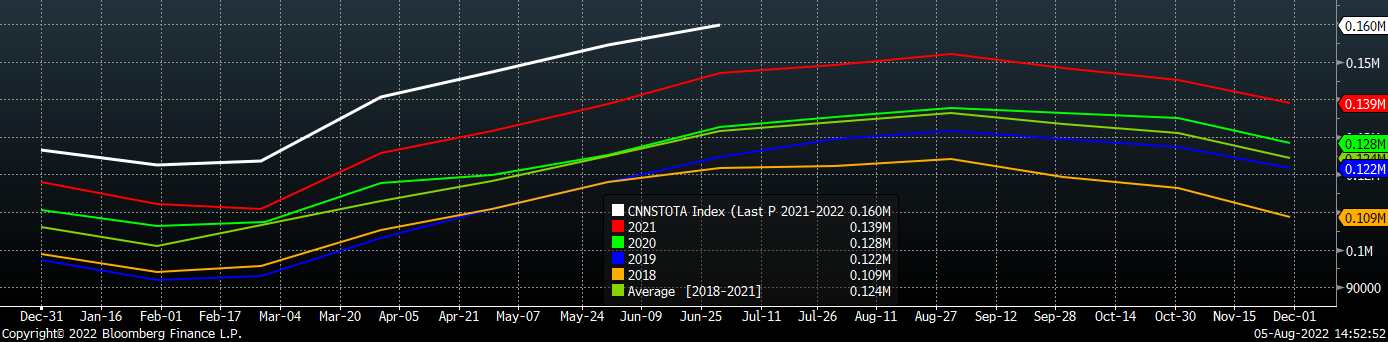
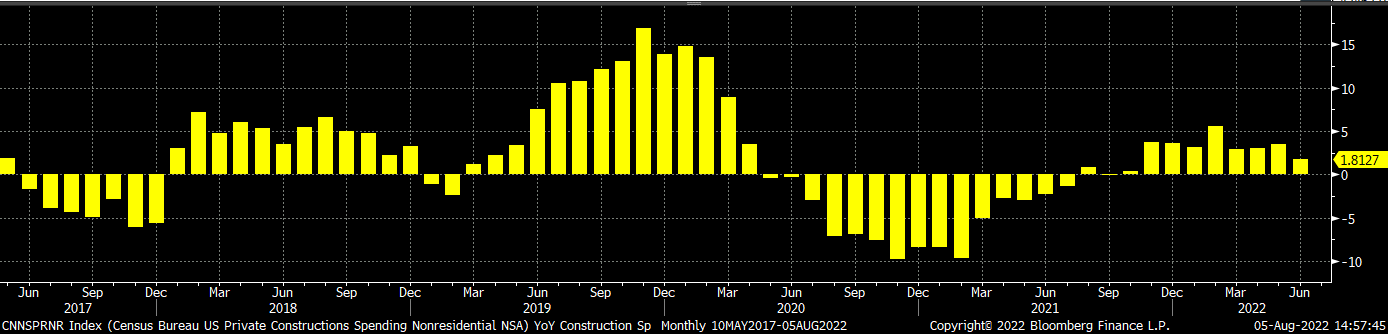
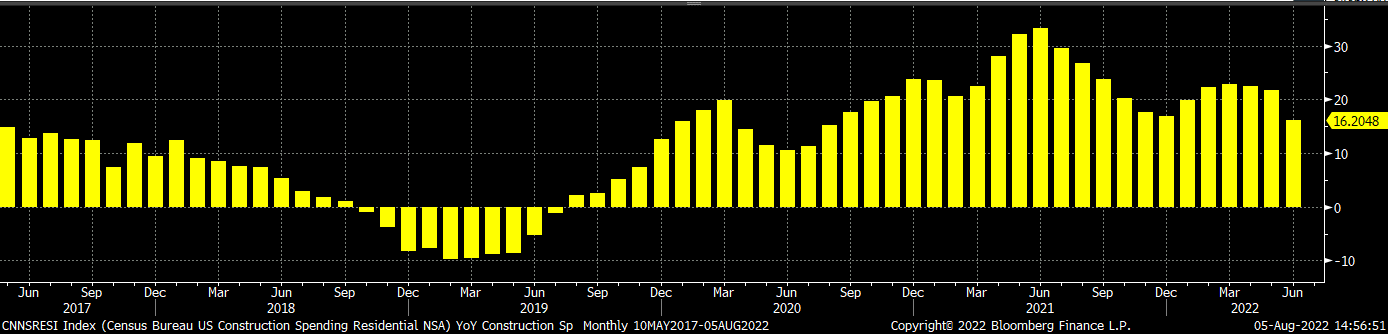
The white line in the chart below shows the continued growth in this year’s not seasonally adjusted construction spending in 2022, compared to the spending of the previous 4 years. The two bottom charts below show the YoY changes in construction spending. Both residential and non-residential spending continue to grow, however, the rate of growth for nonresidential decreased compared to the rate in June.
U.S. Construction Spending NSA
U.S. Private Nonresidential Construction Spending NSA YoY % Change
U.S. Residential Construction Spending NSA YoY % Change
Auto Sales
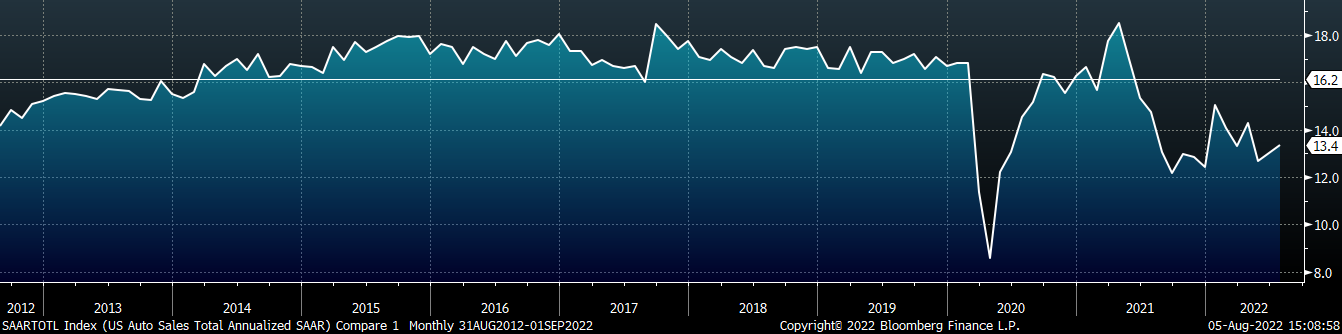
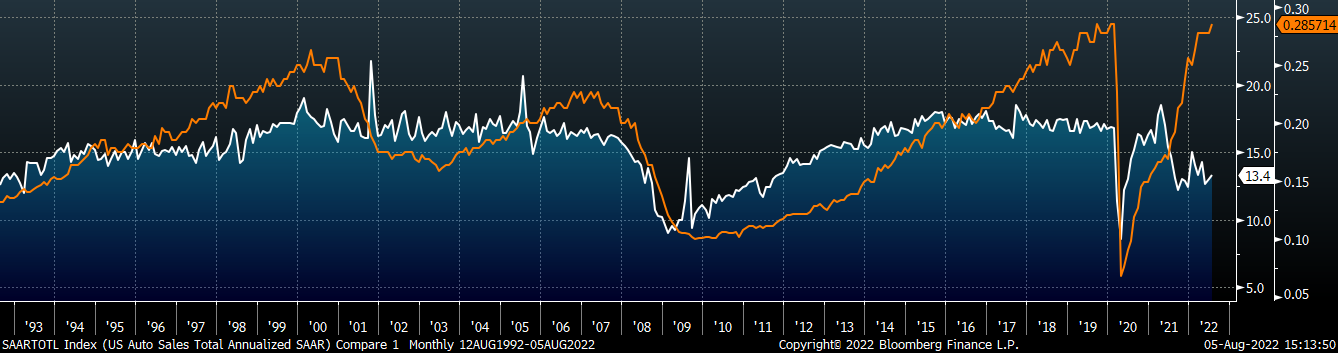
July U.S. light vehicle sales rose to a 13.4M seasonally adjusted annualized rate (S.A.A.R) they continued to be well below the 10-year average of 16.2m, as problems with the supply chain continue to impact production within the sector. The second chart shows the relationship between the unemployment rate and auto sales. The unemployment rate is inverted to show that declining unemployment typically leads to increasing auto sales. The labor market matched its recent record low which points to a strong backlog for auto demand.
July U.S. Auto Sales (S.A.A.R.)
July U.S. Auto Sales (white) and the Inverted Unemployment Rate (orange)
Risks
Below are the most pertinent upside and downside price risks:
Upside Risks:
- China reopening its economy with further stimulus measures
- Unplanned & extended planned outages, including operational issues leaving mills behind
- Energy issues abroad curtailing global production
- Easing supply chain restraints and labor shortages causing an increase in manufacturing activity
- Reluctance in placing import orders, leading to a dramatic reduction in arrivals later this year
Downside Risks:
- Decreasing input costs allowing mills to aggressively sell lower while remaining profitable
- Increased domestic production capacity leading to an increase in competitive pricing
- Steel consumers substitute to lower-cost alternatives
- Limited desire to restock at elevated prices and persistently short lead times causing a “Buyer’s Strike”
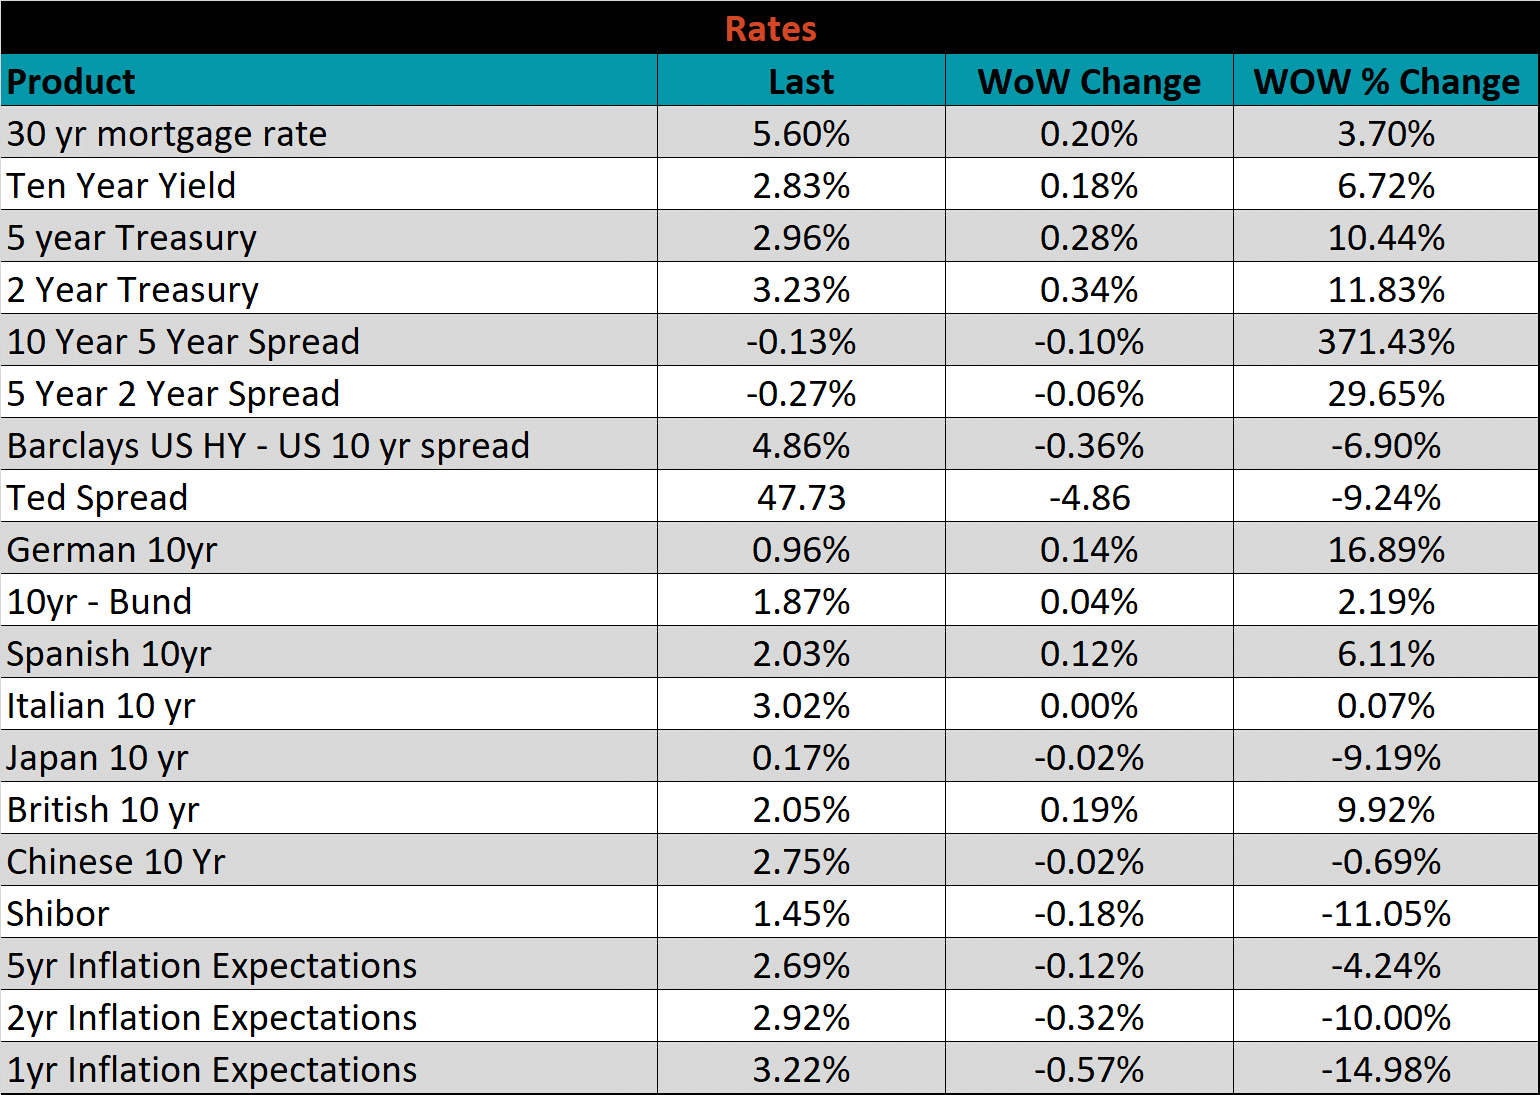
- Economic slowdown caused by increasing interest rates
HRC Futures
All of the below data points are as of August 5, 2022.
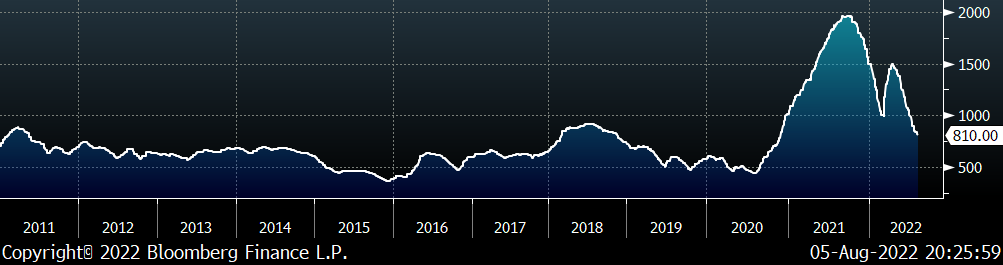
The Platts TSI Daily Midwest HRC Index fell another $30 to $810.
Platts TSI Daily Midwest HRC Index
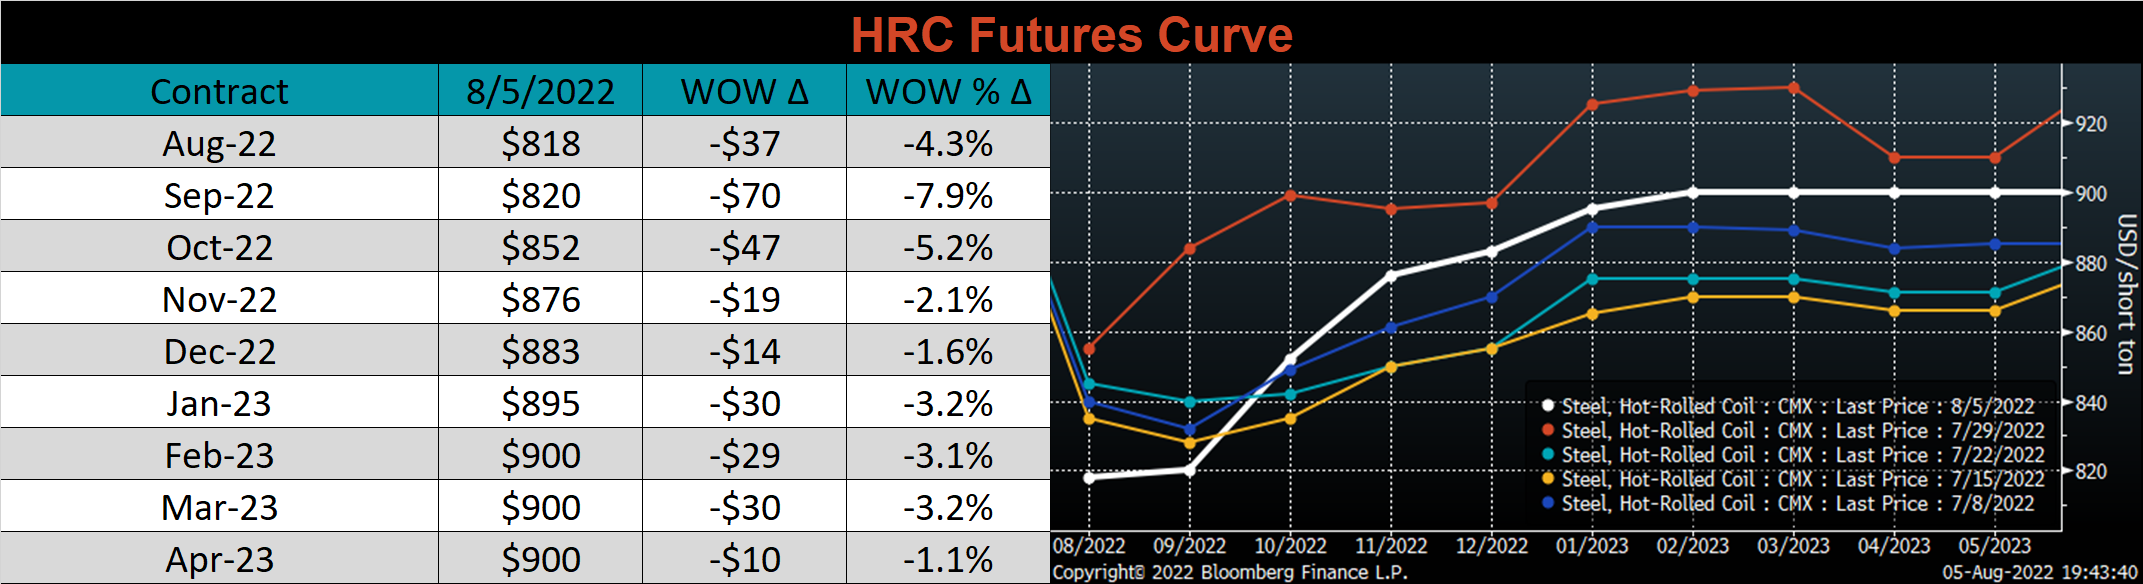
The CME Midwest HRC futures curve is above last Friday’s settlements in orange. The entire curve shifted lower last week, most significantly in the front with current levels pushing below the early-July trading range, causing to more significant contango.
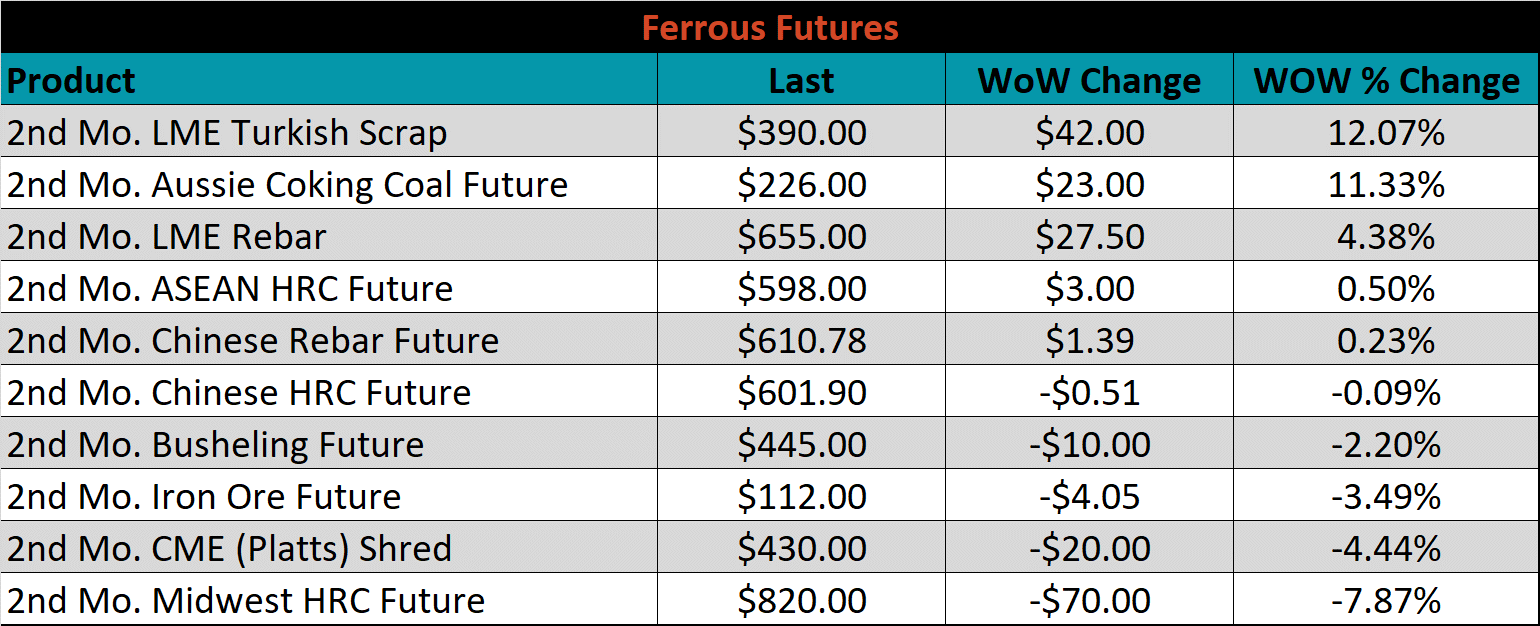
The 2nd month ferrous futures ended the week mixed, with Turkish scrap gaining 12.1%, while Midwest HRC lost another 7.9%.
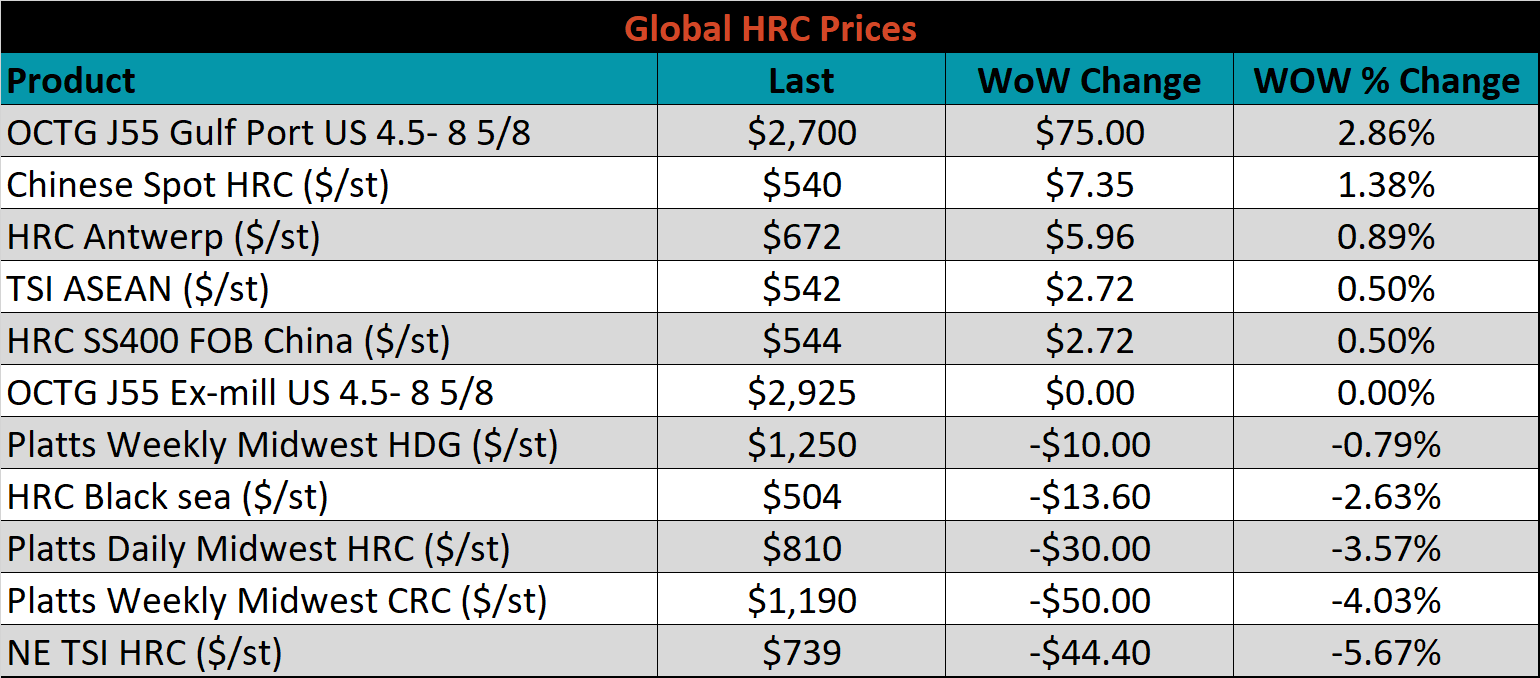
Global flat rolled indexes moved mostly lower, led by Northern European HRC down 5.7%, while Chinese Spot HRC gained 2.9%.
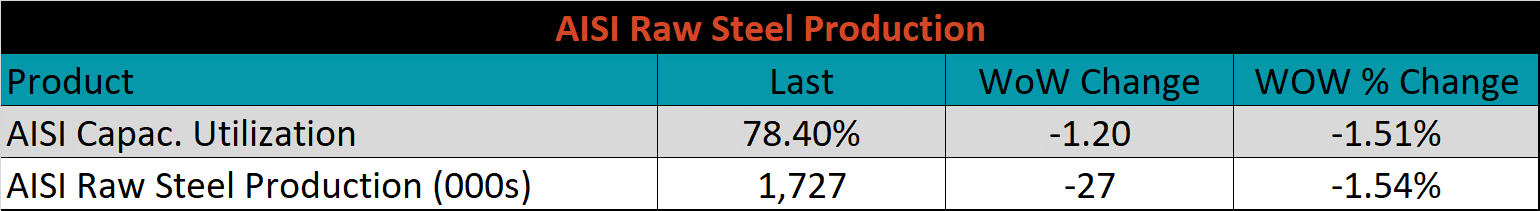
The AISI Capacity Utilization was down another 1.2% to 78.4%.
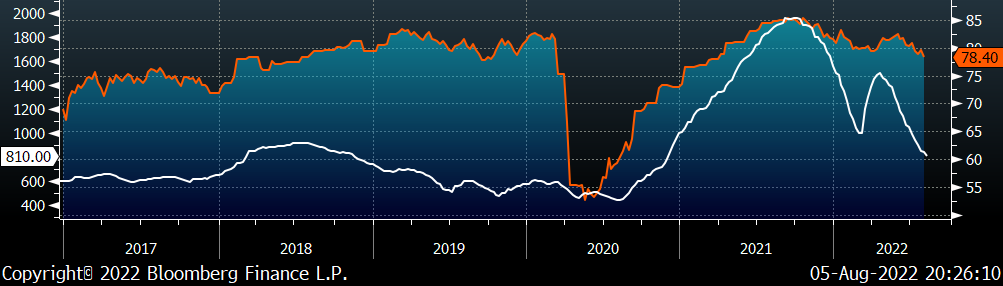
AISI Steel Capacity Utilization Rate (orange) and Platts TSI Daily Midwest HRC Index (white)
Imports & Differentials
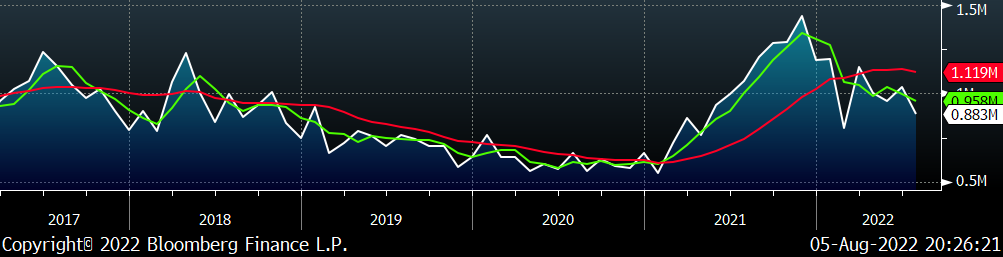
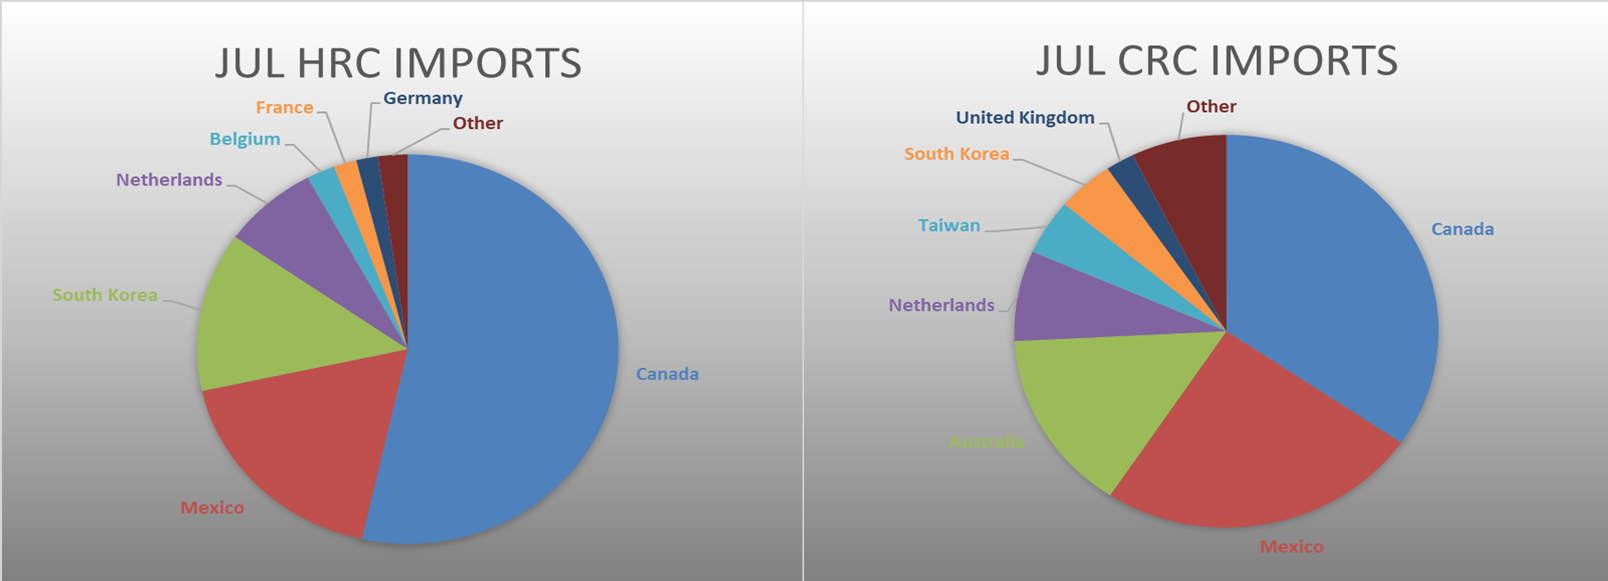
July flat rolled import license data is forecasting a decrease of 150k to 883k MoM.
All Sheet Imports (white) w/ 3-Mo. (green) & 12-Mo. Moving Average (red)
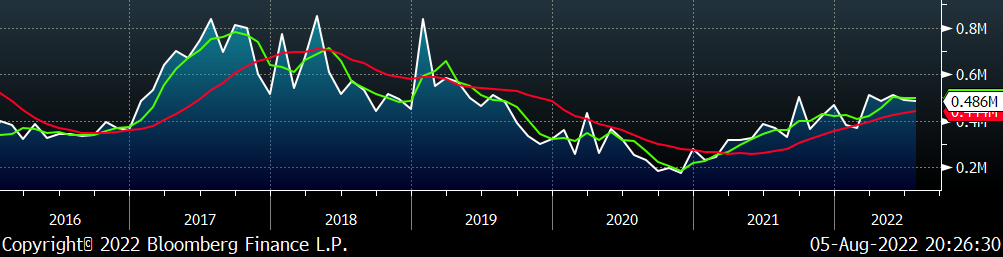
Tube imports license data is forecasting a decrease of 4k to 486k in July.
All Tube Imports (white) w/ 3-Mo. (green) & 12-Mo. Moving Average (red)
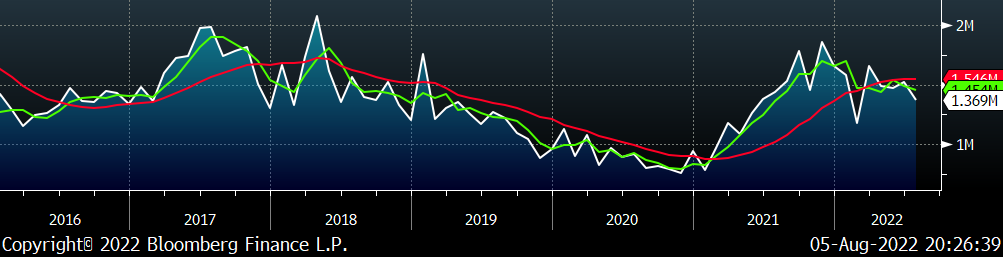
All Sheet plus Tube (white) w/ 3-Mo. (green) & 12-Mo. Moving Average (red)
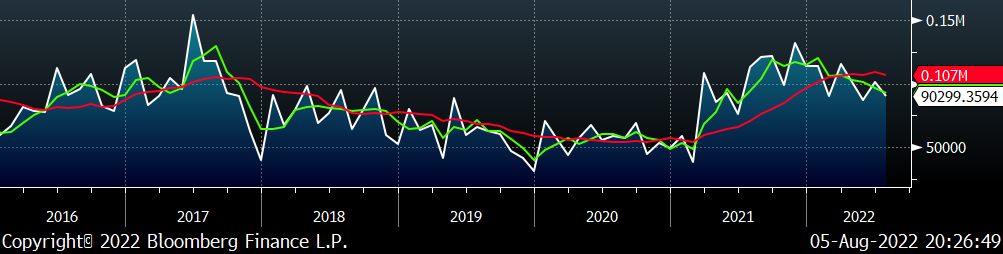
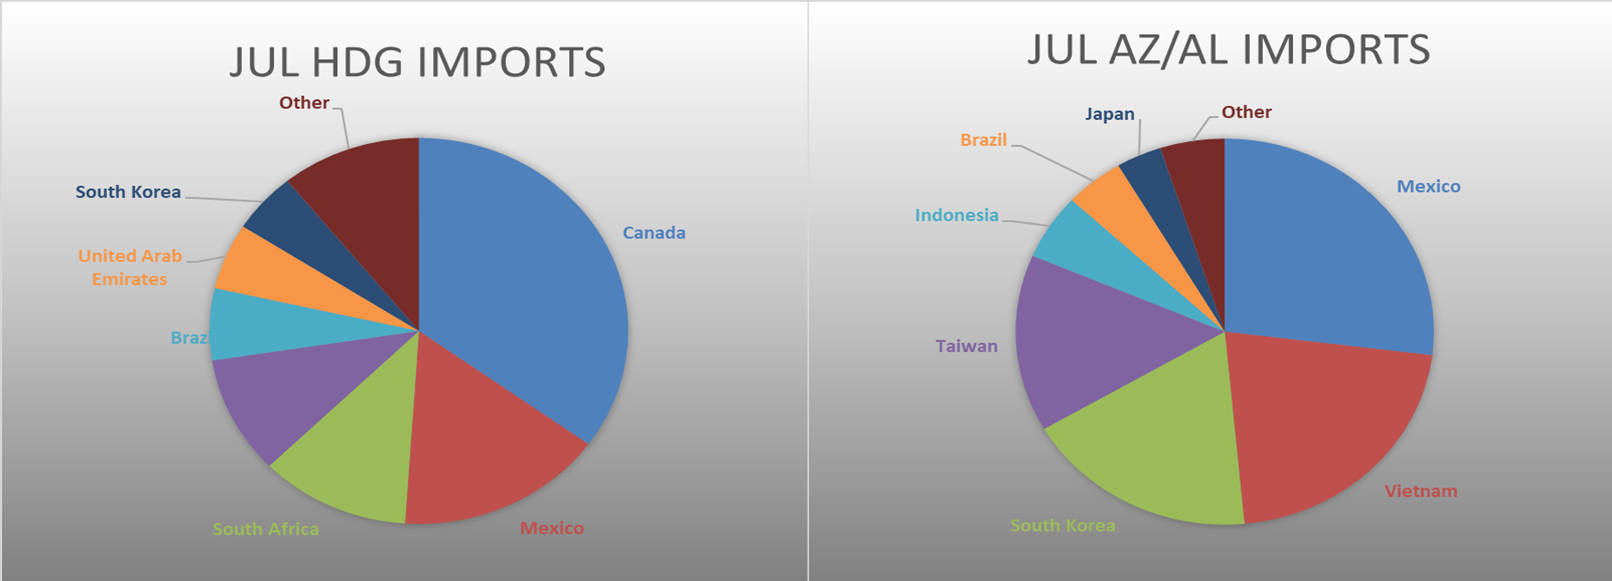
July AZ/AL import license data is forecasting a decrease of 11k to 90k.
Galvalume Imports (white) w/ 3 Mo. (green) & 12 Mo. Moving Average (red)
Below is June import license data through August 1st, 2022.
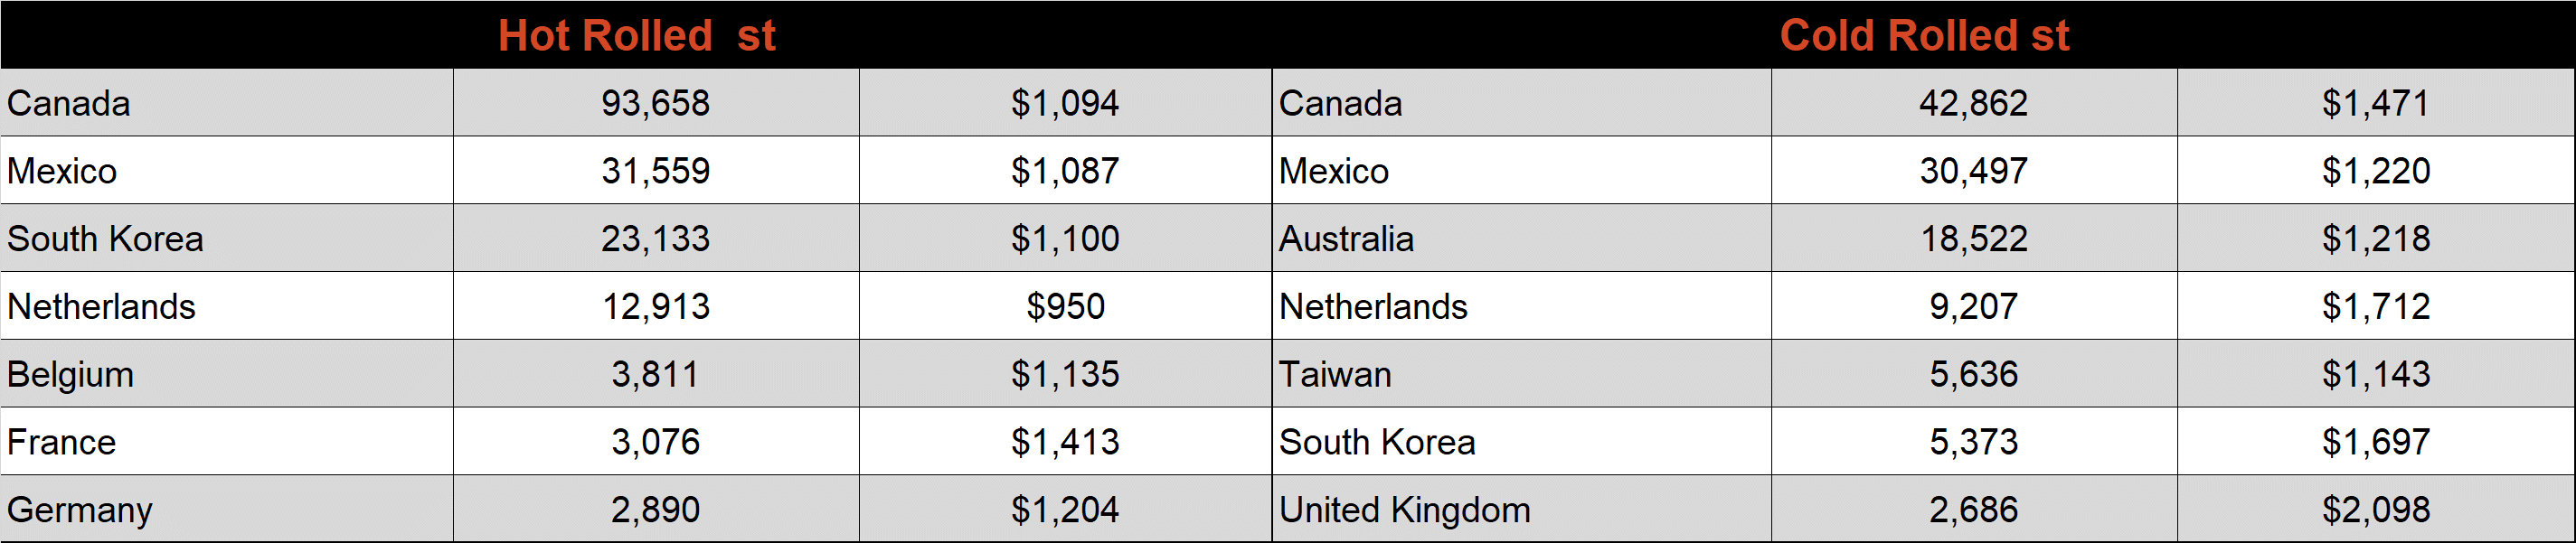
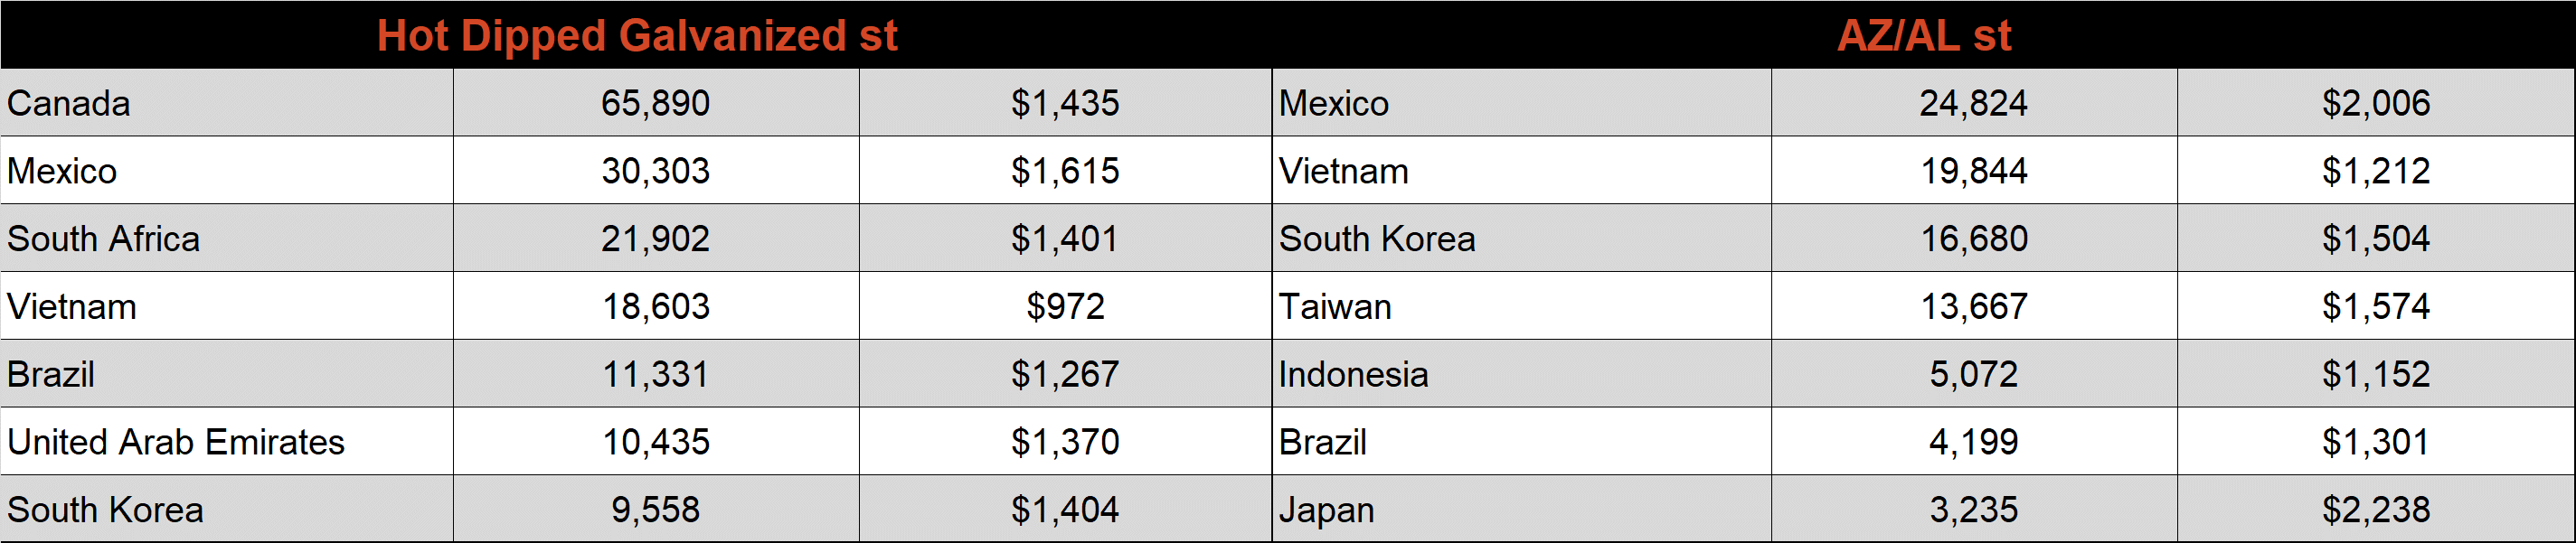
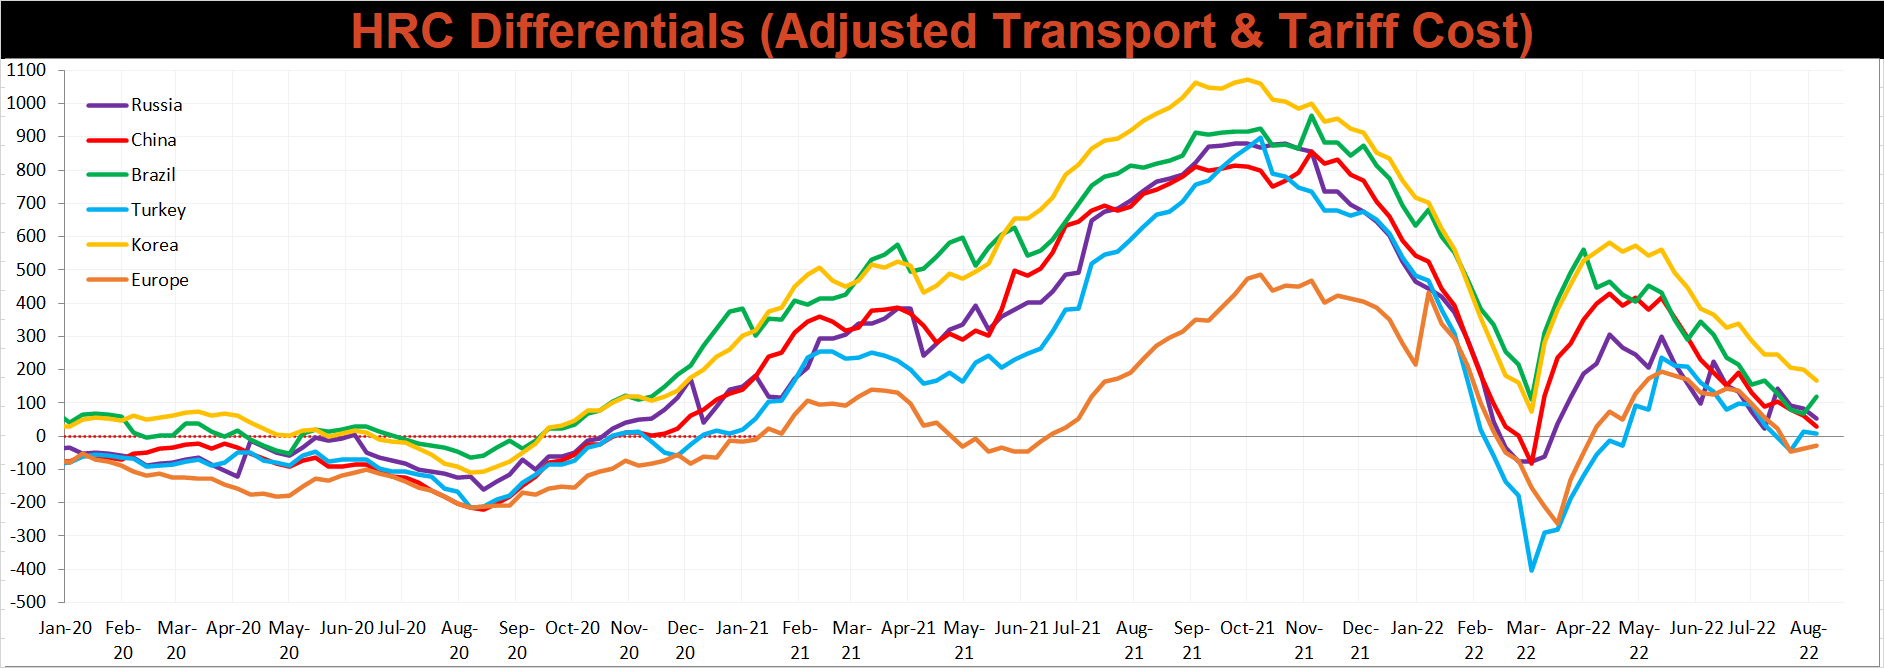
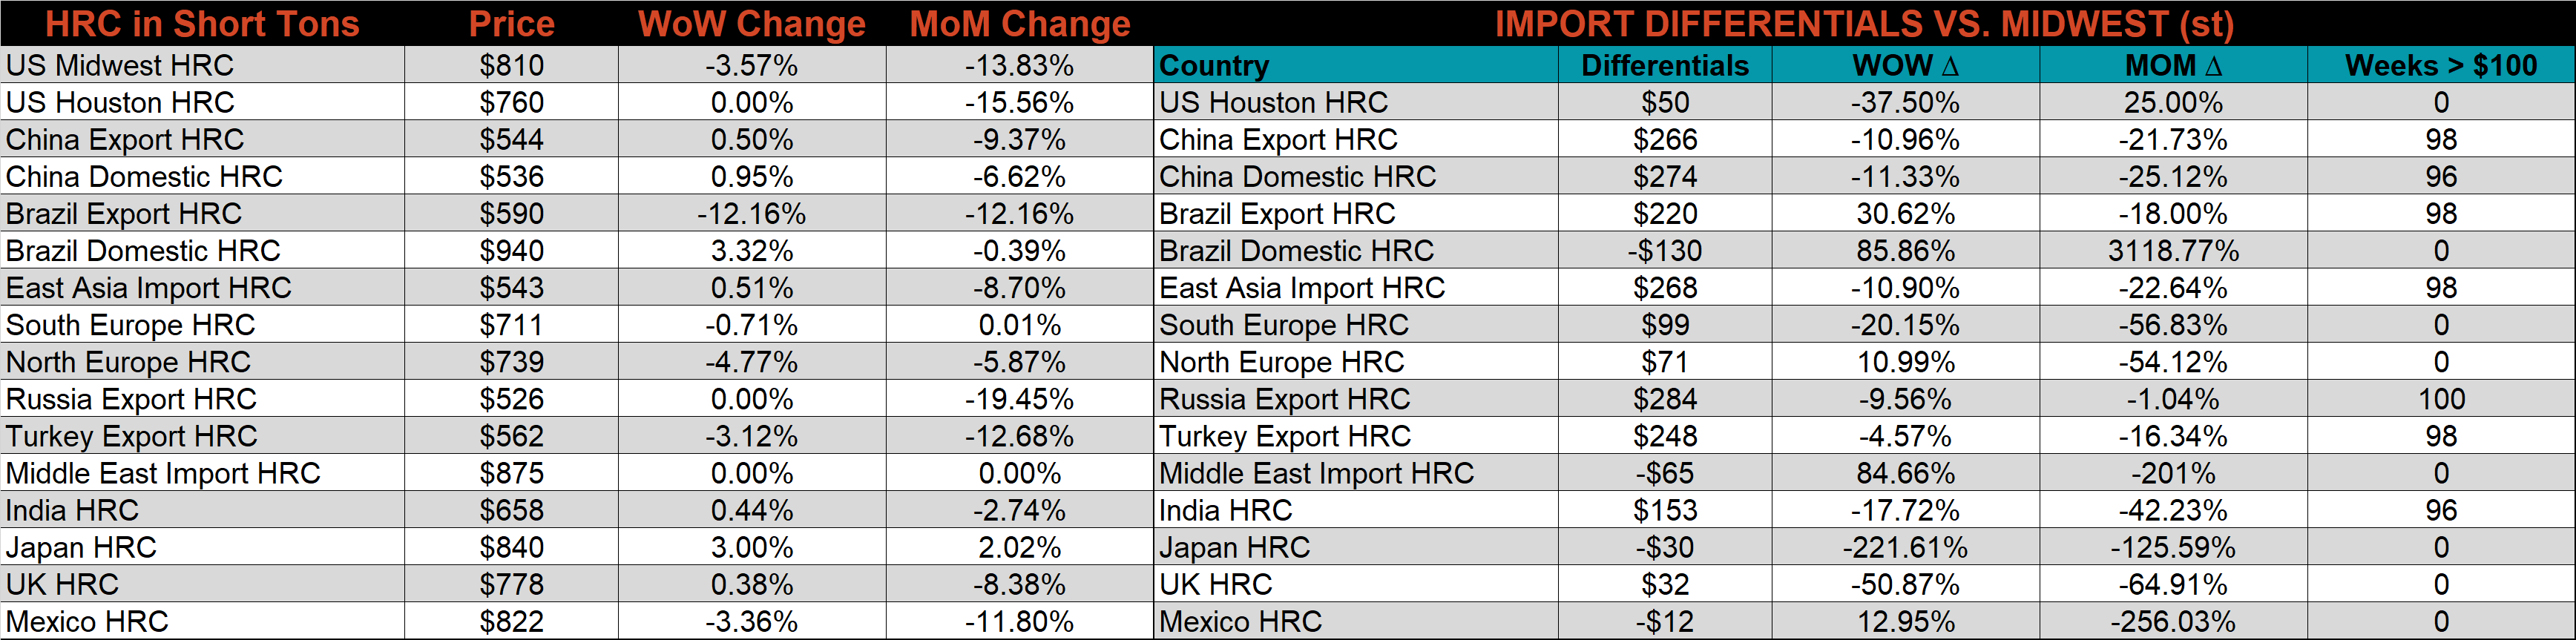
Below is the Midwest HRC price vs. each listed country’s export price using pricing from SBB Platts. We have adjusted each export price to include any tariff or transportation cost to get a comparable delivered price. Differentials increased for Brazil and Europe but continued to trend lower for the rest of the world.
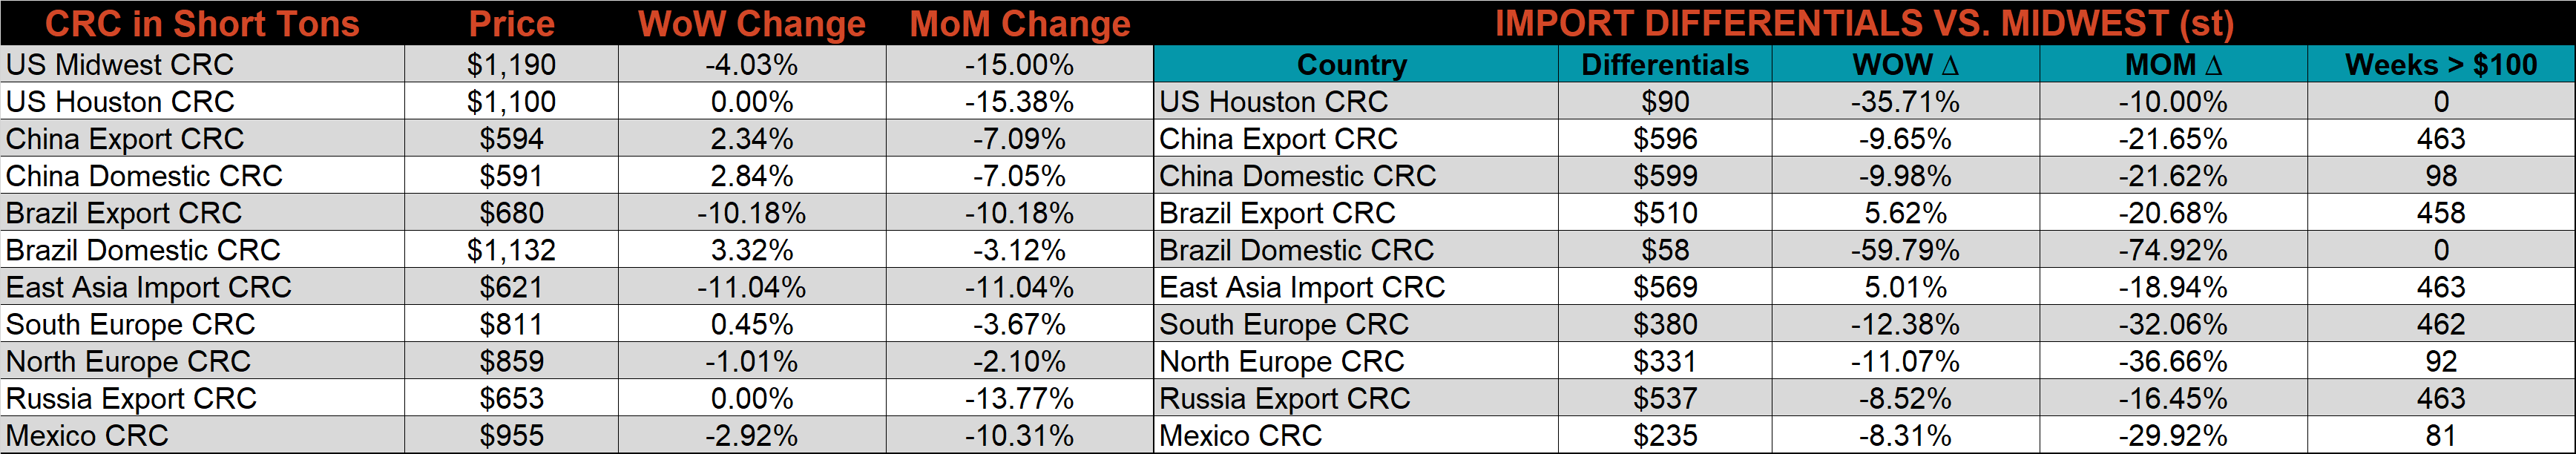
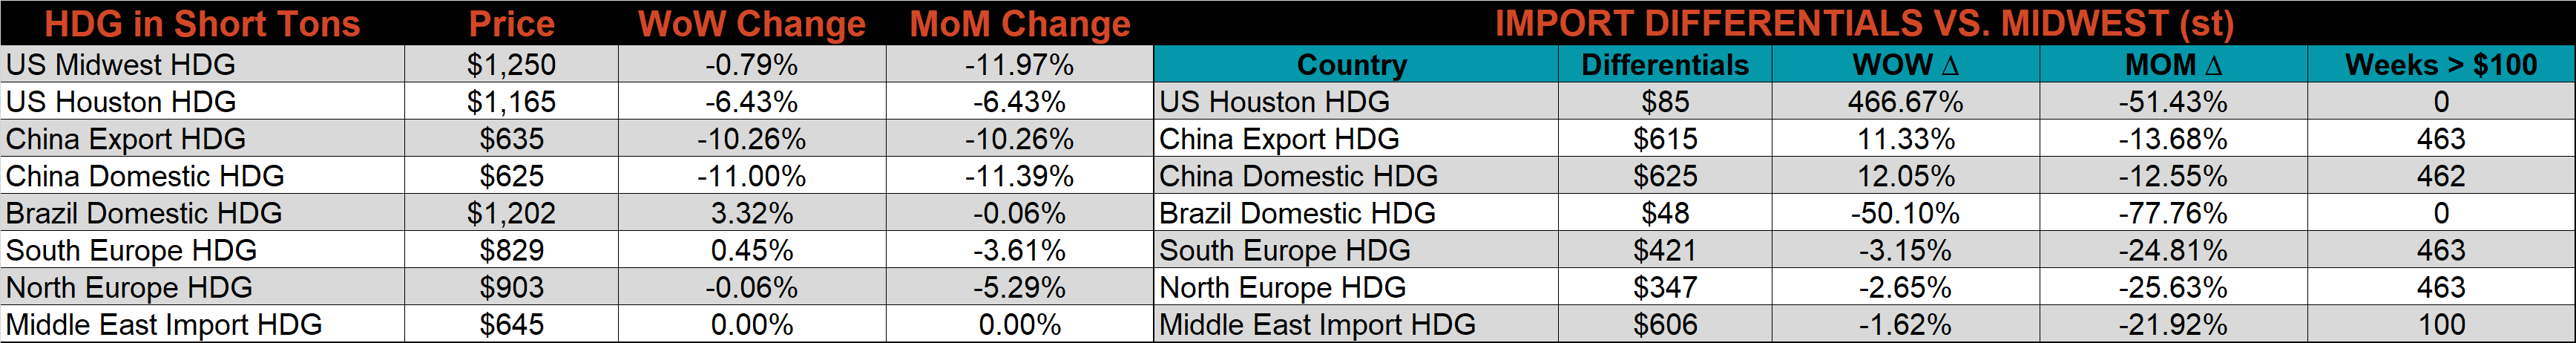
SBB Platt’s CRC, HRC, and HDG pricing is below. The Midwest CRC, HRC, & HDG prices were down 4%, 3.6%, and 0.8%, respectively.
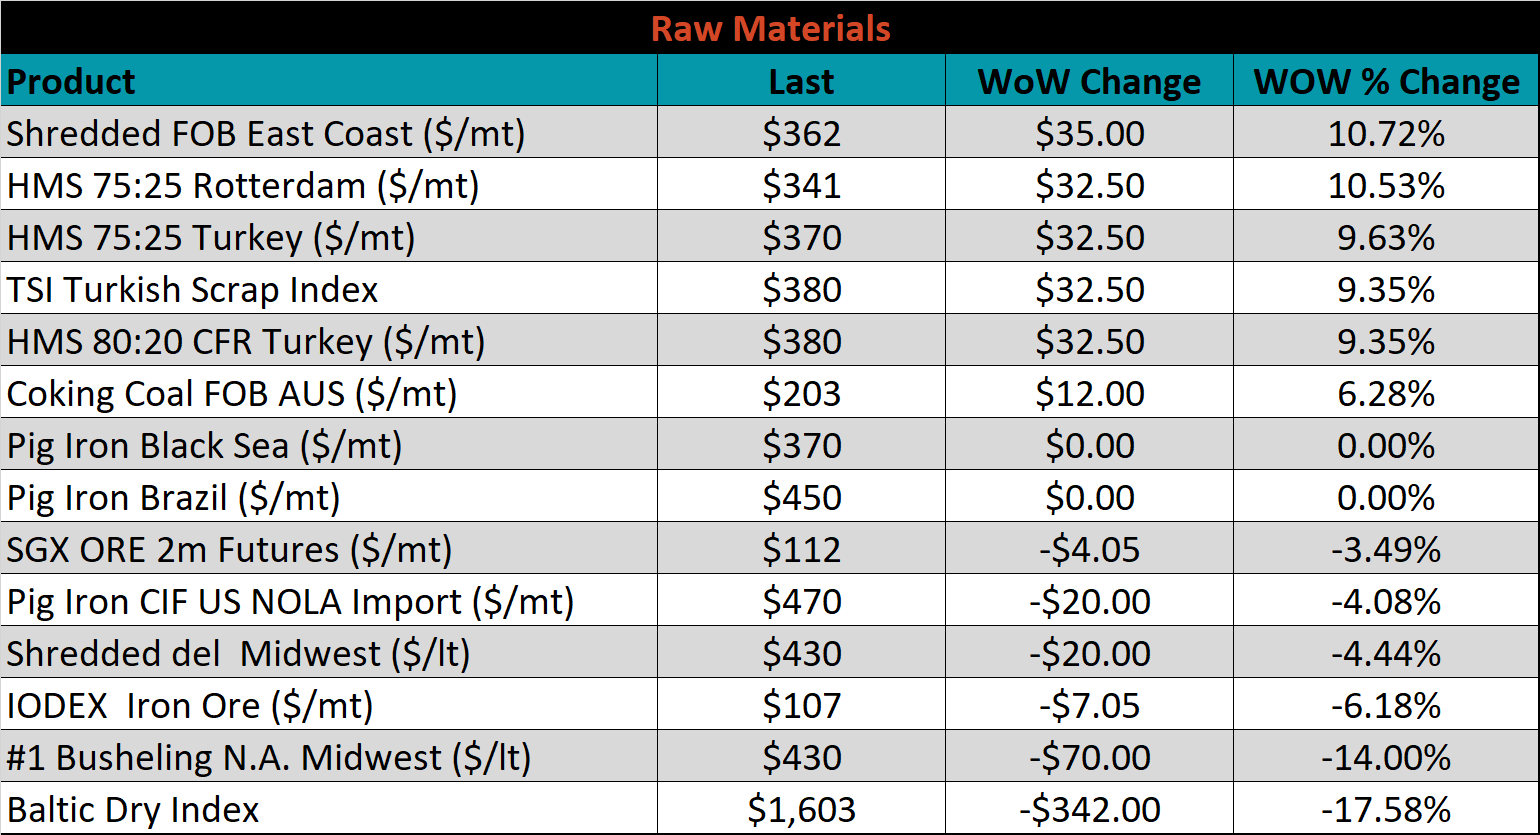
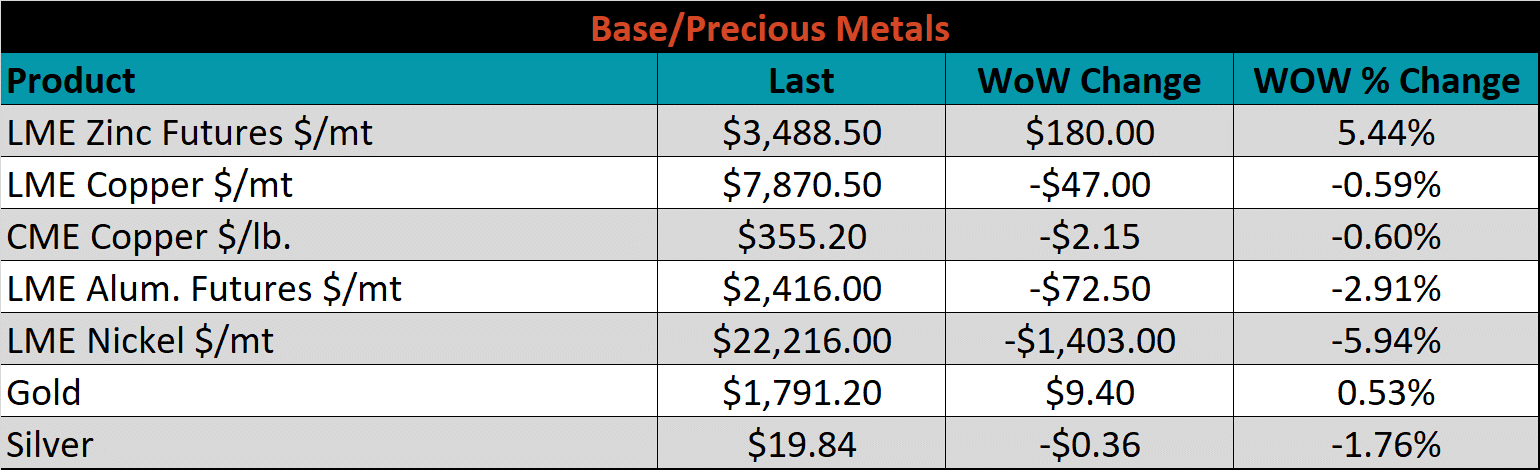
Raw Materials
Raw material prices were mixed last week, with East Coast shredded up 10.7%, while Midwest busheling was down 14%.
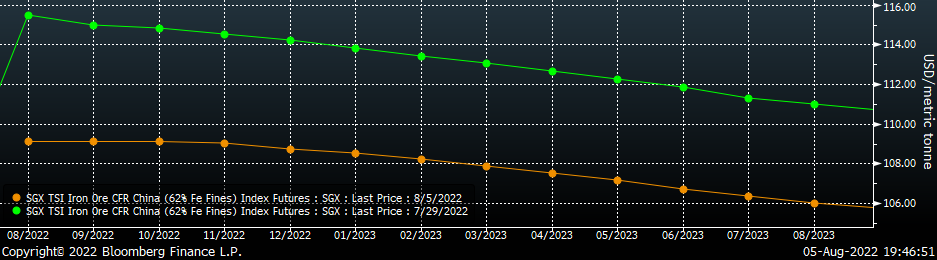
Below is the iron ore future curve with Friday’s settlements in orange, and the prior week’s settlements in green. Last week, the entire curve shifted sharply lower, most significantly in the front.
SGX Iron Ore Futures Curve
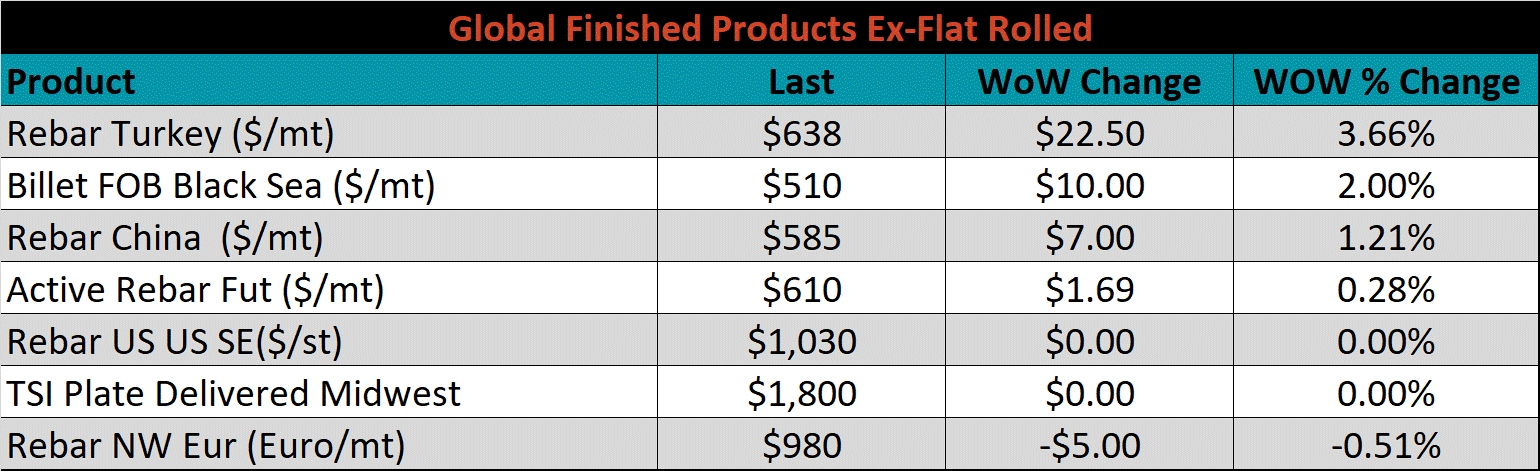
The ex-flat rolled prices are listed below.

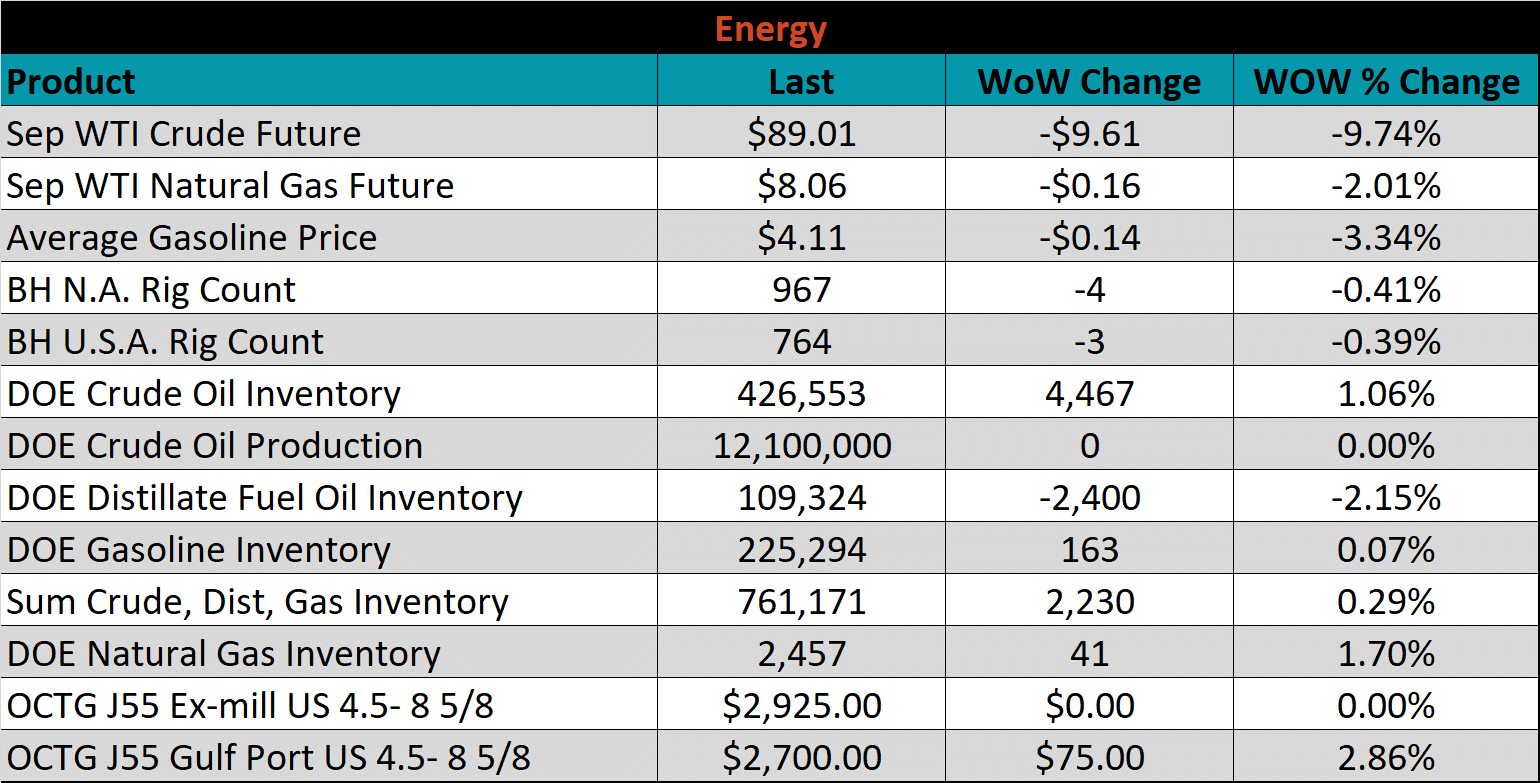
Energy
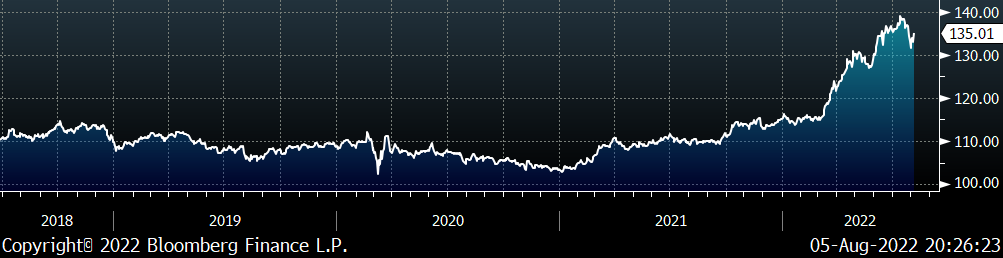
Last week, the September WTI crude oil future lost $9.61 or 9.7% to $89.01/bbl. The aggregate inventory level increased 0.3%. The Baker Hughes North American rig count decreased 4 rigs, while the U.S. rig count decreased 3 rigs.
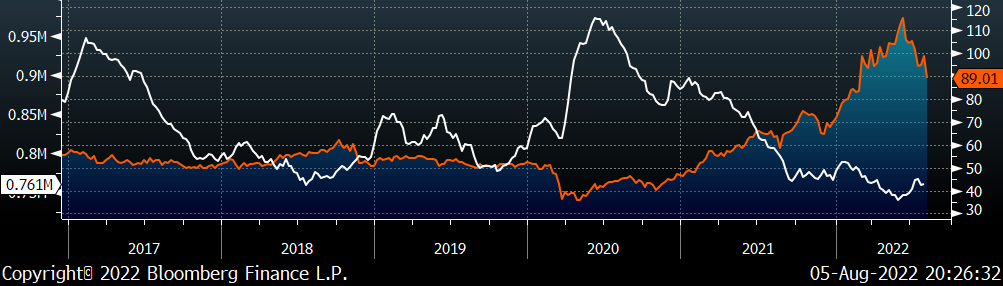
September WTI Crude Oil Futures (orange) vs. Aggregate Energy Inventory (white)
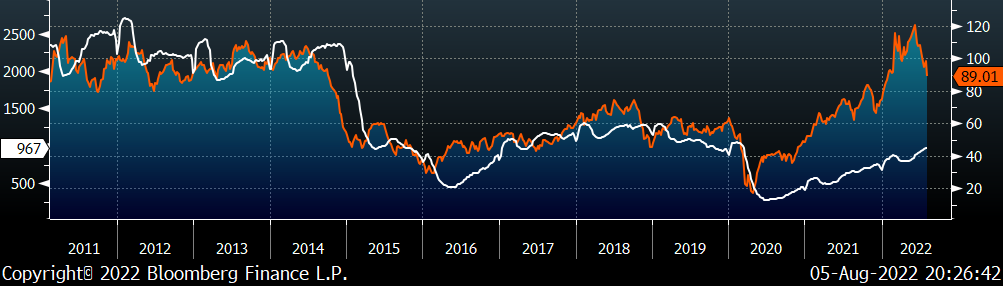
Front Month WTI Crude Oil Future (orange) and Baker Hughes N.A. Rig Count (white)
The list below details some upside and downside risks relevant to the steel industry. The bolded ones are occurring or highly likely.
Upside Risks:
- Inventory at end users and service centers below normal operational levels
- A higher share of discretionary income allocated to goods from steel-intensive industries
- Changes in China’s policies regarding ferrous markets, including production cuts and exports
- Unplanned & extended planned outages, including operational issues leaving mills behind
- Energy issues abroad curtailing global production
- Easing labor and supply chain constraints allowing increased manufacturing activity
- Mills extending outages/taking down capacity to keep prices elevated
- Global supply chains and logistics restraints causing regional shortages
- Fiscal policy measures including a new stimulus package
- Contentious union labor negotiations leading to supply disruption
- Fluctuating auto production, pushing steel demand out into the future
- The threat of further protectionist trade policies muting imports
Downside Risks:
- Increased domestic production capacity
- Elevated price differentials and hedging opportunities leading to sustained higher imports
- Steel consumers substitute to lower cost alternatives
- Steel buyers and consumers “double ordering” to more than cover steel needs
- Tightening credit markets, as elevated prices push total costs to credit caps
- Supply chain disruptions allowing producers to catch up on orders
- Limited desire to restock at elevated prices, causing a “Buyer’s Strike”
- Economic slowdown caused by the emergence of Coronavirus Variants
- Reduction and/or removal of domestic trade barriers
- Political & geopolitical uncertainty
- Chinese restrictions in the property market
- Unexpected sharp China RMB devaluation