
Market Commentary
This week, the physical steel market continued to push higher, with a $1,900 spot price appearing all but inevitable. One recent development of note is that for the first time in nearly a year, meaningful levels of spot tons for September production were offered to the market. The fact that tons became available was not a surprise, in recent weeks mills showed strict discipline not to market spot tons prematurely as they had earlier in the year, mainly because they are behind on contracts. The two aspects of this event that were unanticipated, however, were 1) the volumes were higher than we initially anticipated and 2) they were quickly soaked up by downstream customers in need. Our view is that the events of this week are a microcosm of how the steel market will operate through the end of the year and into the first quarter. We expect further upward pressure on prices due to the dynamics in the automotive sector as well as insights from continued 2022 mill contract negotiations.
Taking a step back, it appears the elevated level of spot tons are driven primarily by the continued slowdown in auto production. From the mills perspective this is an unequivocal win-win. First, it discredits a long-held, theory from bullish participants, that support for elevated prices would disappear once steel production rebounded to 2019 levels (which occurred around the May-June timeframe). Plus, they have guaranteed future demand when auto production starts back up as auto deal inventories are still very low. On top of that, these spot tons were sold at current market prices rather than on a discount, which further supports the theory that the market continues to operate at a structural deficit and demand for steel exists at a higher level that what is being supplied.
Over the past two weeks, earning’s calls for the big three auto manufacturers in the U.S. occurred with much attention placed on the chip shortage and its impact on production. While the sentiment was similar across the board, GM CFO, Paul Jacobson was the most explicit about 2022, saying: “Production will certainly be higher next year as we hope and expect that the chips will normalize.” What we believe this means in the short-term is there will likely be more scenarios where production starts and stops and tons that were initially allocated for auto will become available on the open market. On the other hand, once the chip shortage is resolved, demand from this sector could easily keep prices elevated as they restock severely depleted dealer inventory on hand.
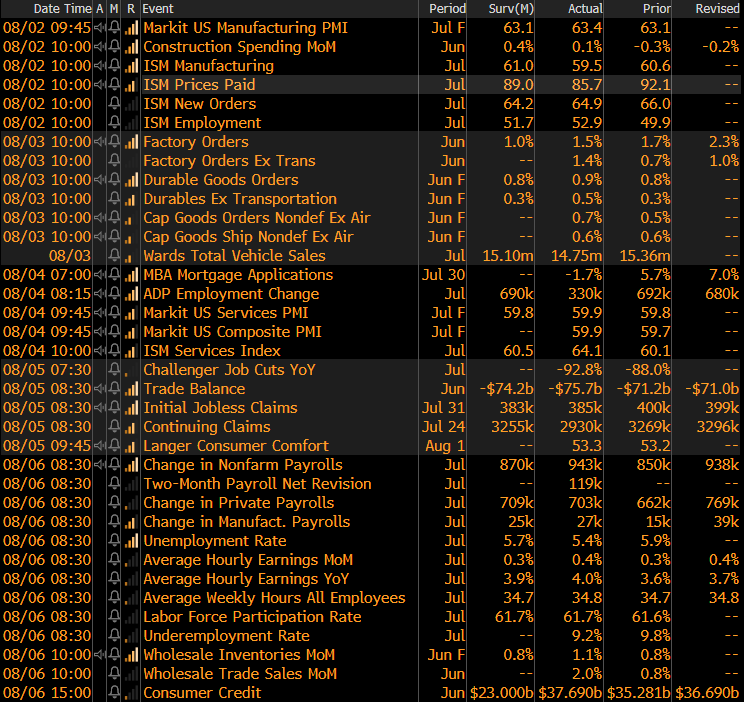
Additionally, ongoing mill contract negotiations suggest a bullish outlook from the mills. They are the primary touch point of true steel demand within the domestic market, and if they are pushing negotiations down the road, they are clearly confident about demand and prices over the next couple of months. If they saw lower prices and demand ahead, we believe negotiations would be locked in today. In the remainder of this report, we will review the economic data released at the beginning of August.
The chart below is the Platts Midwest HRC index (orange) and the ISM Manufacturing PMI (white). Further expansion (prints above 50) in the manufacturing sector continues to support HRC prices.


ISM PMI
The July ISM Manufacturing PMI and subindexes are below.
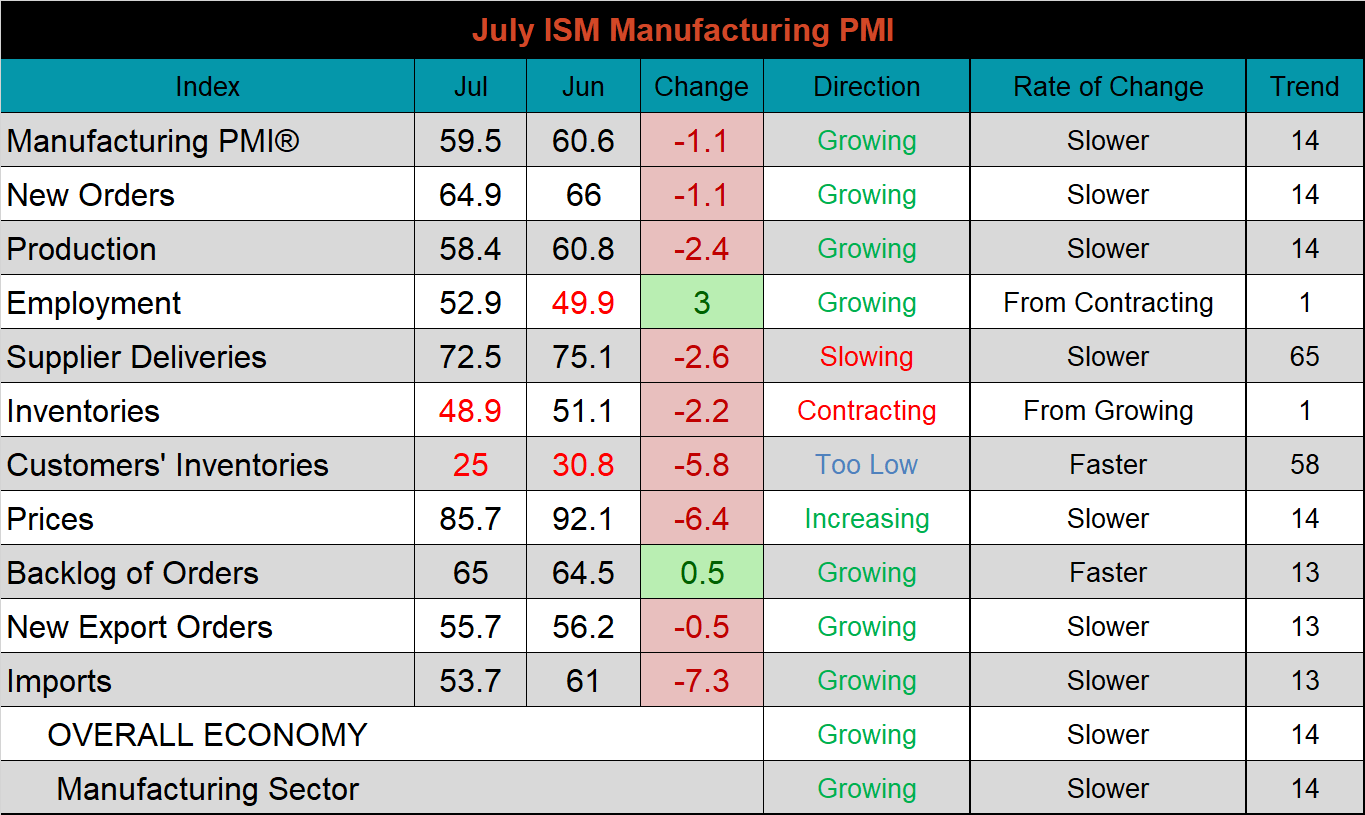
The chart below compares the ISM prices subindex with the ISM customer inventories subindex. This month, the customer inventories subindex fell significantly and is currently at the lowest level on record. The prices subindex decreased as well but remains well in expansion territory. The second chart shows the new orders plus backlog subindexes. Both, remain firmly in expansion, and among the highest levels on record, even after two straight months of slight decreases. The final chart shows the supplier deliveries subindexes, which remain historically elevated, as the fallout in supply chains caused by the pandemic continues to put stress on the industry.
ISM Manufacturing PMI Customer Inventories Subindex (orange) & Prices Subindex (white)

ISM Manufacturing PMI New Orders plus Backlog sub-indexes

ISM Manufacturing Supplier Deliveries

Year-over-year readings in a few key subindexes are enlightening. Prices, supplier deliveries, and the backlog of orders remain significantly above last year’s levels, while customer inventories (which were already too low) have fared much worse. This is another reminder that even though the current climate may feel somewhat normalized, the lasting impacts of the pandemic remain firmly in place.


Global PMI
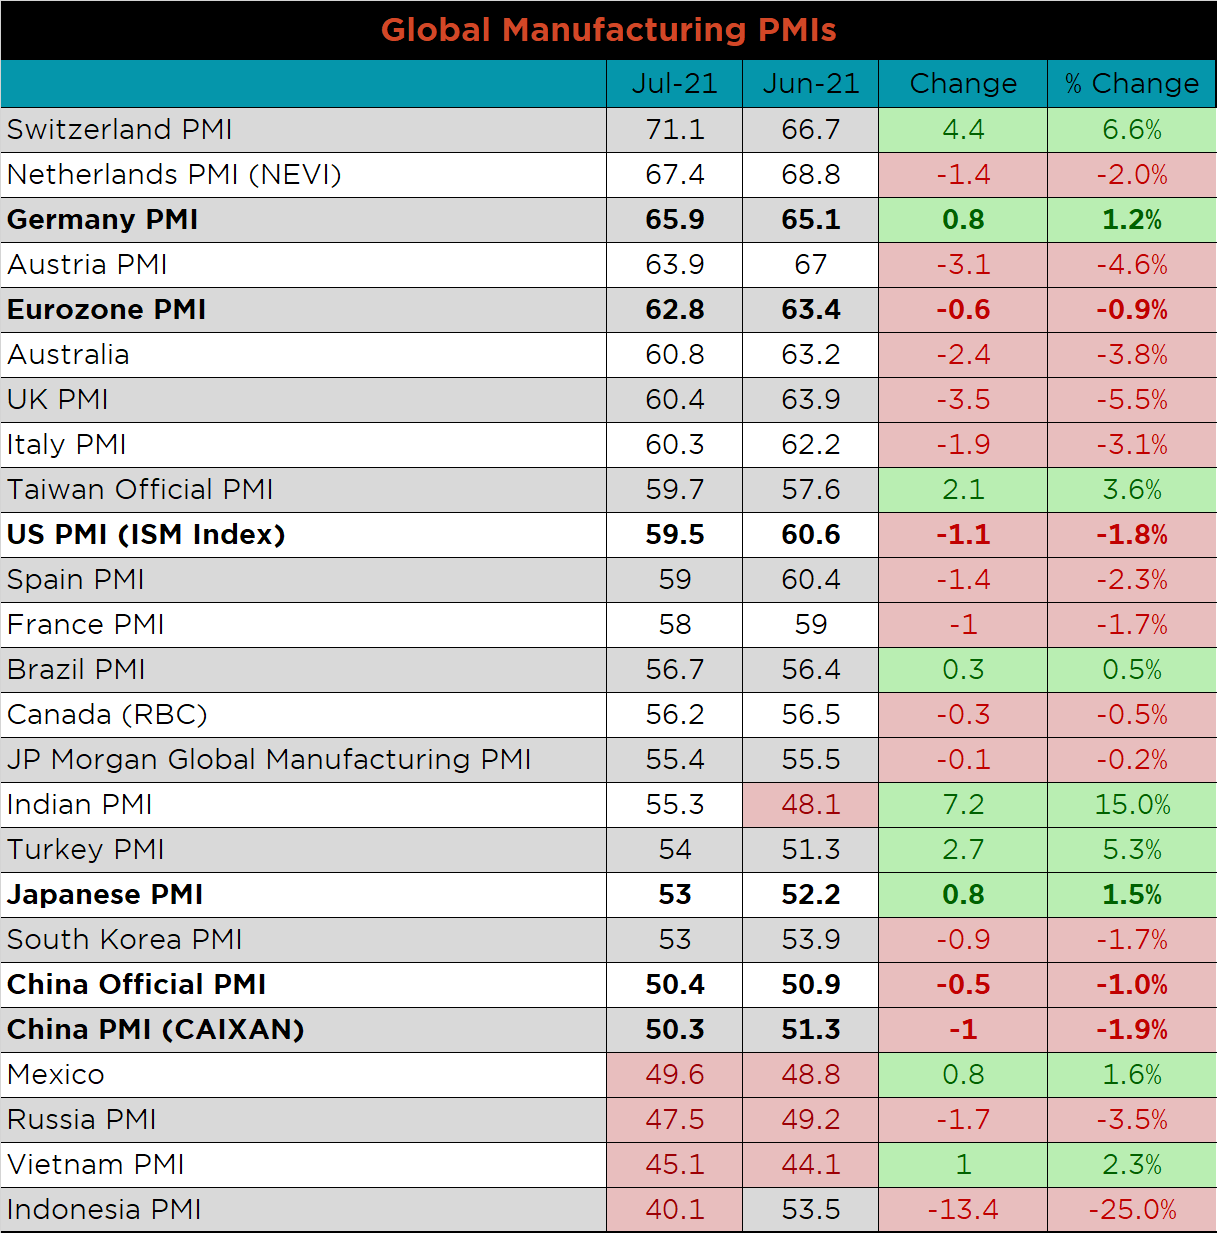
The July global PMI printings remain mostly in expansion territory with 20 of the 24 watched countries expanding compared to last month. The five most significant countries (bold) continue to expand, while Russia, Mexico, Vietnam, and Indonesia saw their manufacturing sectors contract.
J.P. Morgan Global Manufacturing

Eurozone (white), German (orange), Italian (green), Spanish (red), and French (blue), U.K. (teal) Manufacturing PMIs

US (white), Euro (blue), Chinese (red) and Japanese (green) Manufacturing PMIs

Both China’s official manufacturing PMI and the Caixan PMI were slightly lower but remain in expansion territory.
China Official (white) and Caixan (red) Manufacturing PMIs

The table below breaks down China’s official manufacturing PMI subindexes. The input prices subindex is up the most significantly MoM and YoY. Additionally, the output subindex continues to expand, but has been losing momentum since March.


Construction Spending
June seasonally adjusted U.S. construction spending was up slightly, 0.1% compared to May but 8.2% higher than June 2020.
June U.S. Construction Spending

The white line in the chart below represents not seasonally adjusted construction spending in 2021 and compares it to the spending of the previous 4 years. Overall spending continues to expand and is at its highest level in the last 4 years. The last two charts show the YoY changes in construction spending. Private non-residential spending decreased further in April, for the thirteenth month in a row, while other leading indicators suggest a turnaround in this category is in progress. Residential spending continues to outperform compared to last year’s levels, while showing no signs of slowing down.
U.S. Construction Spending

U.S. Private Nonresidential Construction Spending NSA YoY % Change

U.S. Residential Construction Spending NSA YoY % Change


Auto Sales
July U.S. light vehicle sales continued to slide, down to a 14.8m seasonally adjusted annualized rate (S.A.A.R). The second chart shows the relationship between the unemployment rate and auto sales. The unemployment rate is inverted to show that declining unemployment typically leads to increasing auto sales. The labor market recovery continues to improve with impressive number for July, while auto sales remain constrained by the lack of finished inventory, driven by the chip shortage.
June U.S. Auto Sales (S.A.A.R.)

June U.S. Auto Sales (orange) and the Inverted Unemployment Rate (white)


Risks
Below are the most pertinent upside and downside price risks:
Upside Risks:
- Higher share of discretionary income allocated to goods from steel intensive industries
- Strengthening global flat rolled and raw material prices
- Unplanned & extended planned outages
- Low current import levels
- Declining/low inventory levels at end users and service centers
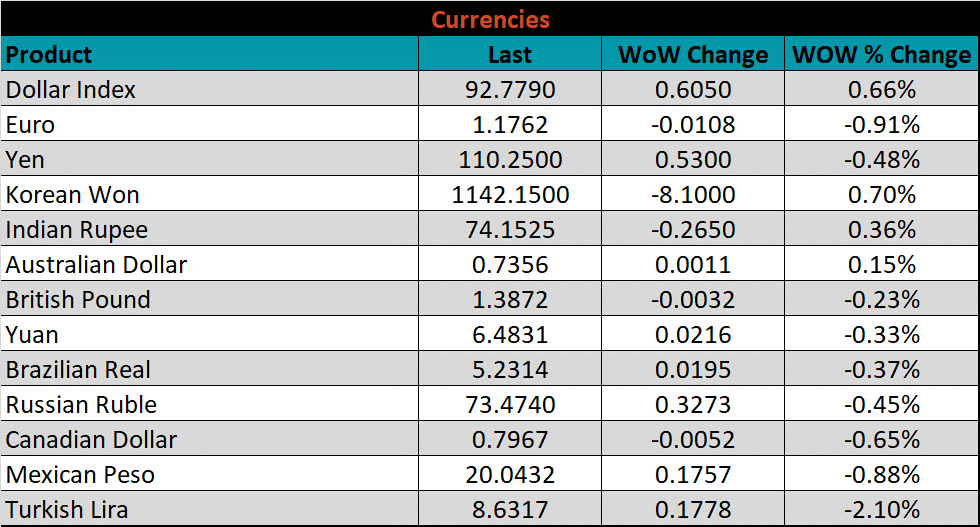
- Broad increases in commodity prices due to a weakening US Dollar
- Limited spot transactions skewing market indexes to extreme levels
Downside Risks:
- Increased domestic production capacity
- Increasing price differentials and hedging opportunities leading to higher imports
- Steel consumers substitute to lower cost alternatives
- Steel buyers and consumers “double ordering” to more than cover steel needs
- Weak labor and construction markets
- Tightening credit markets, as elevated prices push total costs to credit caps
- Reduction and/or removal of domestic trade barriers
- Supply chain disruptions allowing producers to catch up on orders

HRC Futures
All of the below data points are as of August 6, 2021.
The Platts TSI Daily Midwest HRC Index increased by $25 to $1,887.25.
Platts TSI Daily Midwest HRC Index

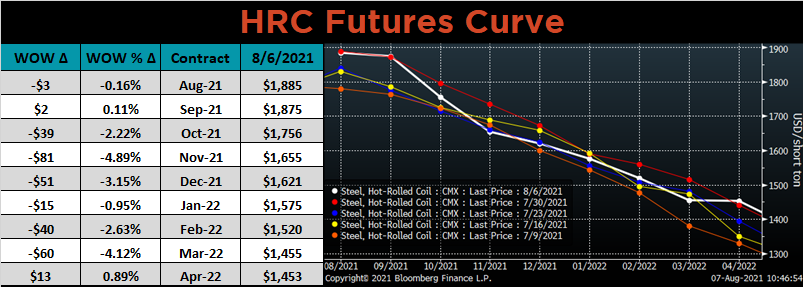
The CME Midwest HRC futures curve is below with last Friday’s settlements in white. Last week, the front of the curve showed very little change, while 4Q21-1Q22 shifted lower. The chart below shows how tight of a price range futures have been trading in over the last month.
September ferrous futures were mostly lower. Iron ore lost another 6.1%, while the Aussie coking coal future gained 0.3%.
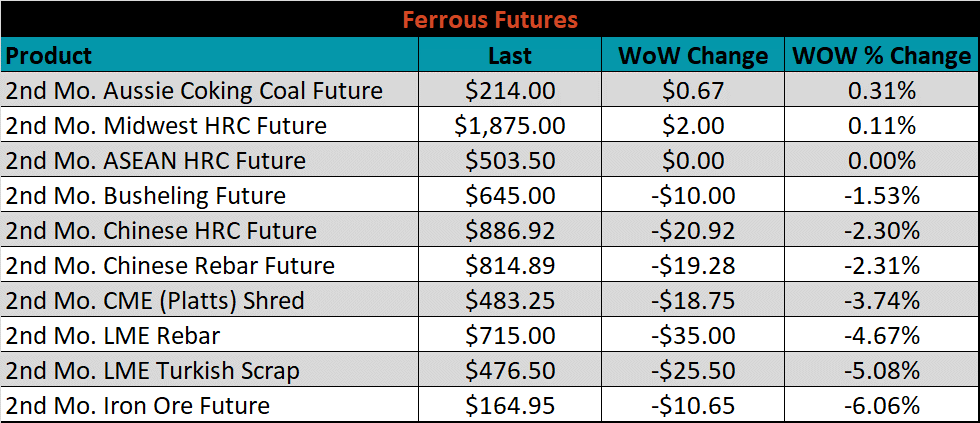
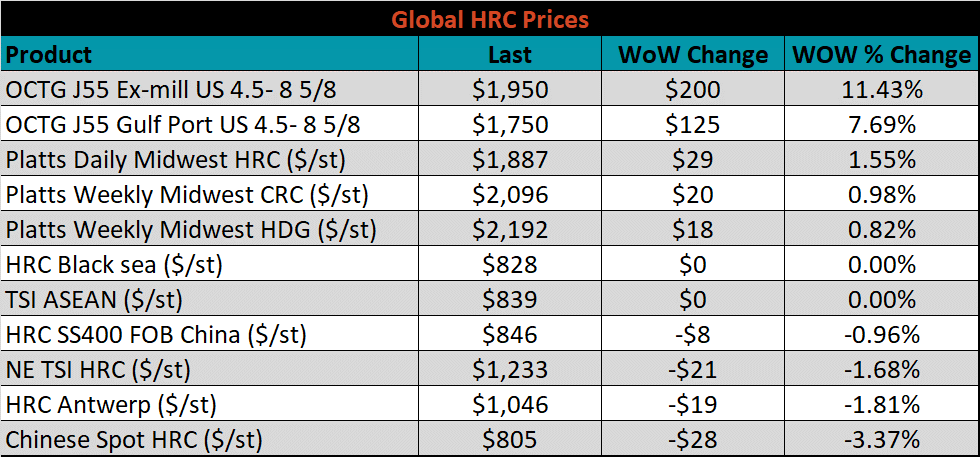
Global flat rolled indexes were mixed. The TSI Platts Midwest HRC price was up 1.6%, while the Chinese spot HRC price was down 3.4%.
The AISI Capacity Utilization rate increased 0.4% to 85%. This is the highest rate in the last 10 years. Further increases to pricing as production and utilization surpass pre-pandemic levels suggest that demand for steel remains above current production levels.

AISI Steel Capacity Utilization Rate (orange) and Platts TSI Daily Midwest HRC Index (white)

Imports & Differentials
July flat rolled import license data is forecasting a decrease of 76k to 917k MoM.
All Sheet Imports (white) w/ 3-Mo. (green) & 12-Mo. Moving Average (red)

Tube imports license data is forecasting a decrease of 30k to 357k in July.
All Tube Imports (white) w/ 3-Mo. (green) & 12-Mo. Moving Average (red)

All Sheet plus Tube (white) w/ 3-Mo. (green) & 12-Mo. Moving Average (red)

July AZ/AL import license data is forecasting an increase of 30k to 106k.
Galvalume Imports (white) w/ 3 Mo. (green) & 12 Mo. Moving Average (red)

Below is July import license data through August 2nd, 2021.

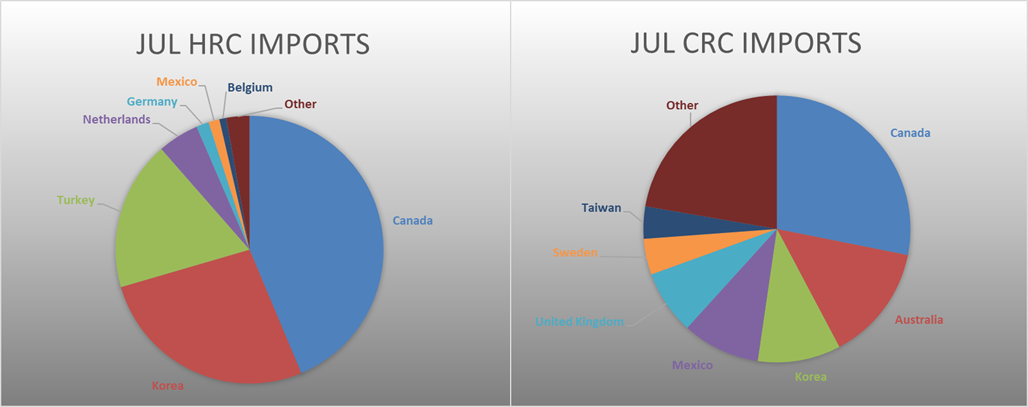

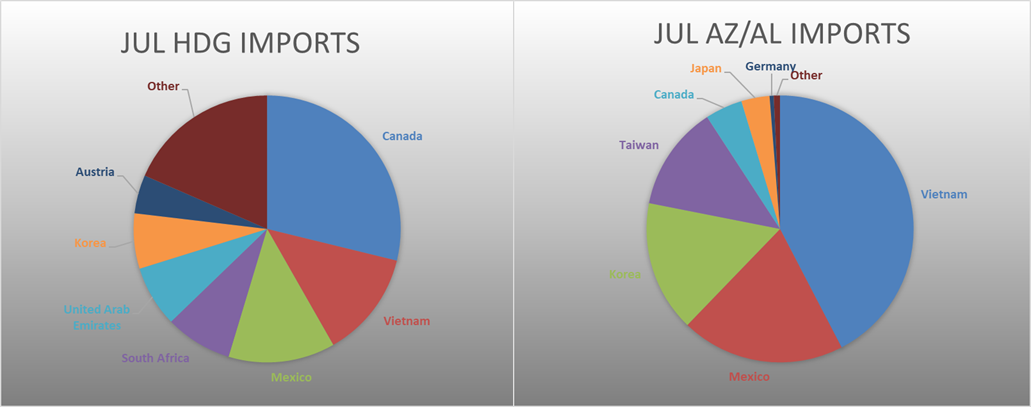
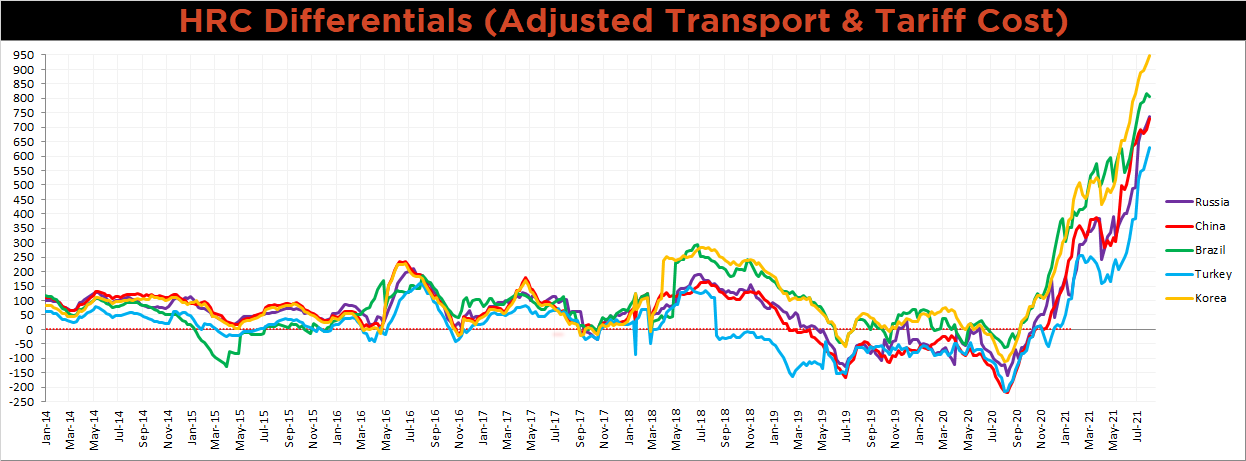
Below is the Midwest HRC price vs. each listed country’s export price using pricing from SBB Platts. We have adjusted each export price to include any tariff or transportation cost to get a comparable delivered price. Differentials for all watched countries increased further, except for Brazil, who saw their export price increase more significantly than the U.S. domestic price.
SBB Platt’s HRC, CRC and HDG pricing is below. The Midwest HRC, CRC, & HDG prices were up, 1.6%, 1% and 0.8%, respectively. Globally, the Chinese export CRC price was up 10.4%.


Raw Materials
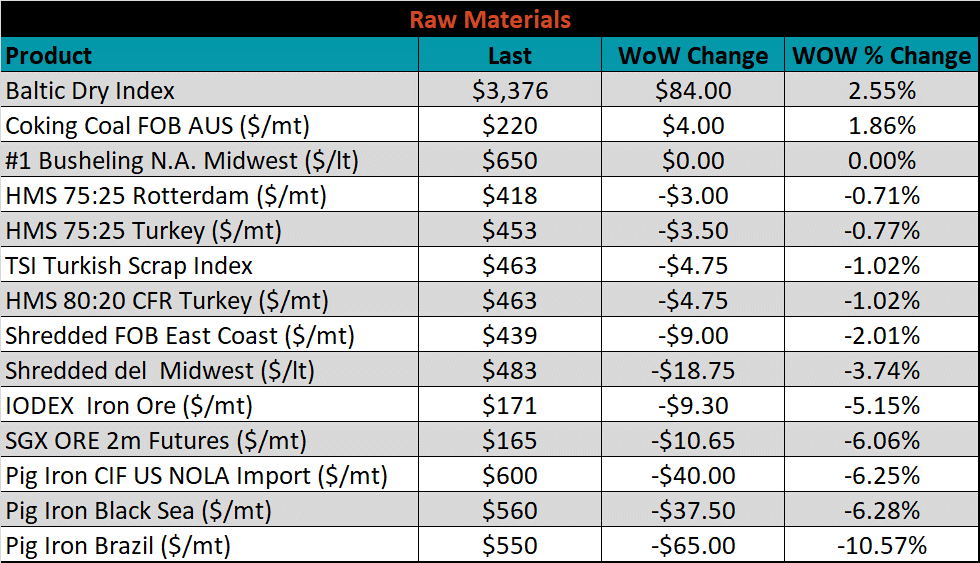
Raw material prices were mixed, Brazilian pig iron was down 10.6%, while Aussie coking coal rose 1.8%.
Below is the iron ore future curve with Friday’s settlements in orange, and the prior week’s settlements in green. Last week, the entire curve continued it’s 3 week decline and shifted dramatically lower.
SGX Iron Ore Futures Curve

The ex-flat rolled prices are listed below.


Energy
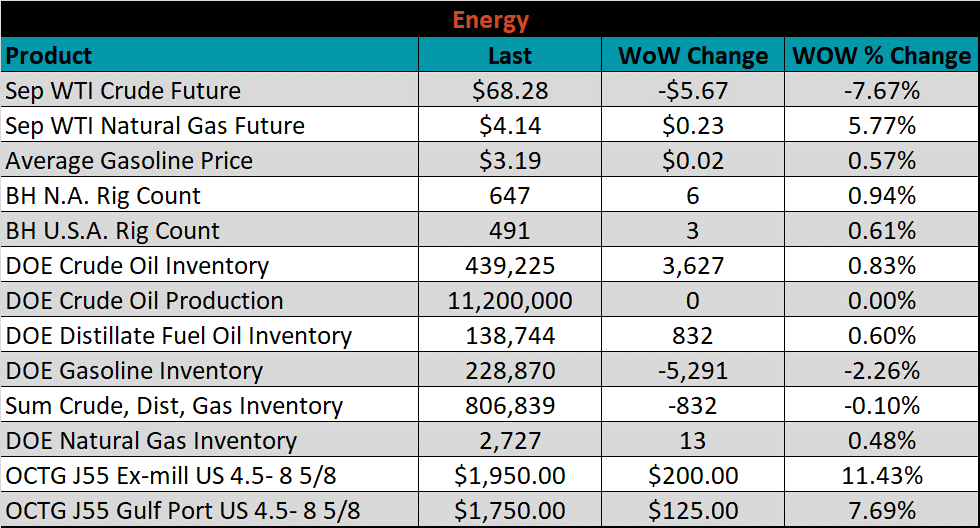
Last week, the September WTI crude oil future was down $5.67 or 7.67% to $68.28/bbl. The aggregate inventory level was down 0.1%, while crude oil production remains at 11.2m bbl/day. The Baker Hughes North American rig count was up 6 rigs, and the U.S. rig count was up 3 rigs.
September WTI Crude Oil Futures (orange) vs. Aggregate Energy Inventory (white)

Front Month WTI Crude Oil Future (orange) and Baker Hughes N.A. Rig Count (white)


The list below details some upside and downside risks relevant to the steel industry. The orange ones are occurring or look to be highly likely. The upside risks look to be in control.
Upside Risks:
- Higher share of discretionary income allocated to goods from steel intensive industries
- Changes in China’s policies regarding ferrous markets, including production cuts and imports
- Strengthening global flat rolled and raw material prices
- Unplanned & extended planned outages, including operational issues leaving mills behind
- Declining/low inventory levels at end users and service centers
- Broad increases in commodity prices due to a weakening US Dollar
- Limited spot transactions skewing market indexes to extreme levels
- Chinese economic stimulus measures
- Fiscal policy measures including a new stimulus and/or infrastructure package
- Low interest rates
- China strict steel capacity cuts
- Energy industry rebound
- Unexpected inflation
- Further section 232 tariffs and quotas restricting supply
Downside Risks:
- Increased domestic production capacity
- Increasing price differentials and hedging opportunities leading to higher imports
- Steel consumers substitute to lower cost alternatives
- Steel buyers and consumers “double ordering” to more than cover steel needs
- Weak labor and construction markets
- Tightening credit markets, as elevated prices push total costs to credit caps
- Reduction and/or removal of domestic trade barriers
- Supply chain disruptions allowing producers to catch up on orders
- Political & geopolitical uncertainty
- Weak global economics/PMIs
- Trade slowdown in China due to tensions with US, Hong Kong, and others
- Domestic automotive industry under pressure
- Chinese restrictions in property market
- The Chinese Financial Crisis
- Unexpected sharp China RMB devaluation

