Content
-
Weekly Highlights
- Market Commentary
- ISM PMI
- Global PMI
- Construction Spending
- Auto Sales
- Risks


After 8 weeks of declines, spot HRC prices moved sideways last week with repeatable physical transactions bottoming near $440/st. Generally, and across both EAFs and BOFs, mills have lifted offer prices reflecting their desire to prevent prices from declining further. However, with spot indexes still in the mid to low $400s, buyers would much rather take their maximum amount of contract tons at discounted prices rather than paying the new, higher spot offers. Therefore, in order for prices to move higher from the current level, steel consumers will have to consume more than their contracted material, forcing them to the spot market to complete their needed purchases. To try to gauge this demand returning to the steel market, we will dive into last week’s release of the July ISM Manufacturing PMI report.
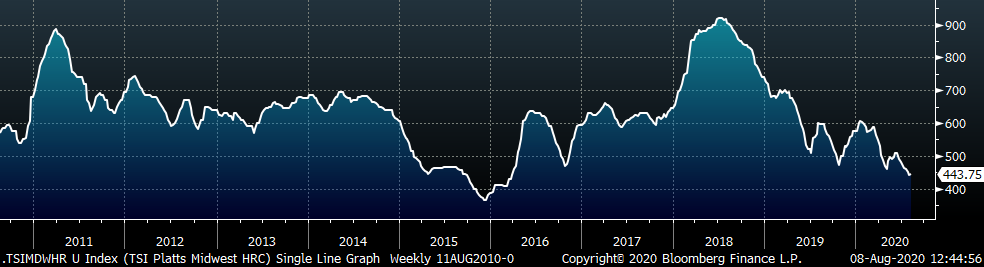
The below chart shows the relationship between the Platts Midwest HRC index and the ISM Manufacturing PMI over the past 9 years.
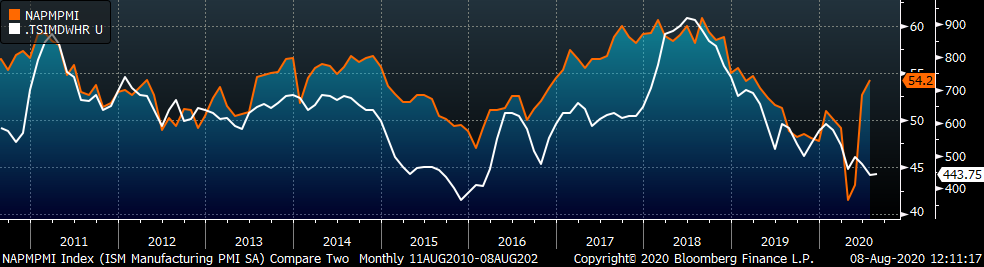
Historically, the Midwest HRC price trends in the same direction as the manufacturing PMI, especially over long timeframes. Since the PMI bottomed in the spring due to the coronavirus pandemic, the two have diverged with the PMI recovering and spot HRC prices remaining depressed. A rally in the HRC prices seems to be the logical resolution, but two subtle components of the PMI index may lead to another conclusion. First, the index is constructed through surveying manufacturing purchasing managers on specific components of their business compared to the previous month. A growing or expanding index (above 50) reflects month over month growth, rather than high levels of consumption and demand. Due to the low levels of economic activity during the economic shutdowns over the past few months, month over month expansion does not signal that the manufacturing sector is back to “normal”. Second, the index gauges sentiment of manufacturers in 18 sub-sectors, where Metal Products are only one component. Other large sub-sectors are Computer and Electronic Products, Food, Beverage and Tobacco Products, Chemical Products and Transportation Equipment. These sectors have performed much better throughout the shutdown and recovery as the post-pandemic economy looks very different from before. Here is a quote from one the July report respondents from the Fabricated Metal Products sub-sector:
“While demand in [the] coming six months is stabilizing, it is at a significant reduction and clear [that] customers have little confidence in the forecasts.”
This commentary does not necessarily match the optimism in the headline index, leading us to be more cautious in our price outlook. With that said, upside risks continued to build this week as the expectation is for August to be the near term bottom in scrap pricing. Should lead times push out from here, it will confirm that mills order books are strong enough to support higher prices and allow the ferrous metals industry to join the manufacturing recovery.
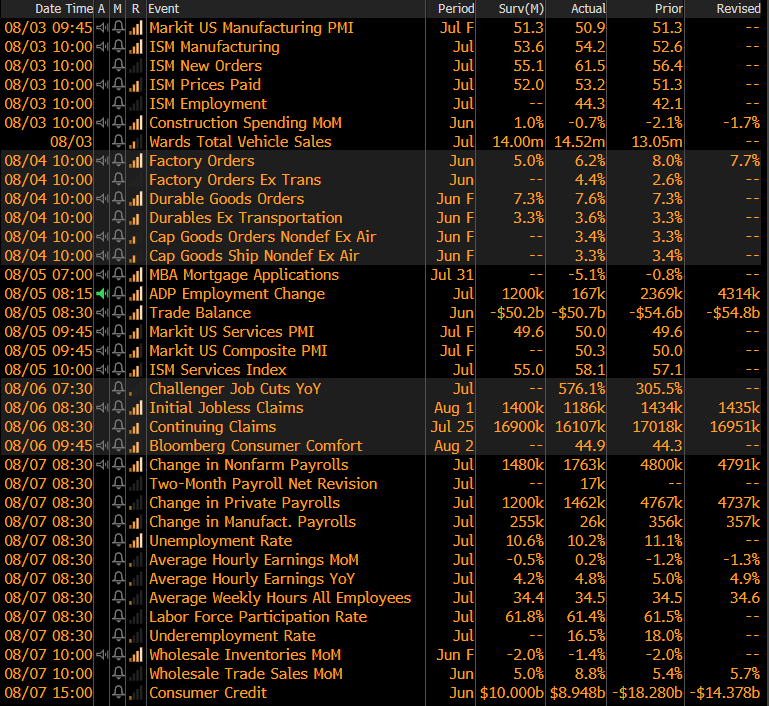
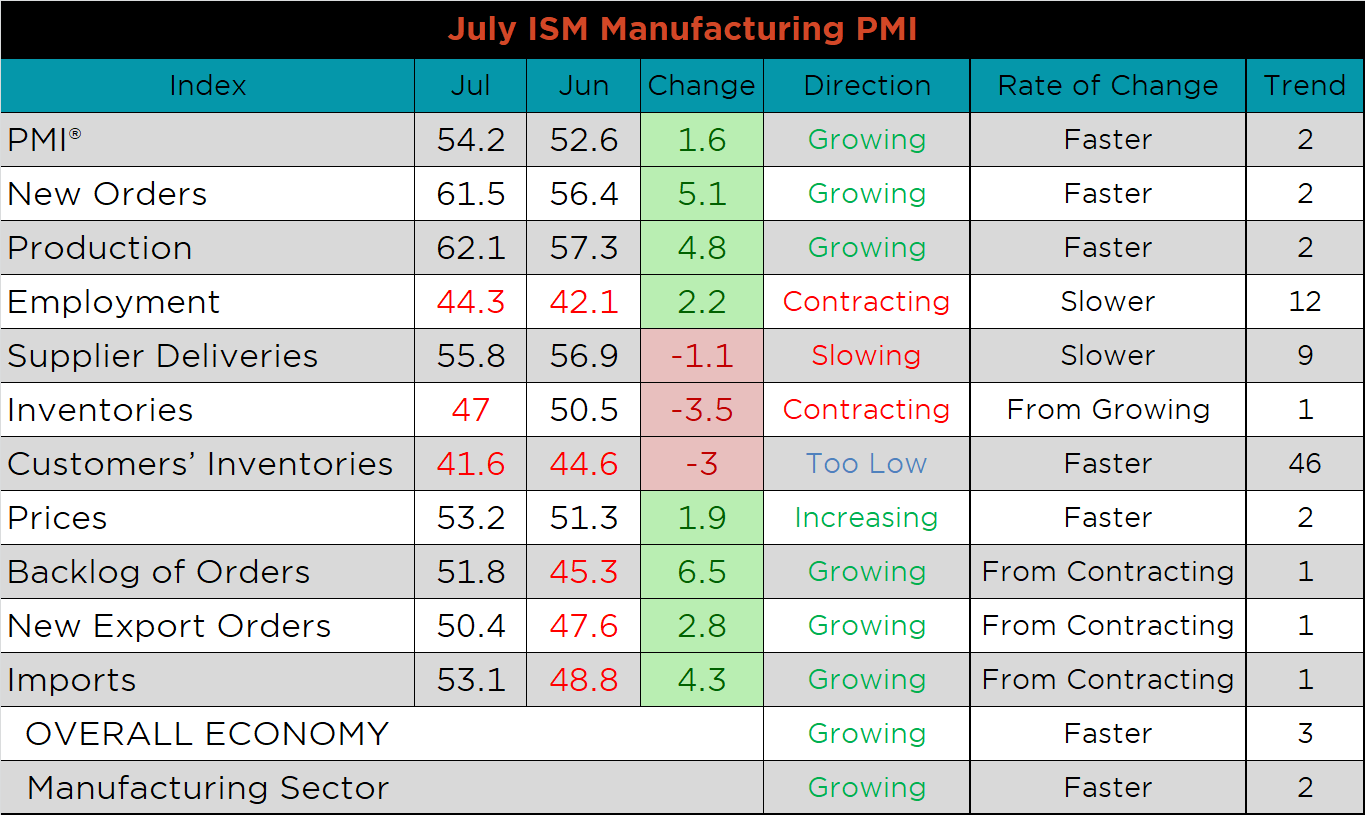
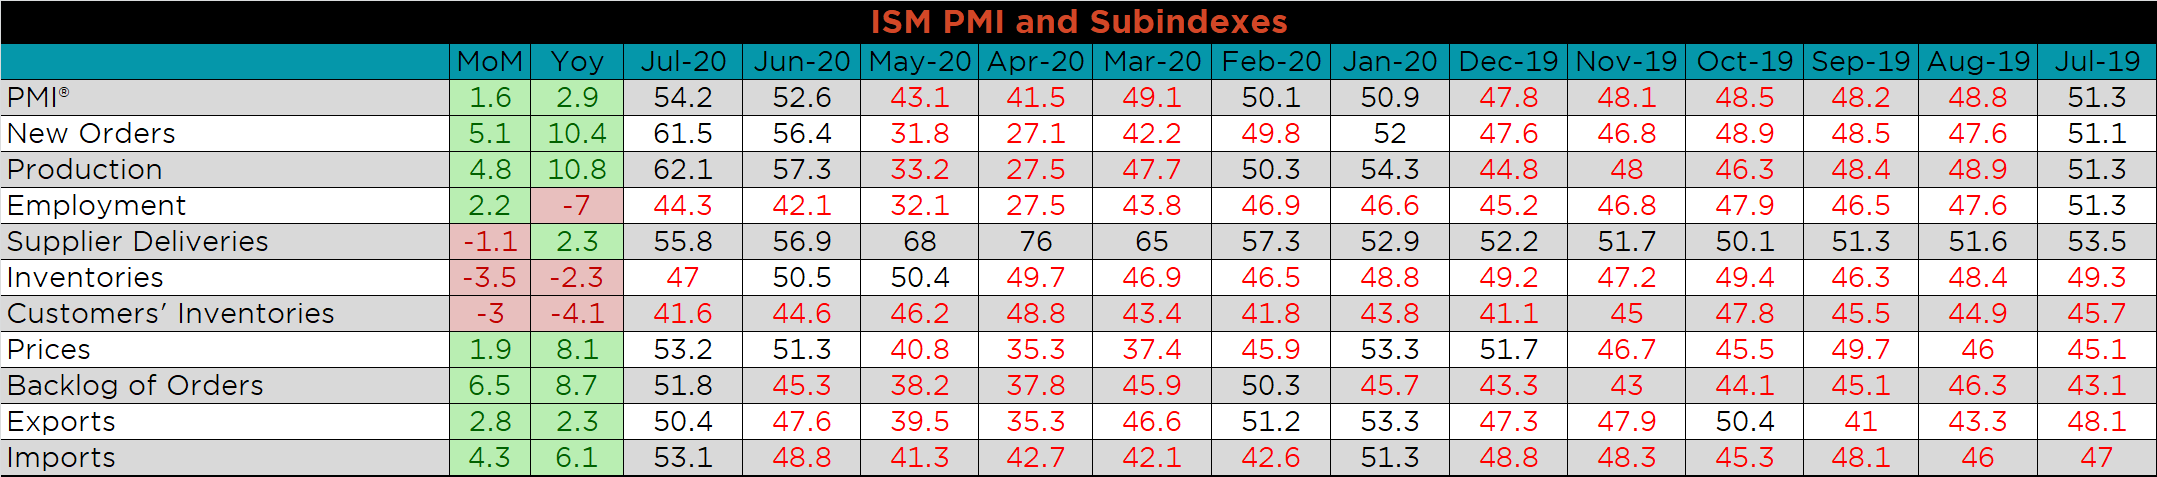
The July ISM Manufacturing PMI and subindexes are below. The topline PMI number was up another 1.6 points to 54.2, moving further into expansion.
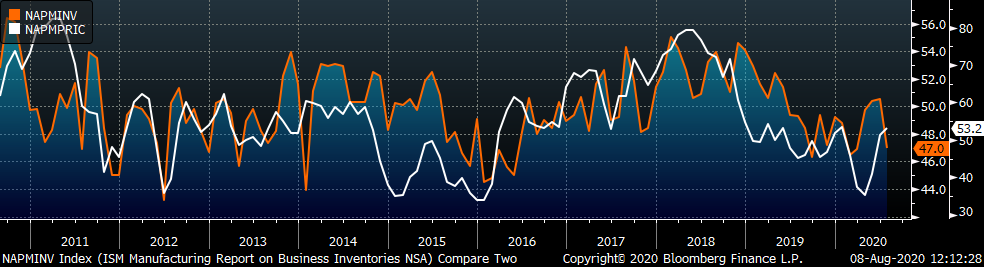
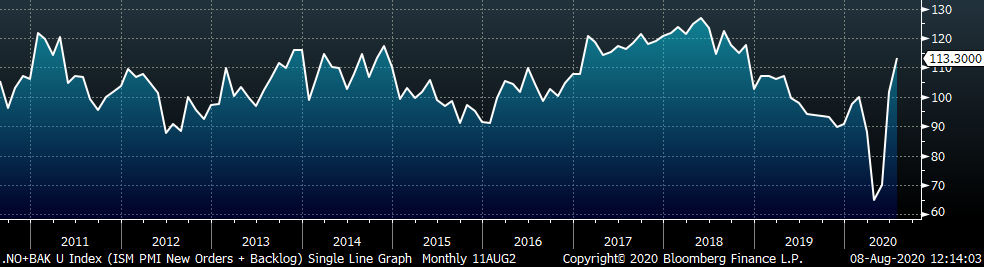
The chart below compares the ISM prices subindex with the ISM customer inventories subindex. Customers have been able to work through existing inventories as prices have recovered. The second chart shows the new orders plus backlog sub-indexes. The backlog and new orders were the two strongest subindexes in this month’s report, up 6.5 and 5.1 points, respectively. The final chart shows the supplier deliveries subindex continuing to fall, indicating easing shipping availability, more in line with the historical average.
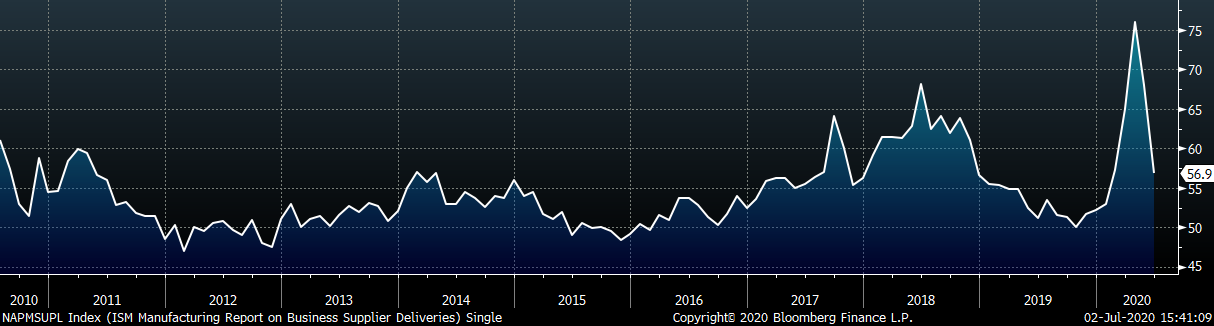
This month, most subindexes were higher MoM, with the exception of supplier deliveries and inventories. The backlog, new orders and production remain among the strongest readings, suggesting increasing demand. The employment subindex continues to lag amid uncertainty, and the inventory subindex joined the customer inventory subindex in contraction.
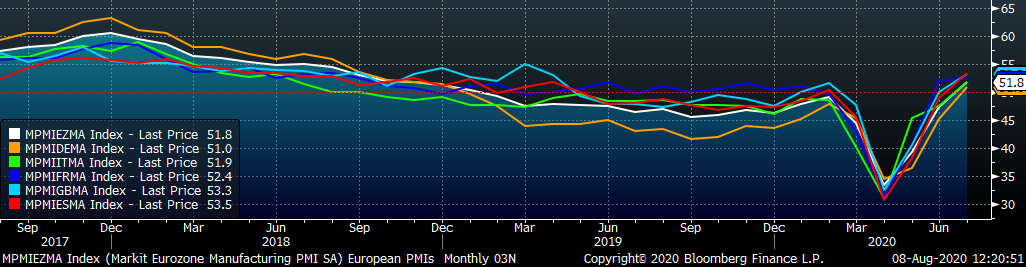
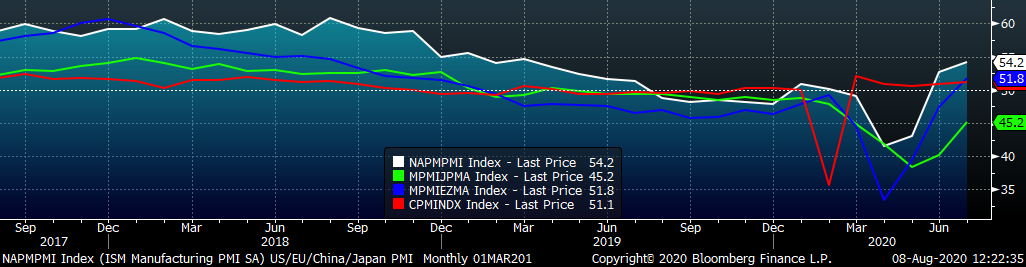
July’s global PMI printings show increases MoM for all countries except Vietnam, India and Russia. Germany and the Eurozone moved into expansion, making it the first time for Germany entered expansion territory since December 2018. Japan’s PMI increased as well, but remains in contraction, printing at 45.2.
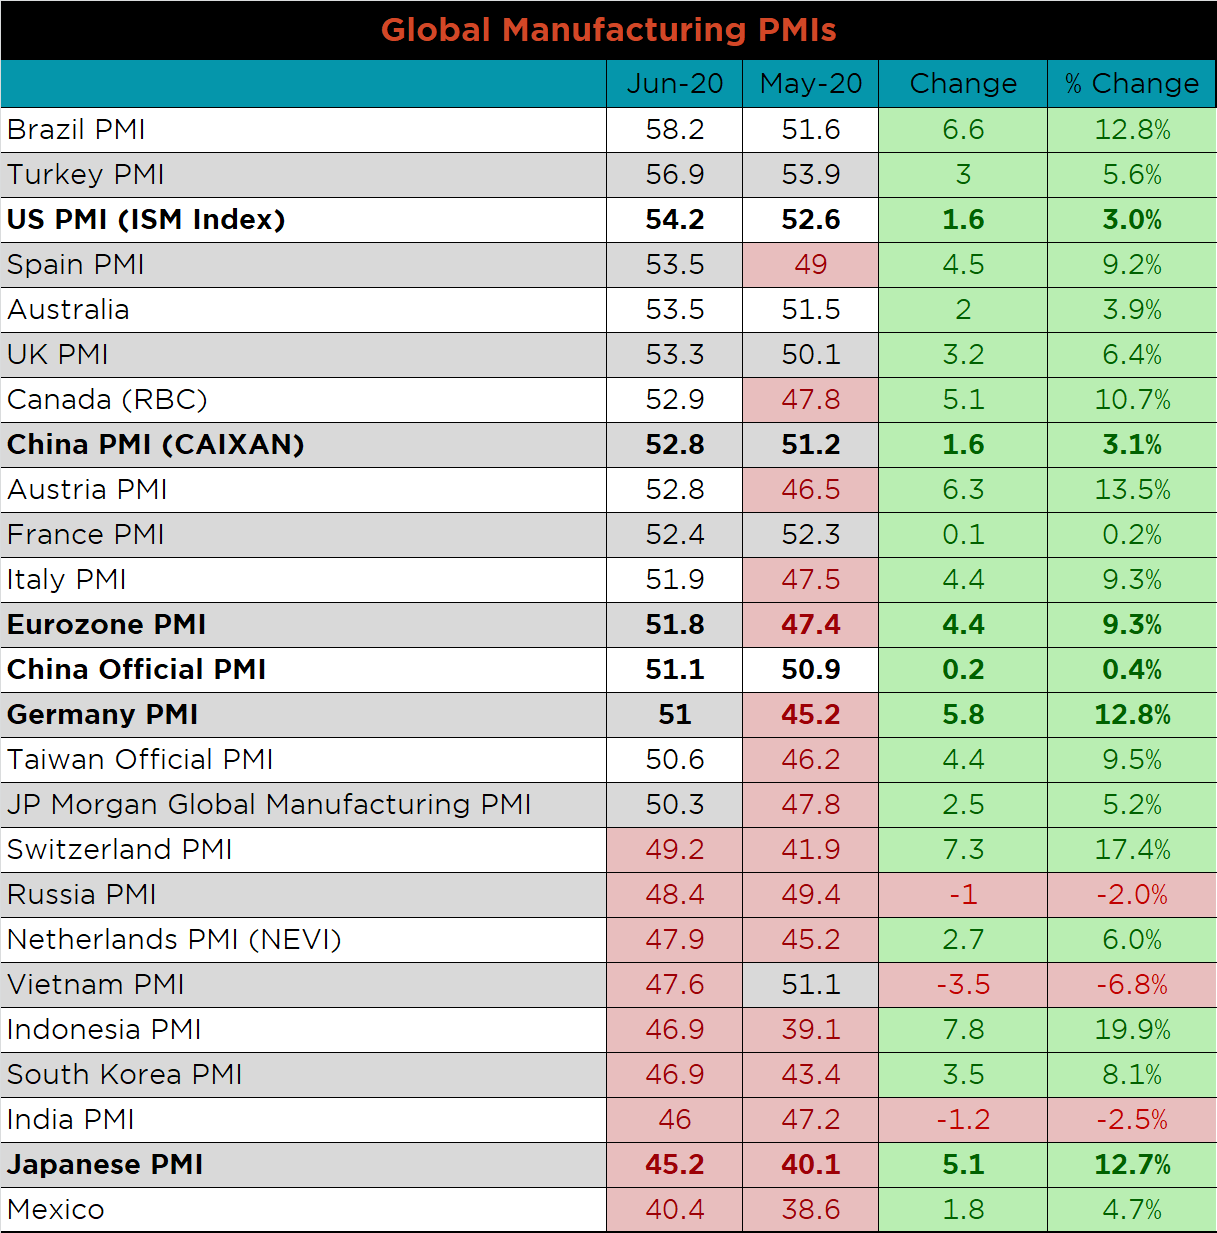
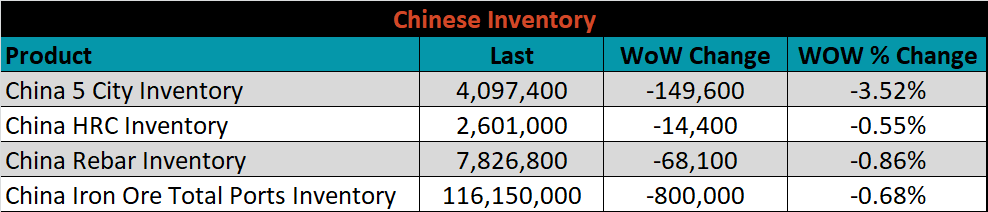
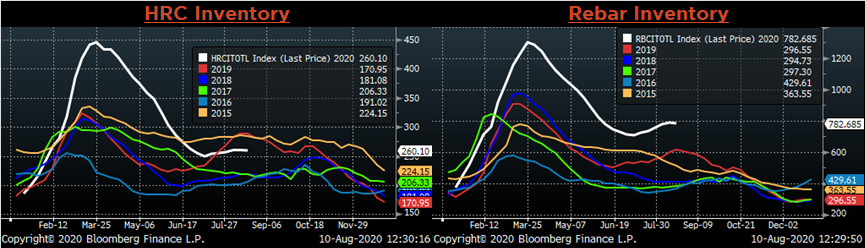
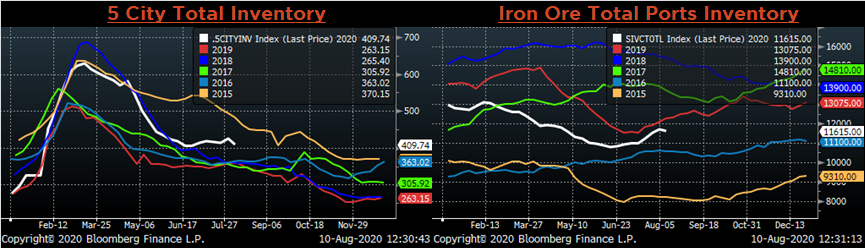
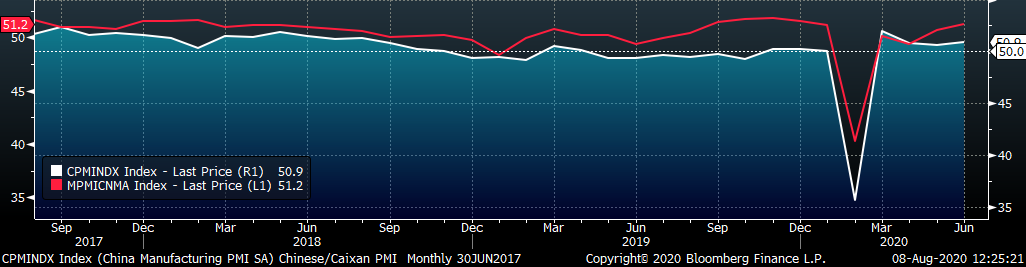
Both China’s official and the Caixan Manufacturing PMI printed higher and further into expansion.
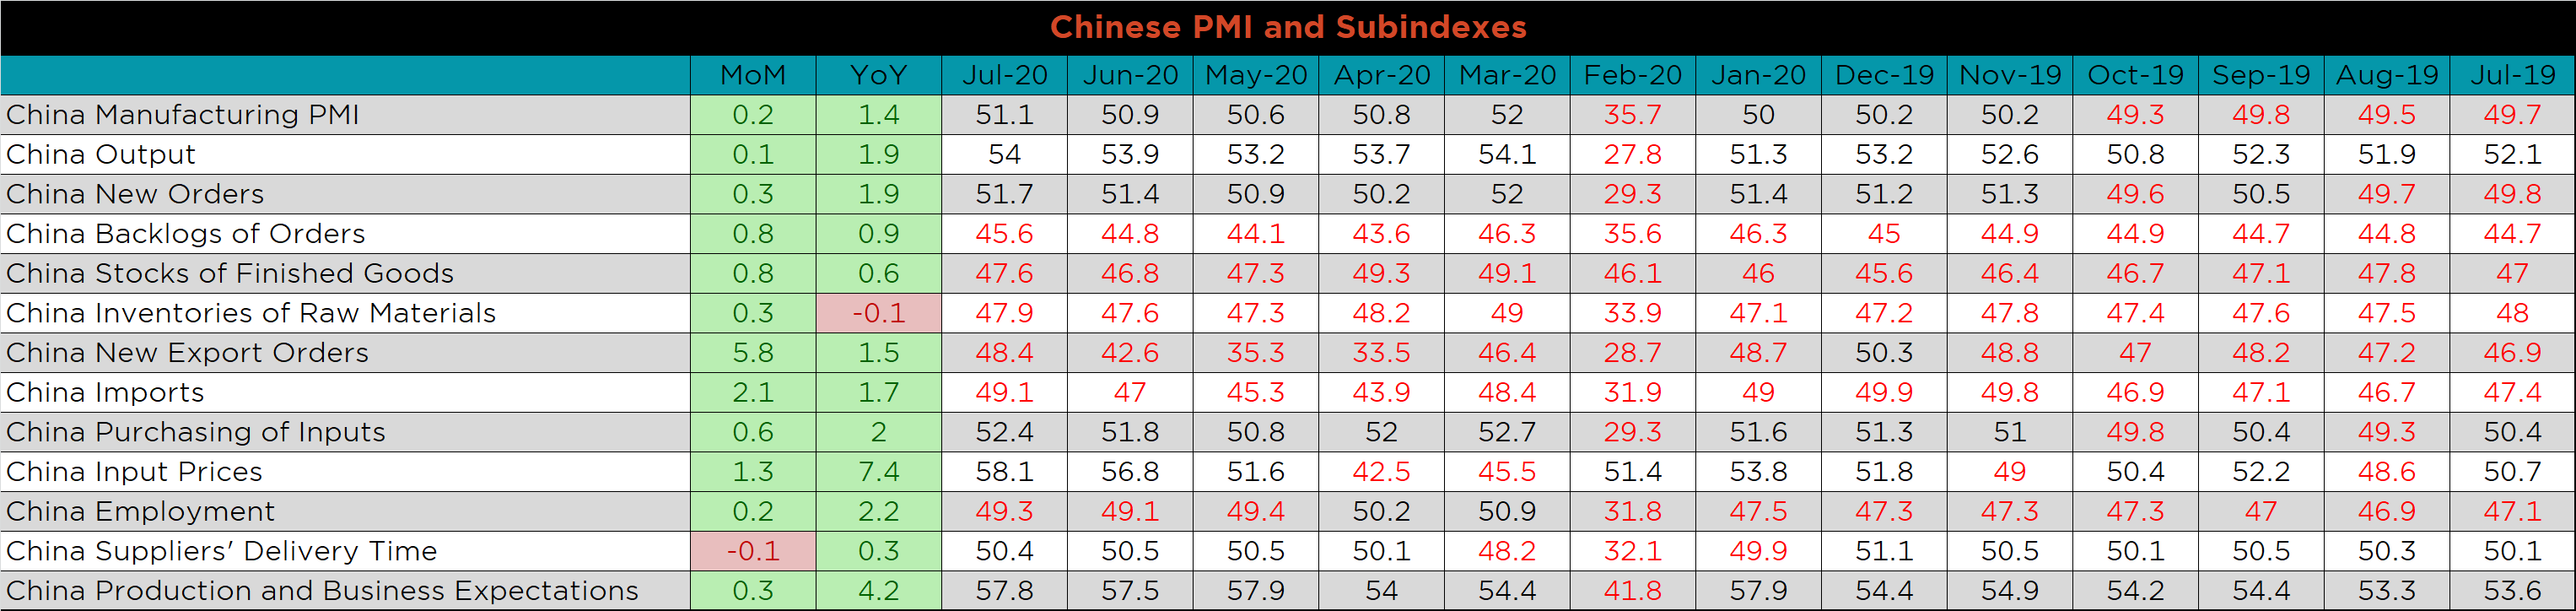
The table below breaks down China’s official manufacturing PMI subindexes. Export orders saw the largest increase again in July, but remain in contraction, while most other subindexes continue to show stable growth MoM, and YoY.
June seasonally adjusted U.S. construction spending was down another 0.7% compared to May, while 0.1% higher than June 2019.
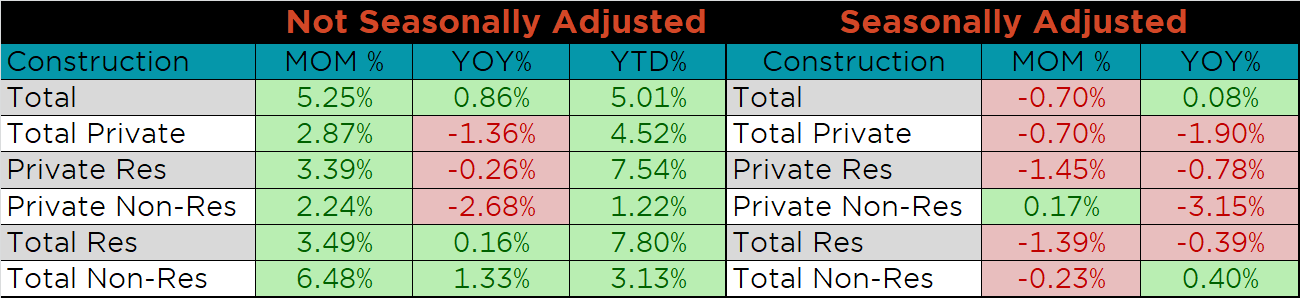
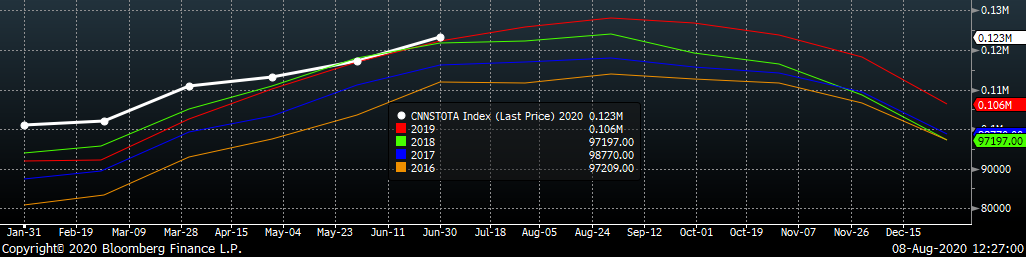
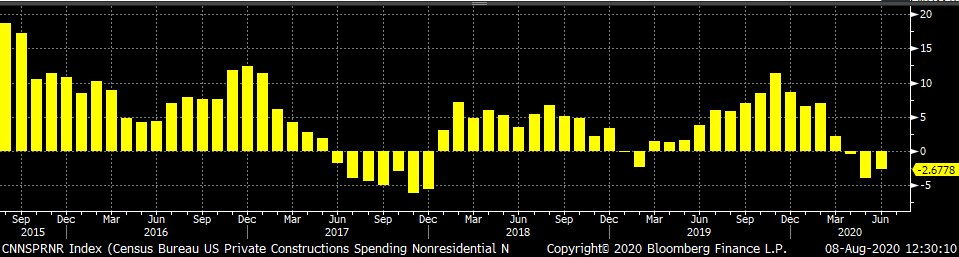
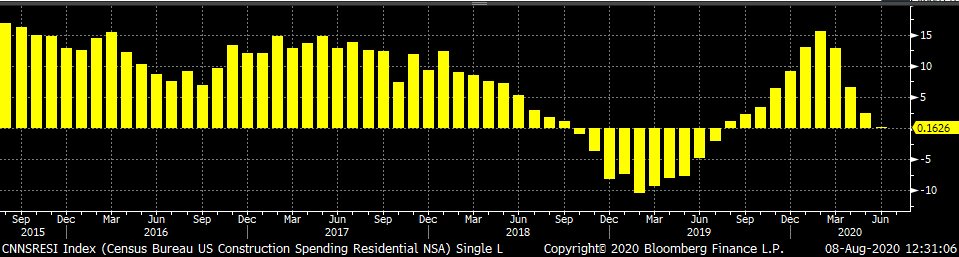
The white line in the chart below represents construction spending in 2020 and compares it to the spending of the previous 4 years. Overall, spending levels in June moved back above last year’s level after falling below for first time after 11 months of YoY spending growth. The last two charts show the YoY changes in construction spending. Private non-residential spending decreased for the third month in a row. Residential spending remains just barely above the June 2019 spending level.
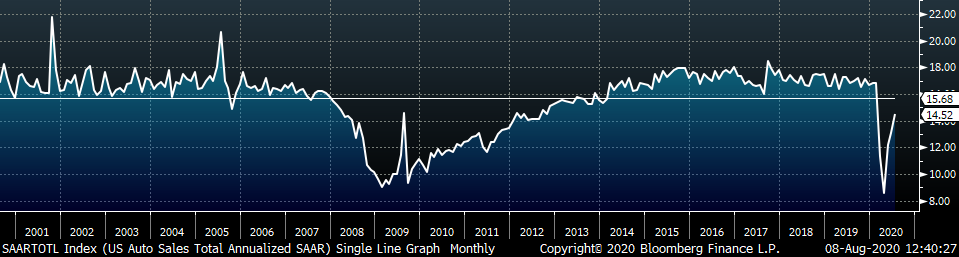
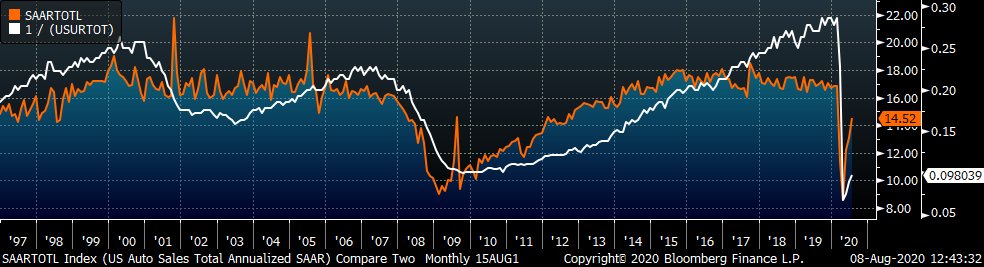
July U.S. light vehicle sales increased further to a 14.5m seasonally adjusted annualized rate (S.A.A.R). After falling below the low point of 2009, sales have rapidly increased, while remaining below the 20-year average. The second chart shows the relationship between the unemployment rate and auto sales. The unemployment rate is inverted to show that declining unemployment typically leads to increasing auto sales. While both are moving in directions that suggest economic improvement, auto sales continue to outpace the unemployment rate, which decreased in July.
Below are the most pertinent upside and downside price risks:
Upside Risks:
Downside Risks:
The Platts TSI Daily Midwest HRC Index was up $3.75 to $443.75, increasing for the first time in 8 weeks.
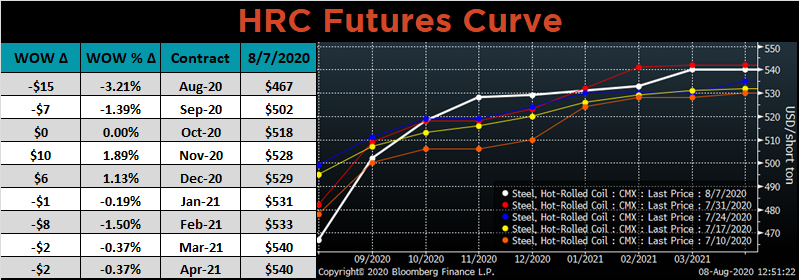
The CME Midwest HRC futures curve is below with last Friday’s settlements in white. Last week, the August expiration moved lower, while the back of the curve flattened around $530-540.
September ferrous futures were mixed. Iron ore gained 6.3%, while Platts shred lost 4.1%.
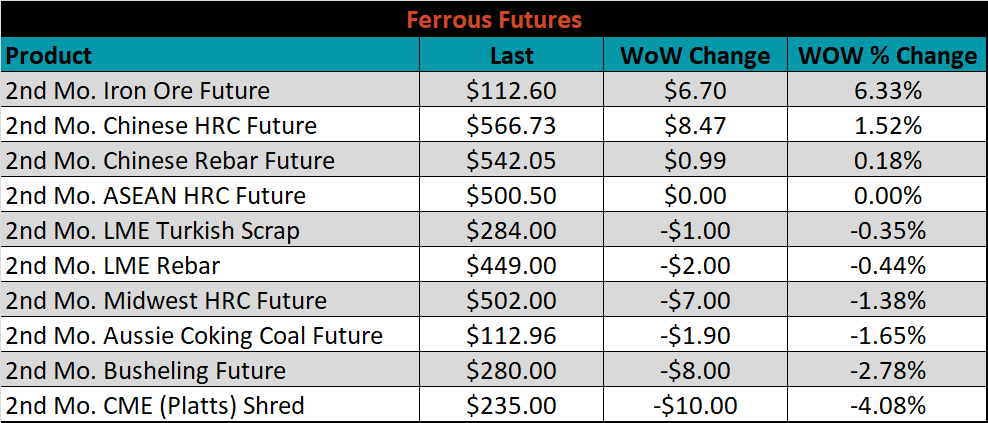
The global flat rolled indexes were flat or higher, led by TSI ASEAN, up 5.5%.

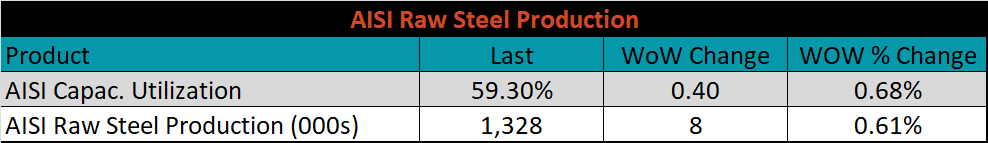
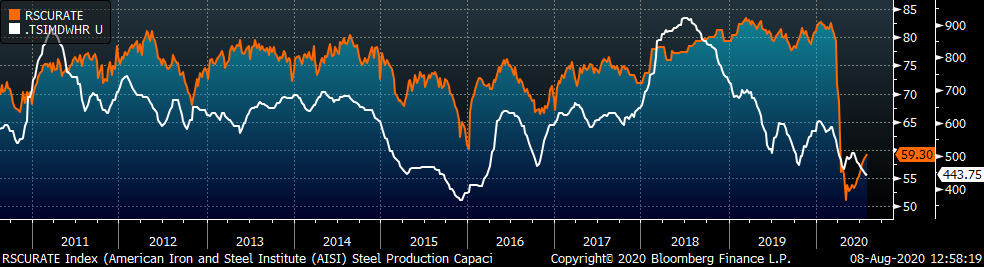
The AISI Capacity Utilization Rate was up another 0.4% to 59.3%.
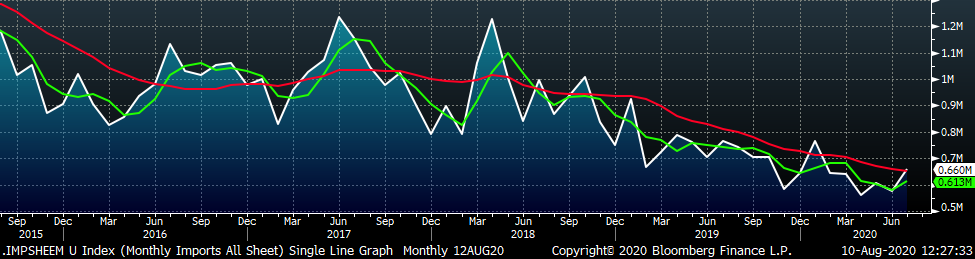
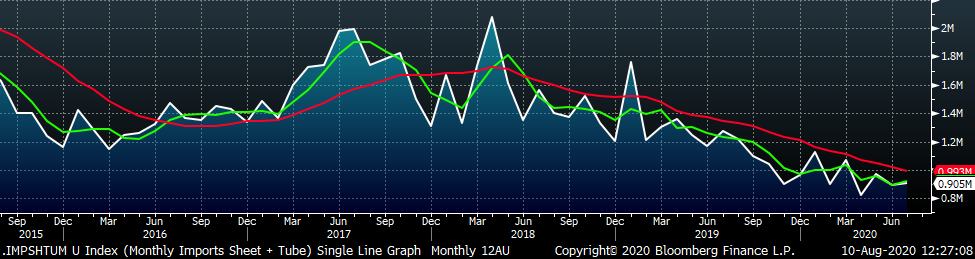
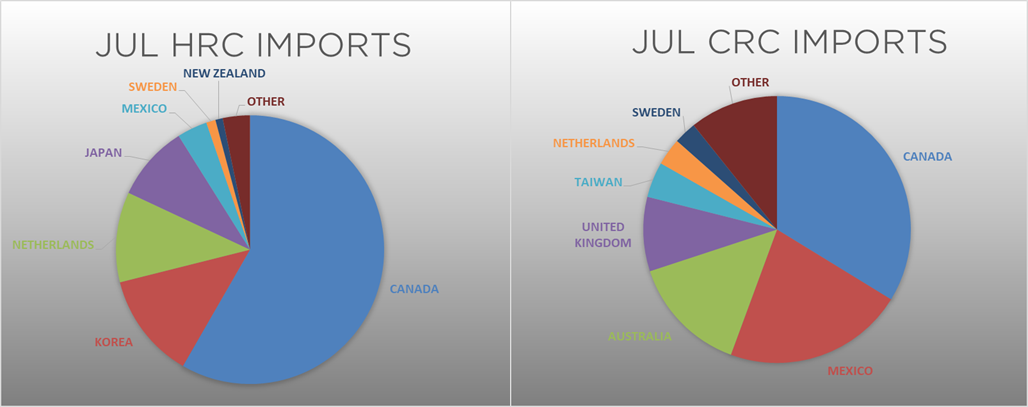
July flat rolled import license data is forecasting an increase of 86k to 660k MoM.
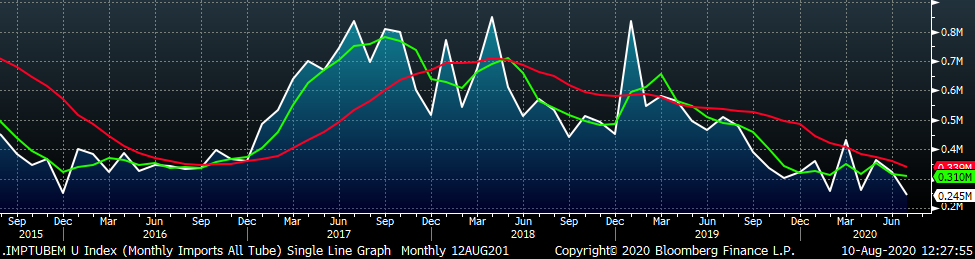
Tube imports license data is forecasting a MoM decrease of 78k to 245k tons in July.
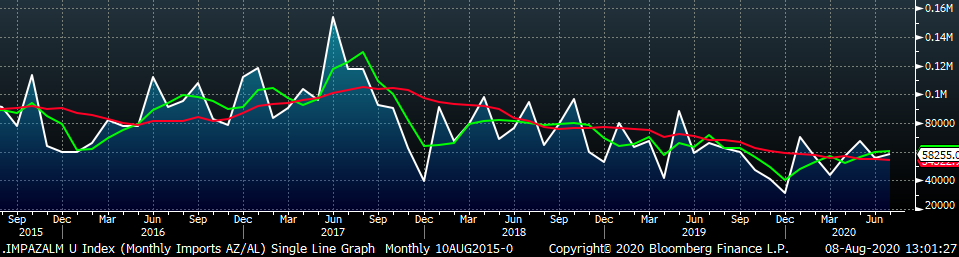
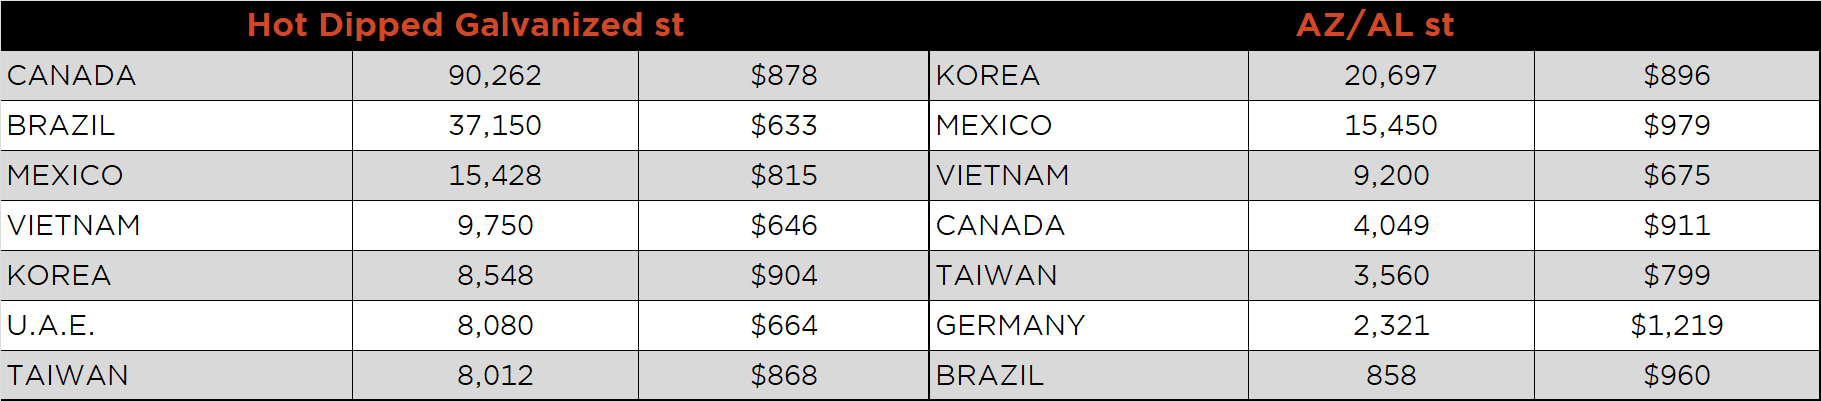
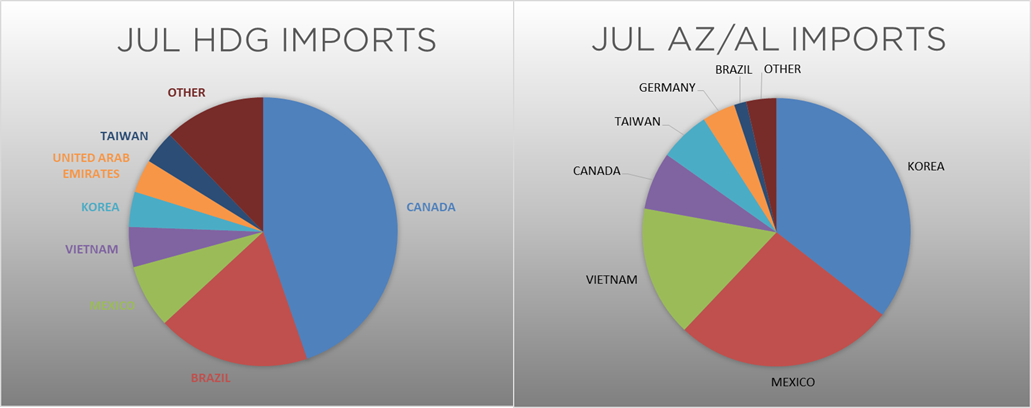
AZ/AL import license data is forecasting an increase of 3k to 58k MoM.
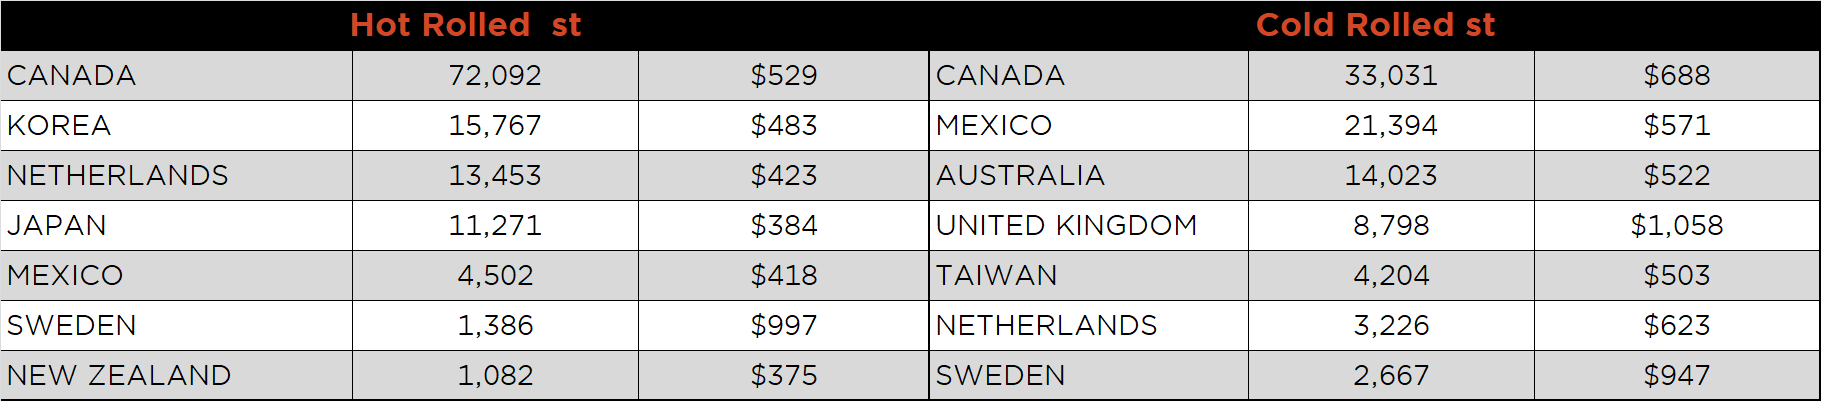
Below is July import license data through August 4, 2020.
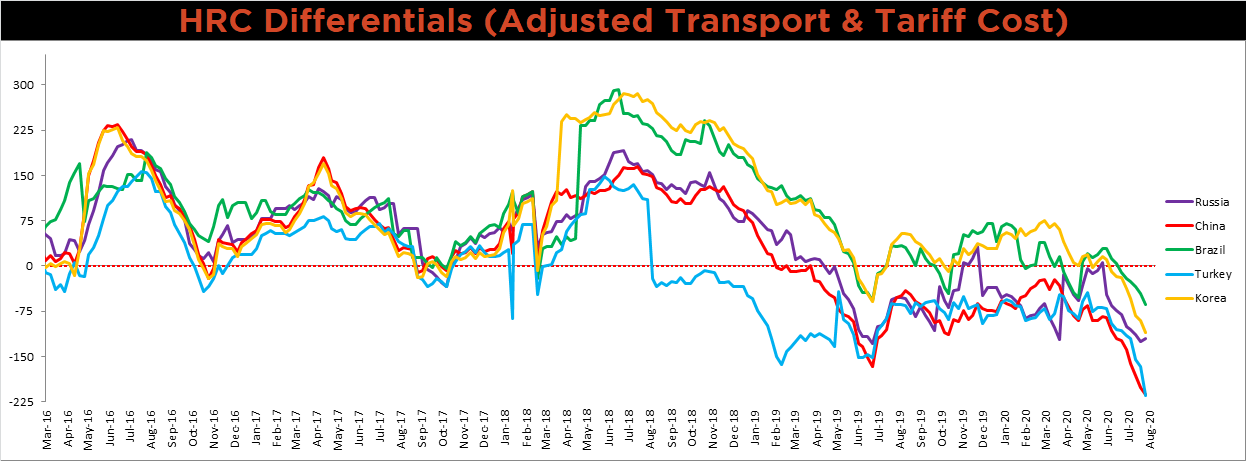
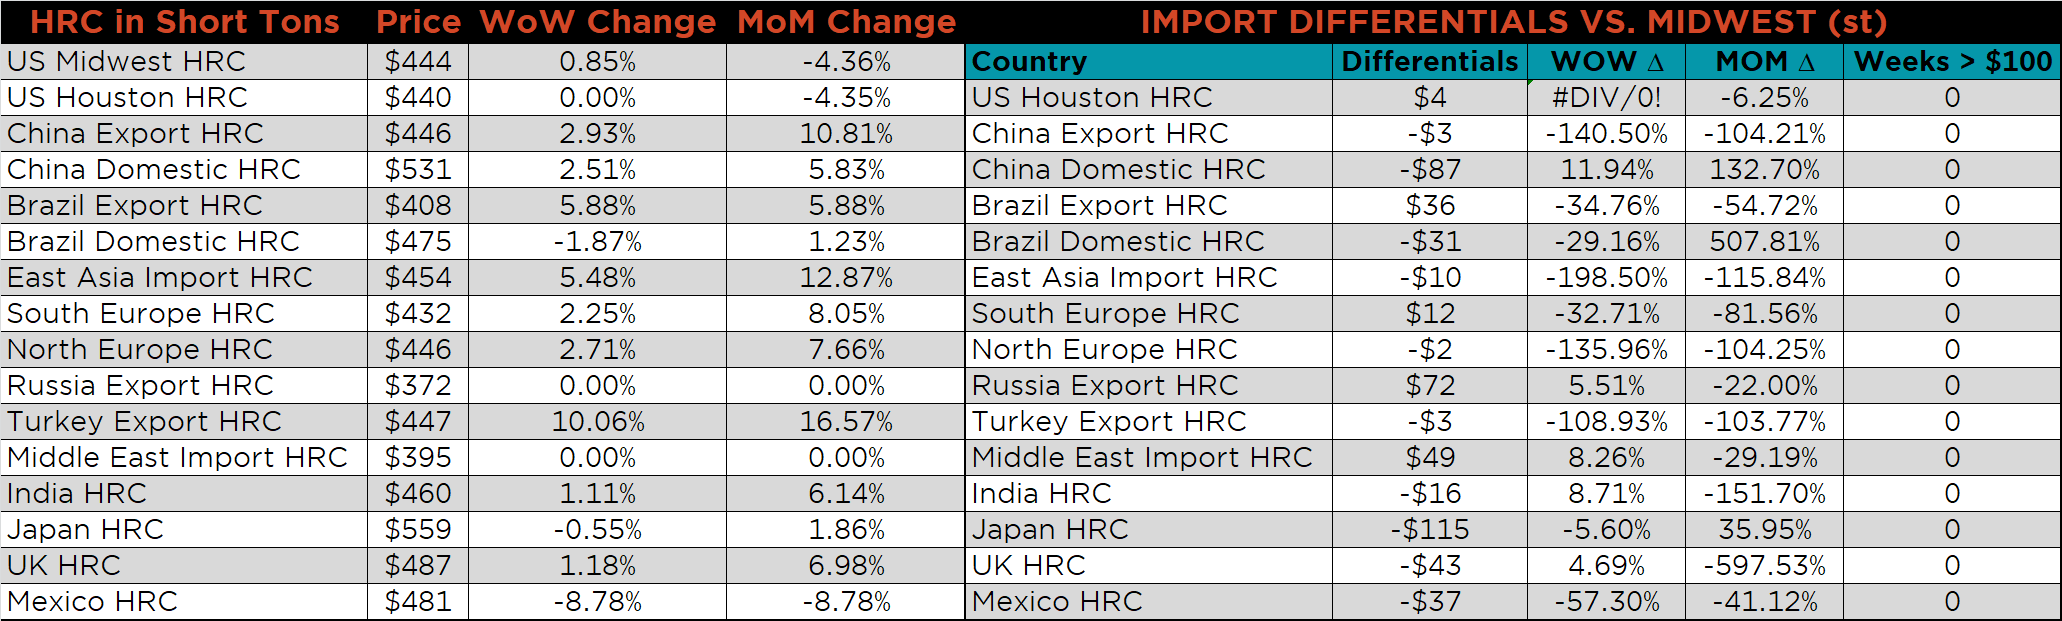
Below is the Midwest HRC price vs. each listed country’s export price using pricing from SBB Platts. We have adjusted each export price to include any tariff or transportation cost to get a comparable delivered price. The Chinese, Turkish, Korean and Brazilian differentials continue to decrease and are at their lowest levels in recent history. The Russian differential increased as the U.S. price inched higher and the Russian price was unchanged.
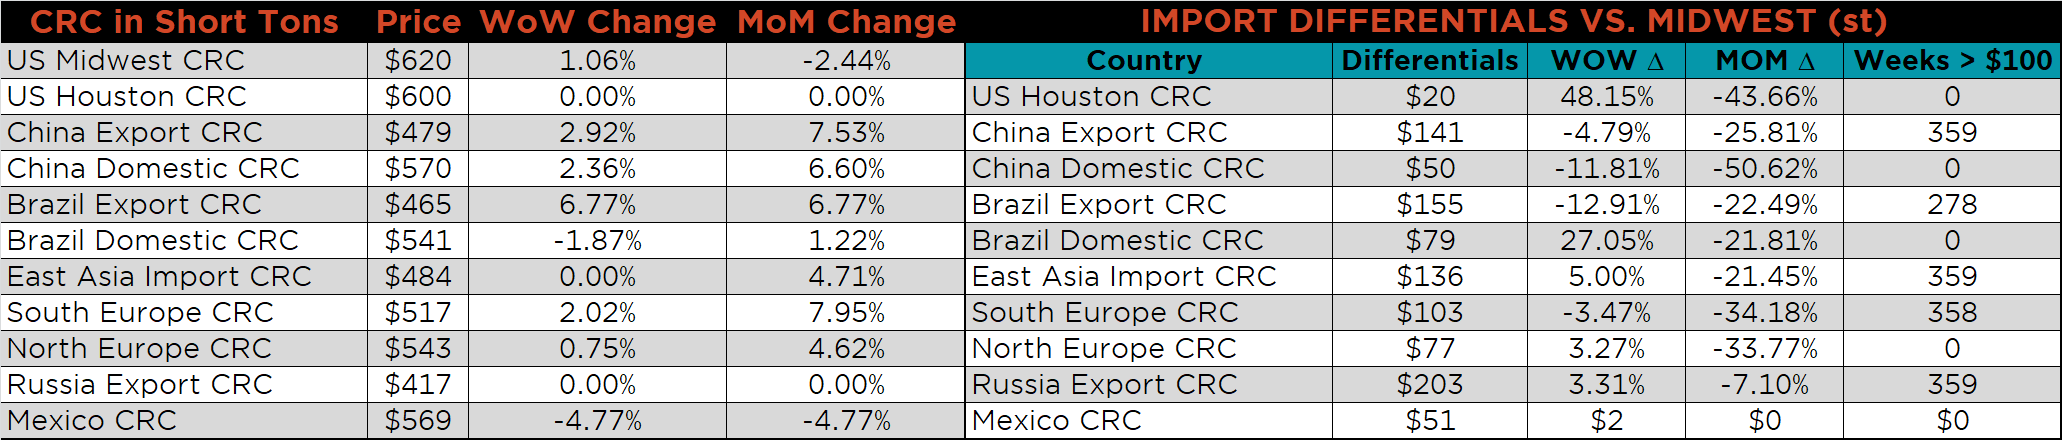
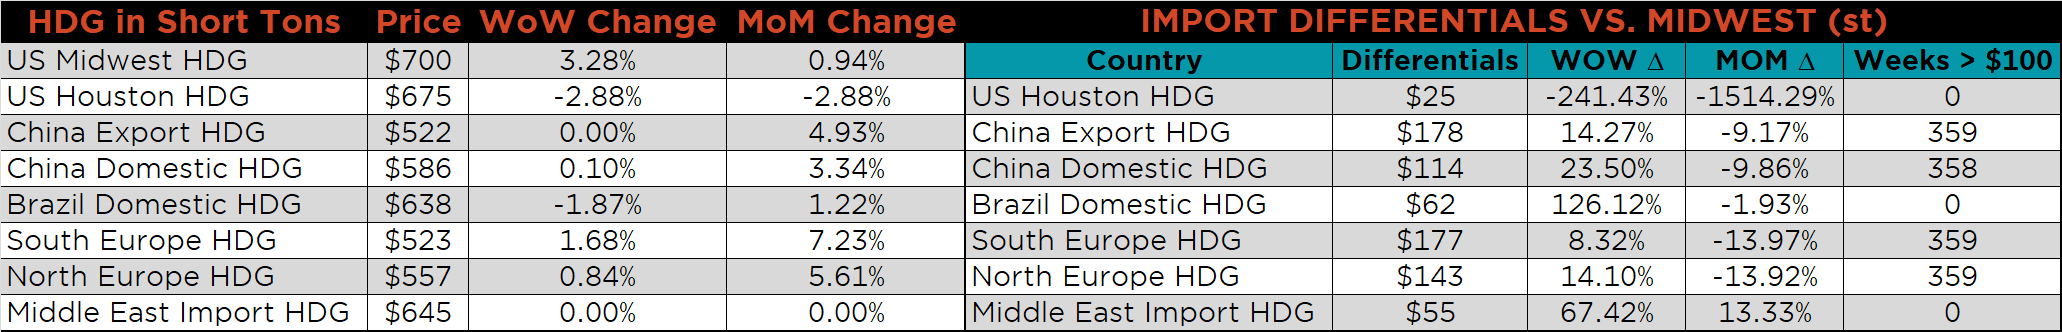
SBB Platt’s HRC, CRC and HDG pricing is below. The Midwest HDG, CRC, and HRC prices were up 3.3%, 1.1% and 0.9%, respectively. Globally, the Turkish export HRC price was up 10.1%.
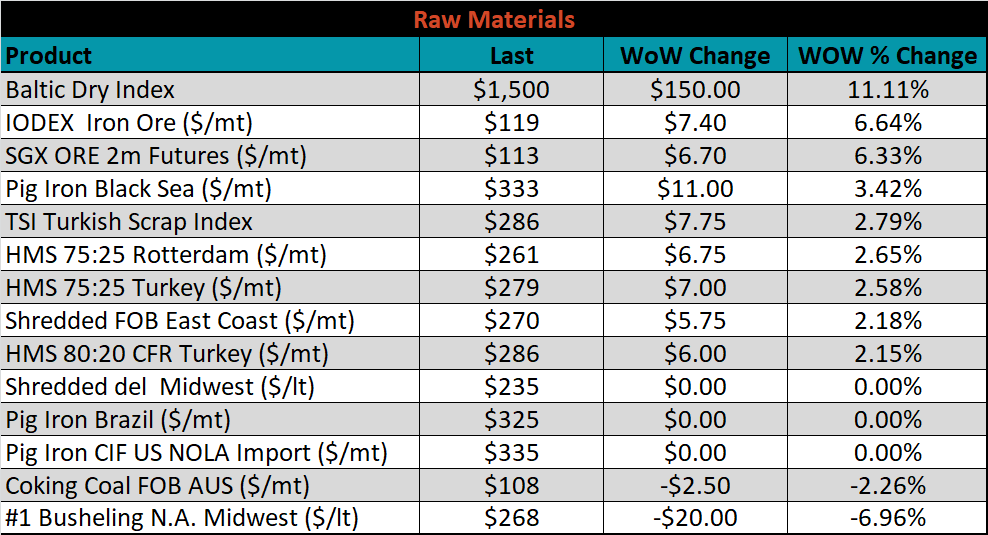
Raw material prices were mostly higher, led by the IODEX and iron ore futures, up 6.6% and 6.3%, respectively, while Midwest busheling was down 7%.
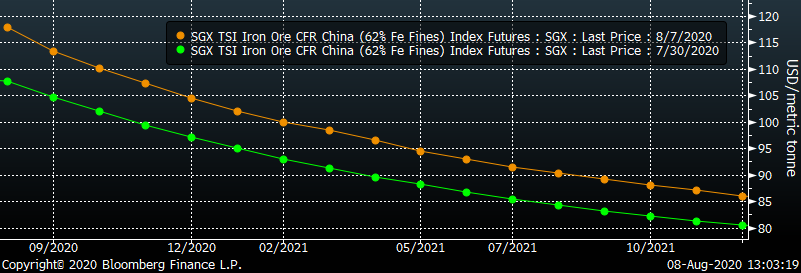
Below is the iron ore future curve with Friday’s settlements in orange, and the prior week’s settlements in green. The curve shifted significantly higher across all expirations.
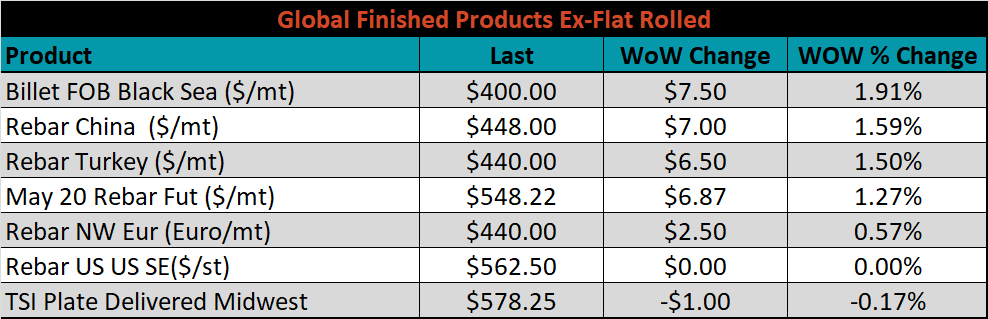
The ex-flat rolled prices are listed below.

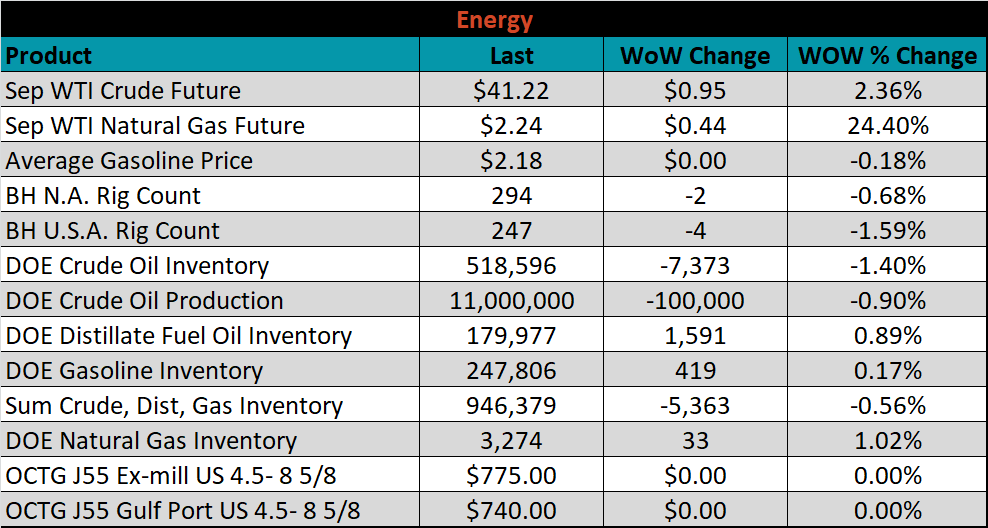
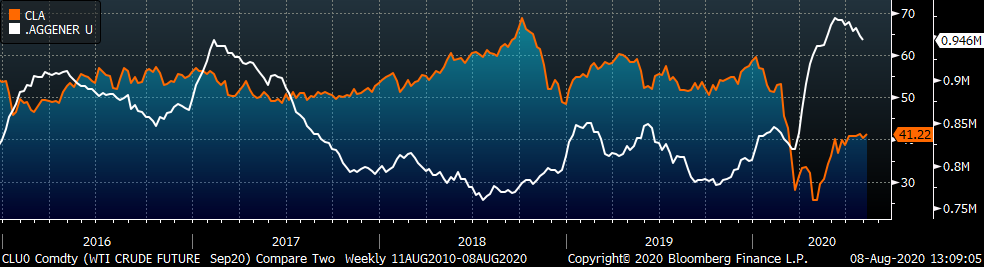
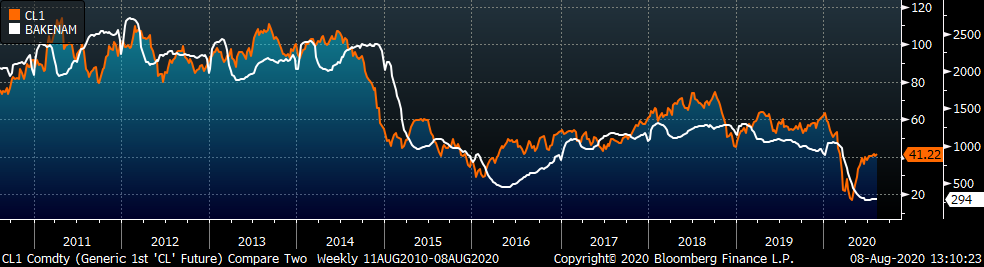
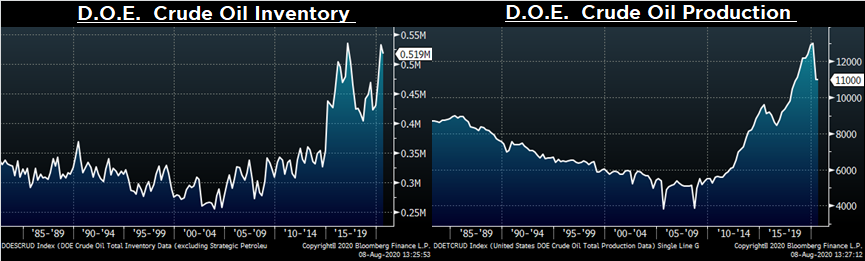
Last week, the September WTI crude oil future gained $0.95 or 2.4% to $41.22/bbl. The aggregate inventory level was down 0.6%, while crude oil production was down to 11m bbl/day. The Baker Hughes North American rig count was down two rigs and the U.S. rig count was down four.
The list below details some upside and downside risks relevant to the steel industry. The orange ones are occurring or look to be highly likely. The upside risks look to be in control.
Upside Risks:
Downside Risks: