Content
-
Weekly Highlights
- Market Commentary
- Upside & Downside Risks


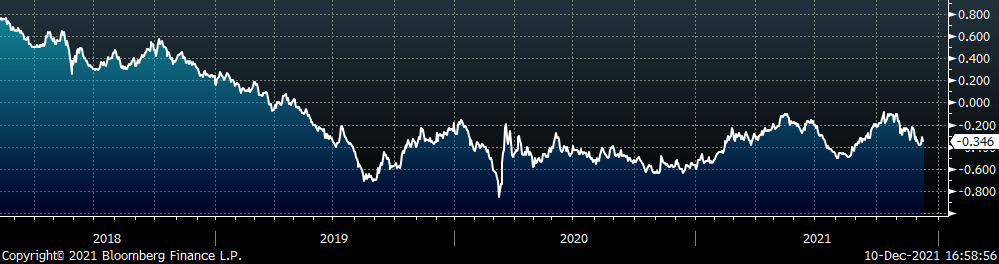
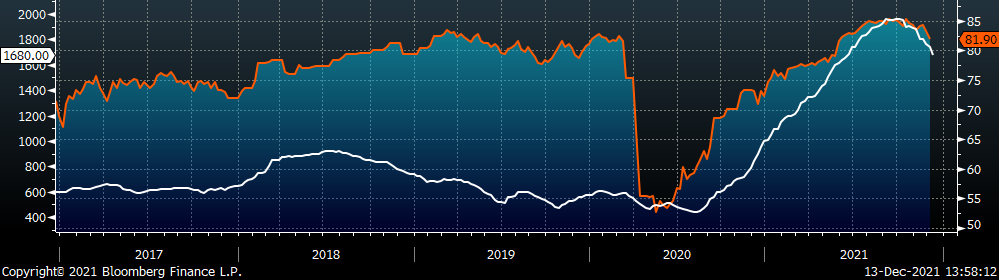
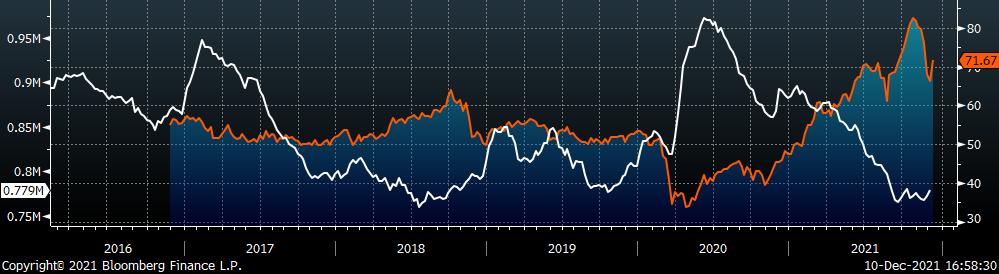
Last week, the physical market showed further price weakness. Deals continue to happen well below published spot prices with few caveats, where some products remain “off the table”, depending on the mill. The main takeaway here is that for now, mills appear to be filling holes at a discount, rather than actively competing for market share. With that being said, buyers have no incentive to pay published index prices on spot material and may be receiving high priced material on lagging contracts. The tension in that dynamic could lead to a rapid price correction. Additionally, while steel intensive industries continue to hold significant, and in some cases record, backlogs of existing orders, the seasonal slowdown in steel demand reduces the urgency to restock. While a fundamental bottom to support prices has not yet formed, these drivers (lead times, capacity utilization, import price differentials, mill profitability, etc.) have all begun moving off their historically high levels. The chart below shows the monthly average of mill lead times in white, and mill capacity utilization in orange.
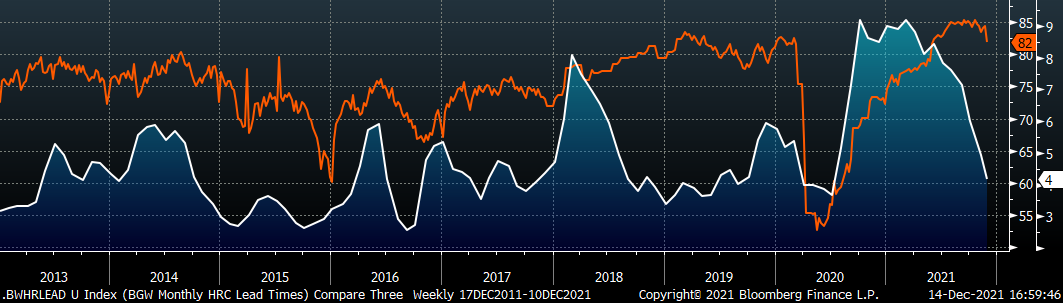
In last week’s report we noted the slowdown in production, shown by capacity utilization rate declining, which began mid-October and continued last week. One important factor to keep in mind when comparing now to 2018 & 2019 is that the Trump administration had the expressed goal of keeping capacity utilization above 80% to ensure availability for buyers after the 232 tariffs were enacted. A result, mills maintained elevated production levels, and added capacity, to politically justify the tariffs while imports plummeted. Due to recent consolidation, we anticipate more operating flexibility, where mills can react to falling prices by reducing production. Mill lead times continue to be the best insight into order books and a leading indicator for prices. The main difference now, is lead times may not go as low, or stay low for as long, before mills adjust production. As steel prices fall, the most significant upside risk to is waiting too long for lower prices and running out of the material needed to support your existing and new orders.
Below are the most pertinent upside and downside price risks:
Upside Risks:
Downside Risks:
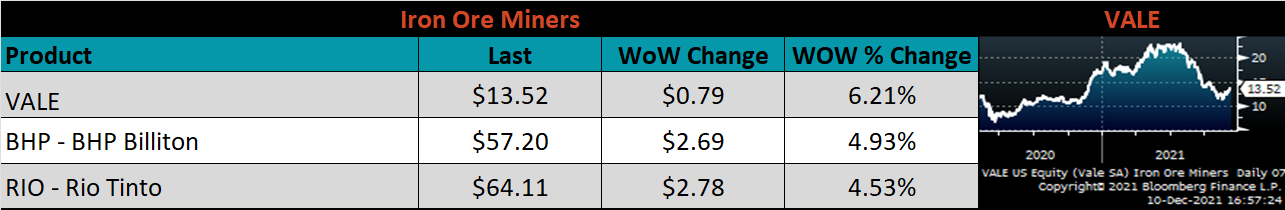
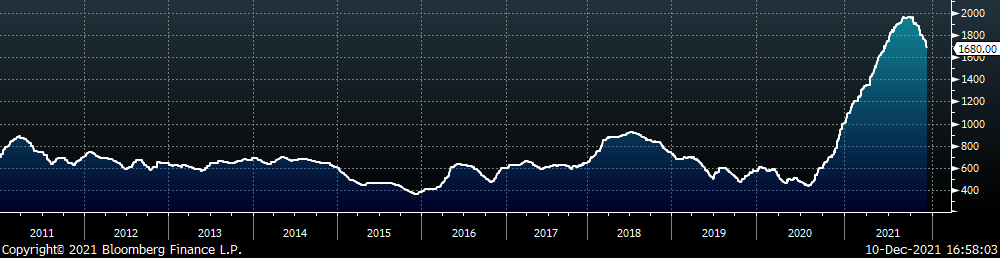
The Platts TSI Daily Midwest HRC Index decreased by $60 to $1,680.
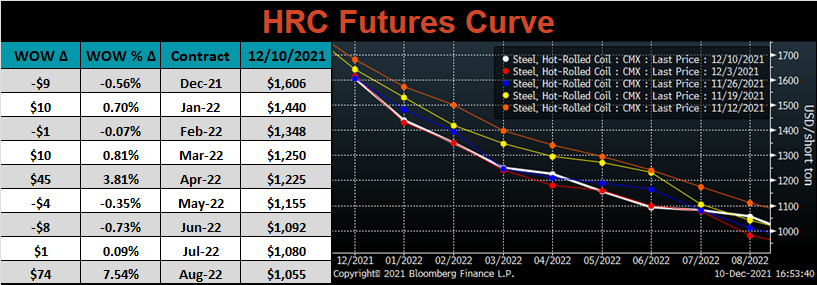
The CME Midwest HRC futures curve is below with last Friday’s settlements in white. Last week, the curve was mixed but mostly unchanged, with a few expirations settling significantly higher (Apr.22 & Aug.22).
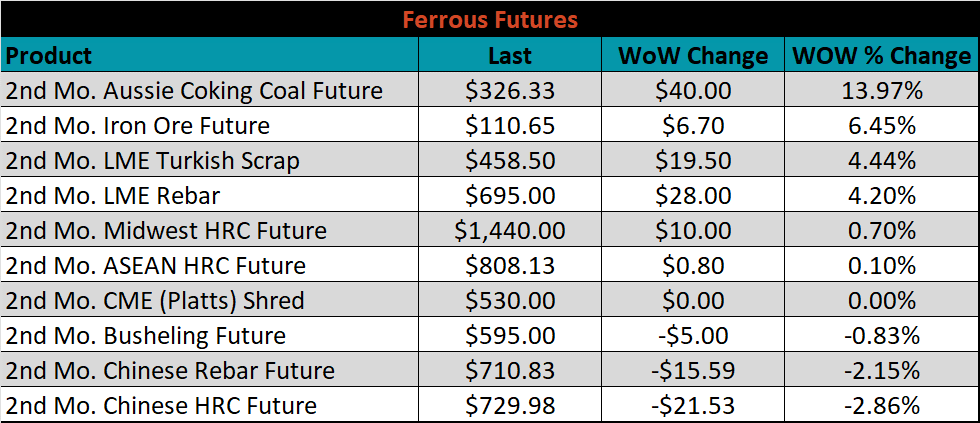
January ferrous futures were mostly higher, led by Aussie coking coal, which gained 14%, while Chinese HRC lost 2.9%.
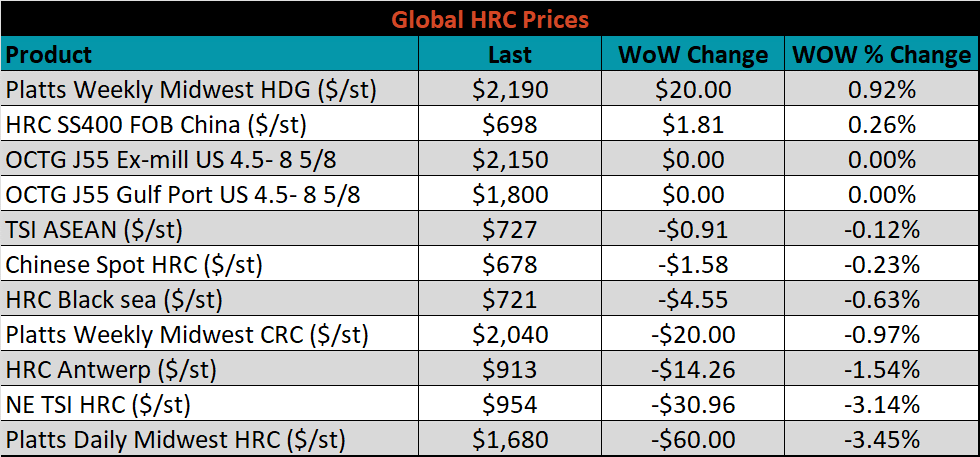
Global flat rolled indexes were mostly lower again this week, led by Midwest HRC, down another 3.5%, while Midwest HDG was up 0.9%.
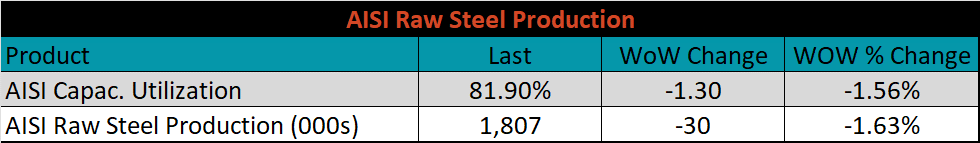
The AISI Capacity Utilization fell 1.3% to 81.9%.
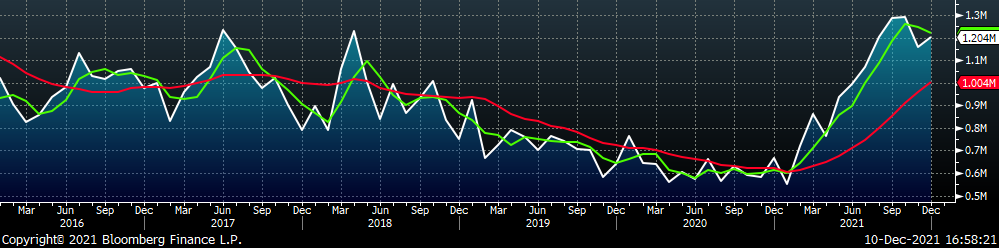
December flat rolled import license data is forecasting an increase of 44k to 1.2M MoM.
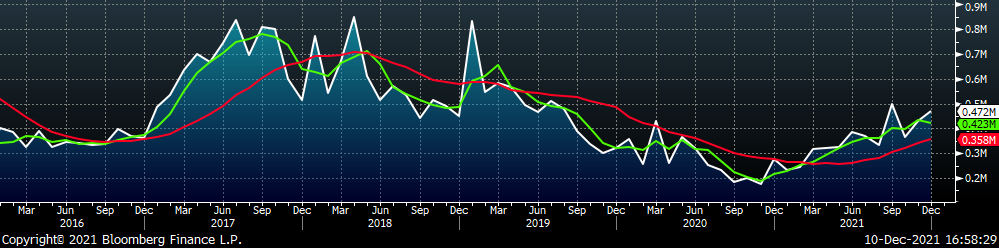
Tube imports license data is forecasting an increase of 42k to 472k in December.
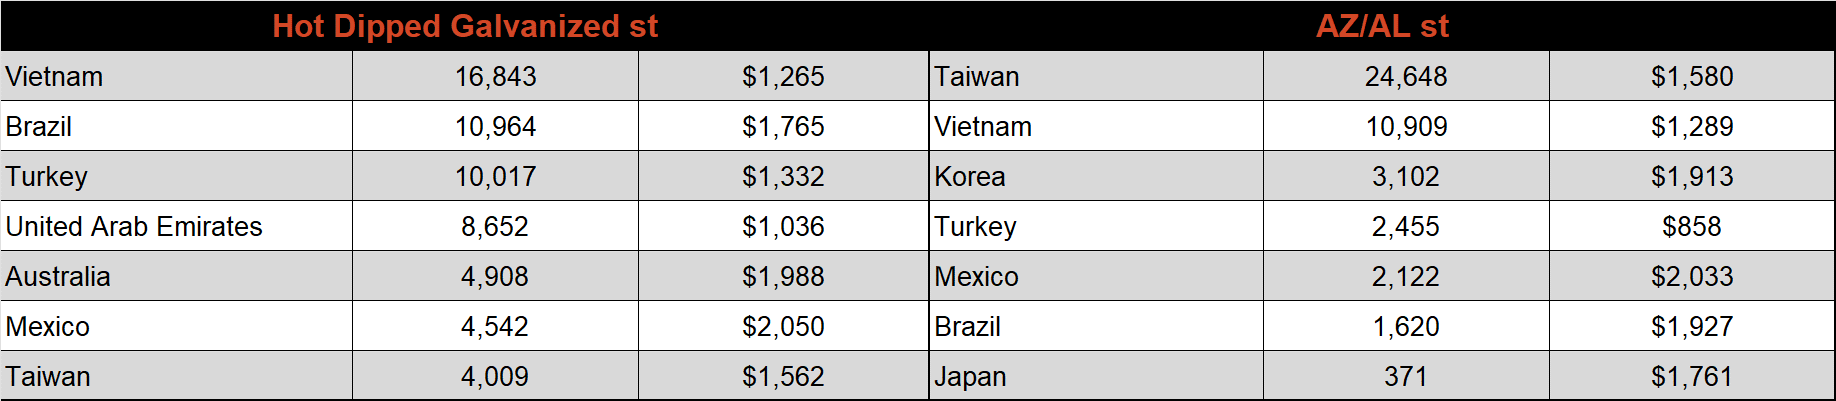
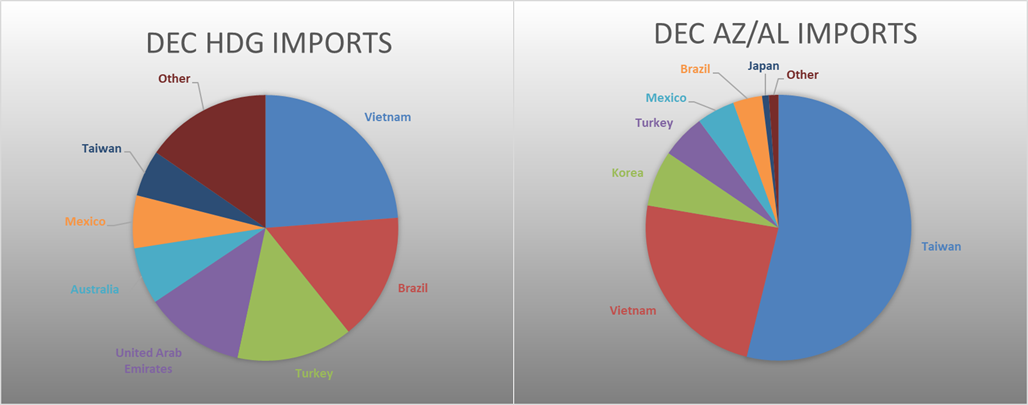
December AZ/AL import license data is forecasting an increase of 29k to 160k.
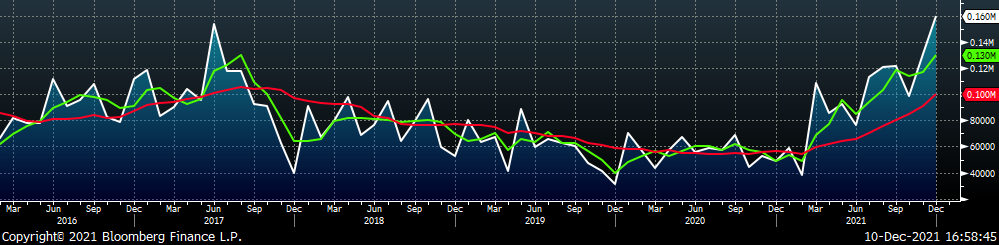
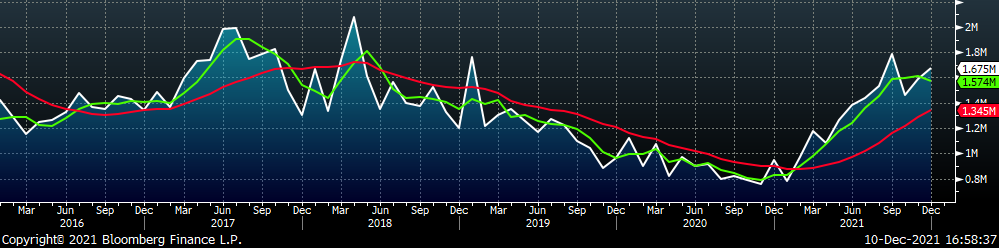
Below is December import license data through December 6th, 2021.
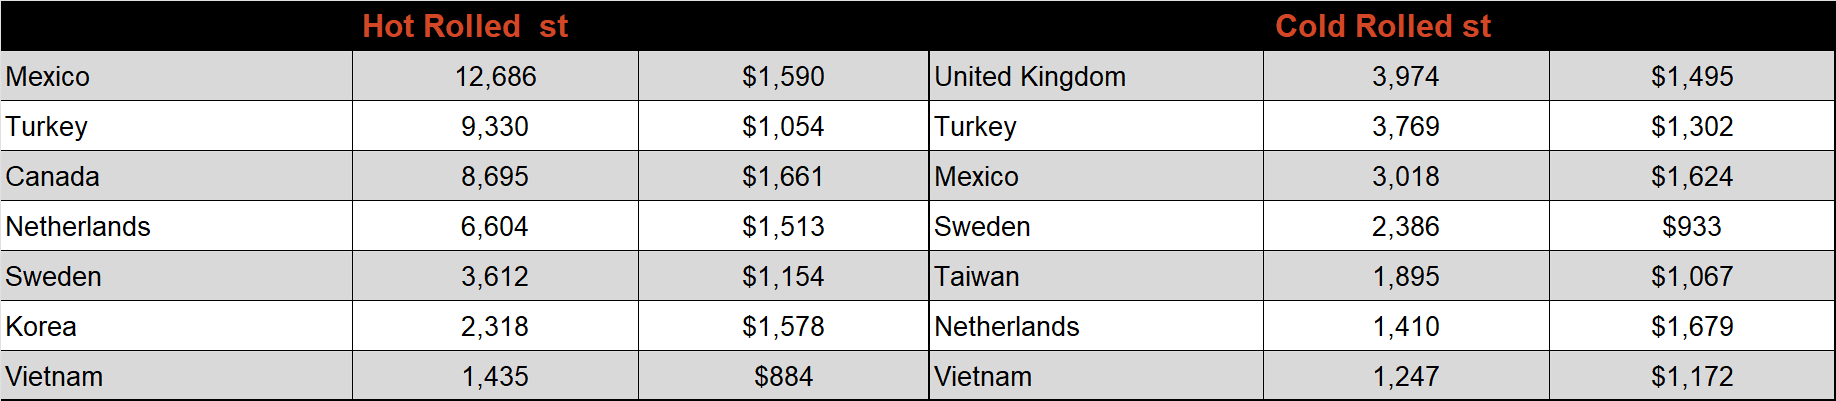
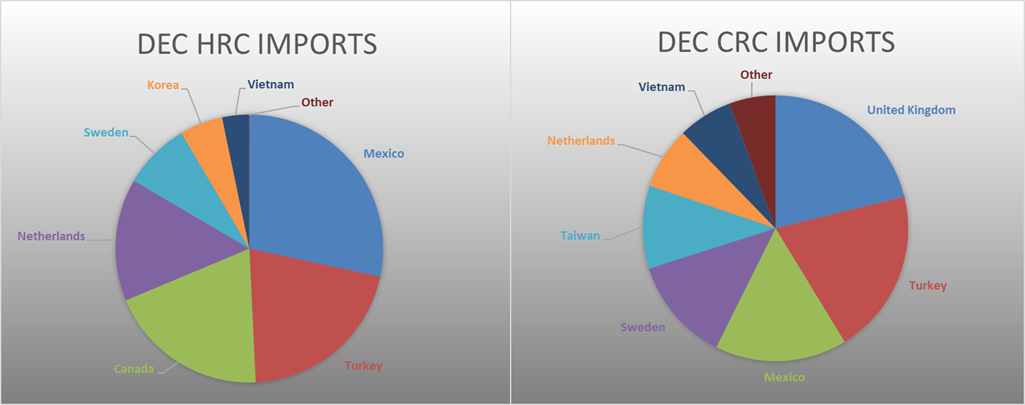
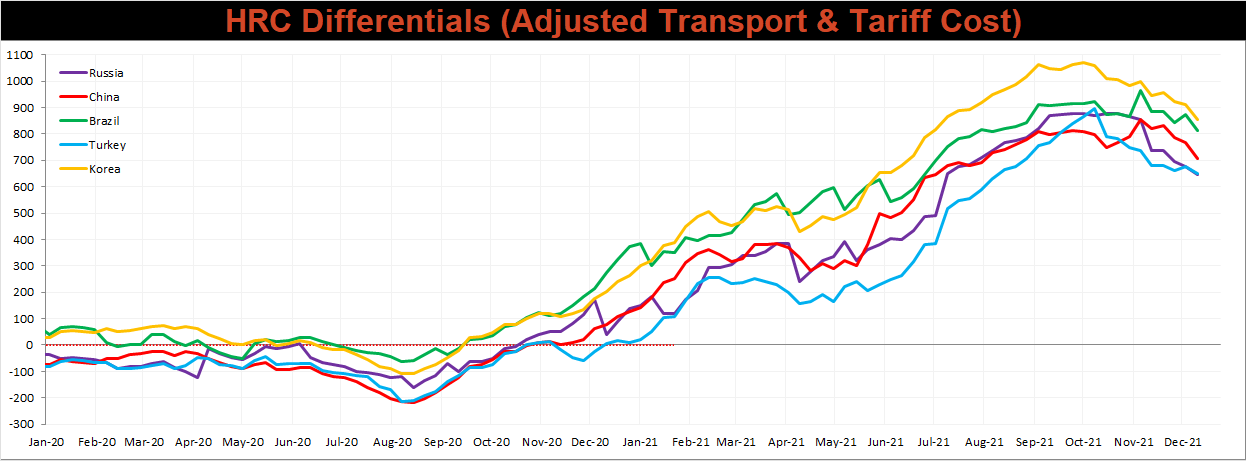
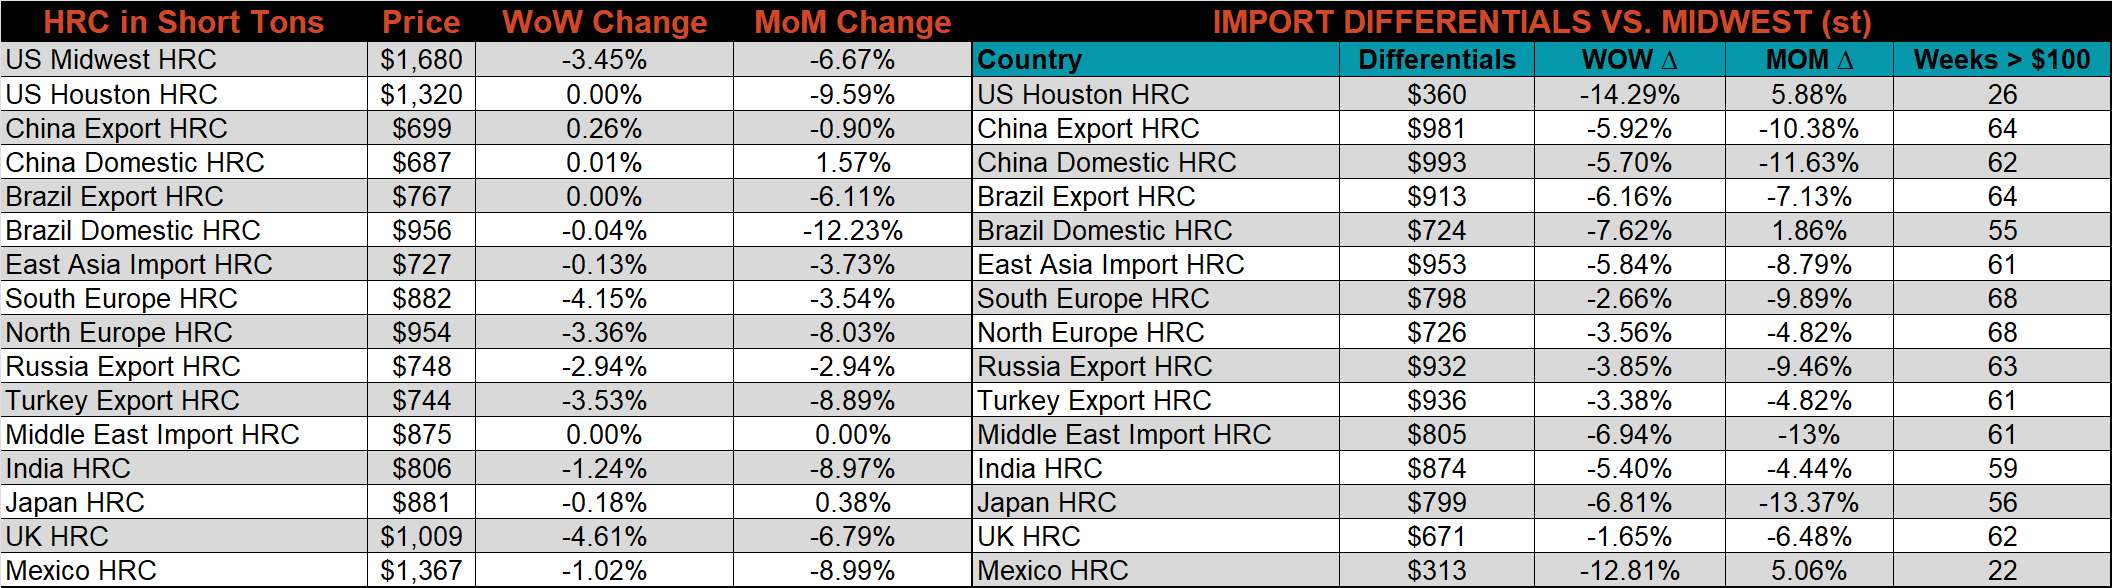
Below is the Midwest HRC price vs. each listed country’s export price using pricing from SBB Platts. We have adjusted each export price to include any tariff or transportation cost to get a comparable delivered price. All the watched countries differentials decreased this week, as the U.S. price fell further than their respective prices.
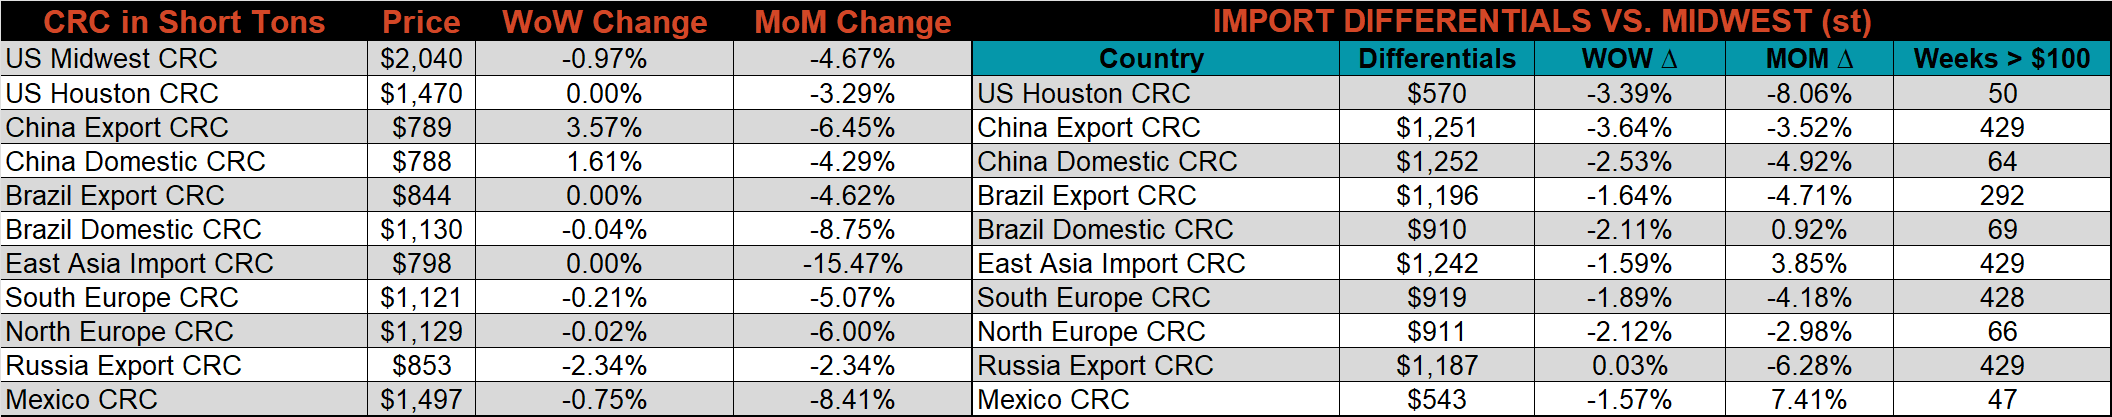
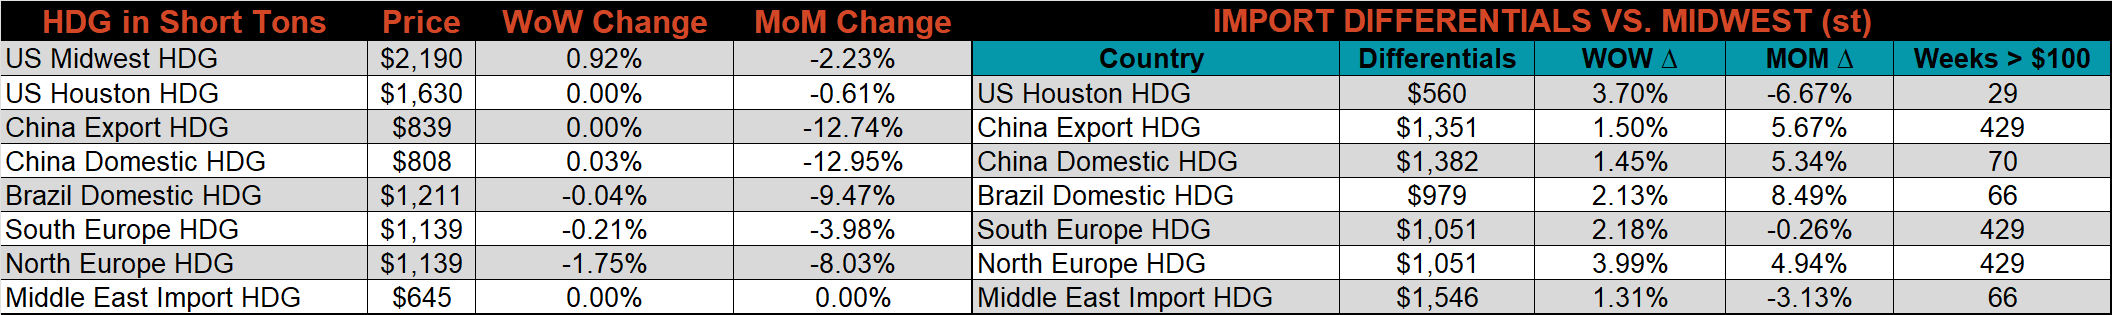
SBB Platt’s HRC, CRC and HDG pricing is below. The Midwest HRC, and CRC prices were lower this week, down 3.5%, and 1%, respectively, while the HDG price was 0.9% higher. Outside of the U.S., the U.K. HRC price was down 4.6%.
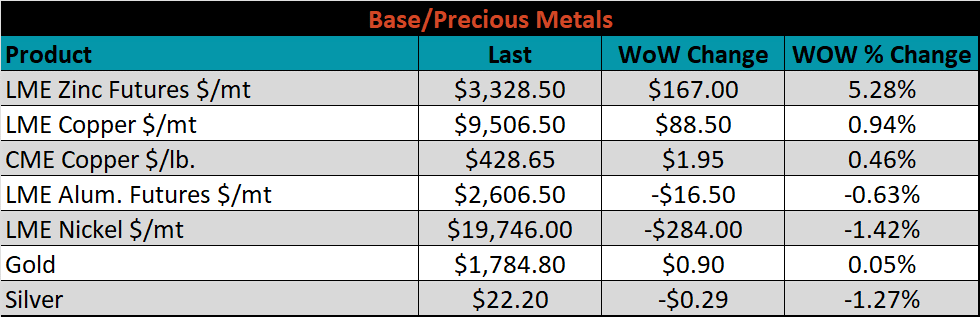
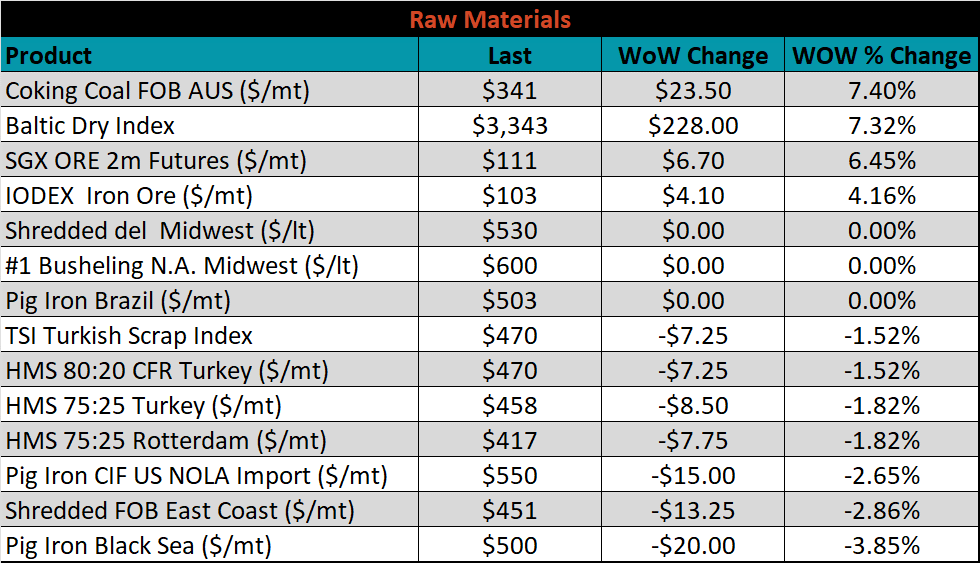
Raw material prices were mixed. Aussie coking coal rose 7.4%, while Black Sea pig iron lost 3.9%.
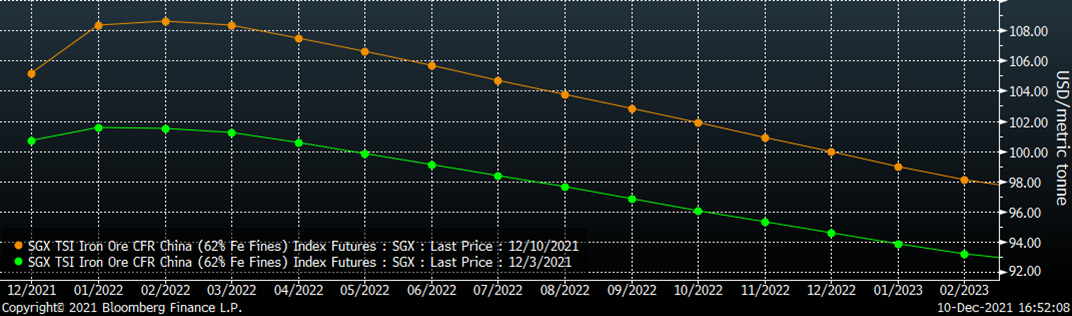
Below is the iron ore future curve with Friday’s settlements in orange, and the prior week’s settlements in green. Last week, the entire curve shifted higher again, most significantly in the front.
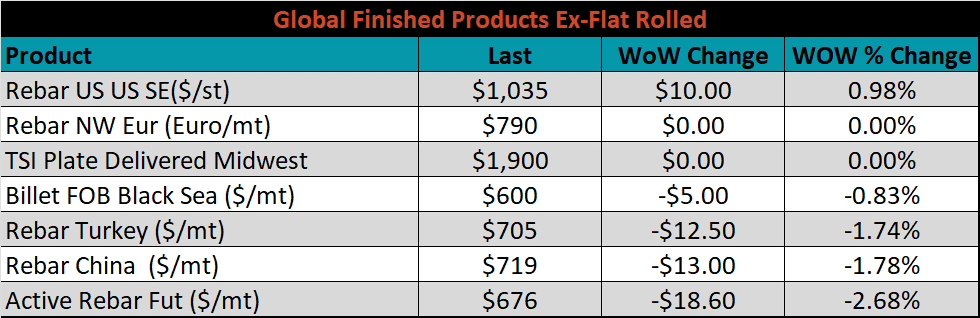
The ex-flat rolled prices are listed below.

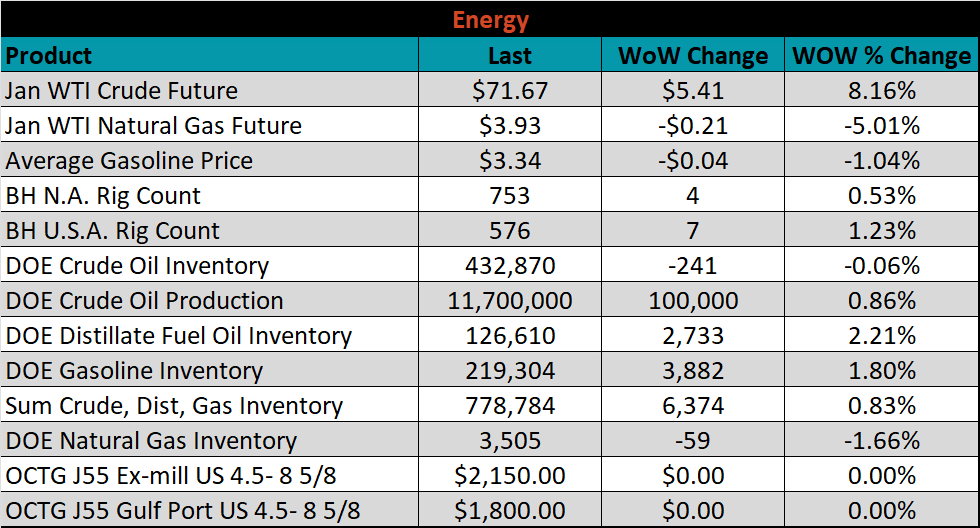
Last week, the January WTI crude oil future gained $5.41 or 8.2% to $71.67/bbl. The aggregate inventory level was up another 0.8%, while crude oil production increased to 11.7m bbl/day. The Baker Hughes North American rig count was up 4 rigs, while the U.S. rig count was up 7 rigs.
The list below details some upside and downside risks relevant to the steel industry. The bolded ones are occurring or highly likely.
Upside Risks:
Downside Risks: