Content
-
Weekly Highlights
- Market Commentary
- Durable Goods
- Risks


Last Friday, ArcelorMittal increased prices $40, attempting the fourth round of price increases since late October. However, support for this increase will likely remain unknown until mid-January, as spot transactions will be sparse over the next few weeks due to holidays. For increases to hold, mills must be willing and able to turn away orders. Without any new orders being placed, it will be difficult to determine a spot transaction price. Moreover, the mills appear to be in a strong position to hold prices higher through the end of the year because elevated lead times indicate that their January order books are strong. The fact that there will be fewer active buyers in the market decreases the buyer community’s ability to negotiate lower prices. The next price move will be based on buying activity and willingness to pay higher prices come January.
For most of 2019, buyers were rewarded for delaying purchases because prices were declining and lead times shrinking. This “buyer’s strike” remains the preferred purchasing strategy, although it isn’t currently affecting mill’s order books or market prices. This is due to significant order placement activity in late October as prices bottomed and sufficient inventory positions to last well into January. While transaction prices are over $100 higher now, it is unlikely that any significant volume is transacting at the current spot price. We won’t know until current inventory stockpiles are depleted and buyers return to the market whether demand activity has increased enough to justify paying $600 for HRC.
The uncertainty regarding the direction of the next price move is reflected by the flat future curve. Below is a chart of the 6th month HRC future price minus the 3rd month future. The curve is in contango when the line is positive, flat at the zero line, and in backwardation when negative.

With the curve maintaining a flat pricing expectation at the $590 level through 2020, the upside and downside risks appear balanced. The current spot price of $580 – $600 is in line with the historical average price of HRC over the past 5 years, excluding the deceptive peak of 2018. However, there are undoubtedly unpredictable events that will influence market prices, presenting a significant risk to any future physical transactions. The curve should be used as a tool to mitigate these risks inherent in the market, and currently, it provides the opportunity to lock in current prices for the next year.
Administrative note: This will be the last Week Over Week report of 2019. We will return the first full week of January. Have a happy and safe holiday season!

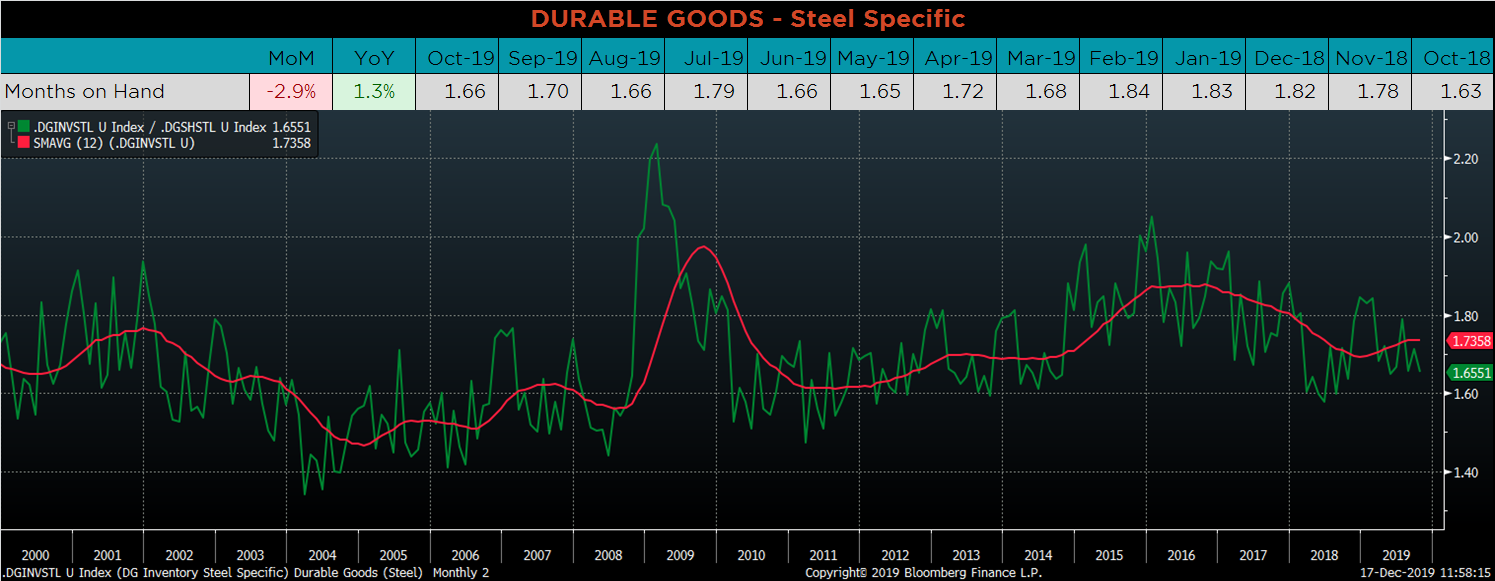
Below are final October new orders from the Durable Goods report. Overall, new orders were lower YoY, but higher compared to September. Manufacturing new orders ex-transportation continue to show weakness compared to a year ago. The final chart looks at the months on hand (inventory divided by shipments) for durable goods categories that are steel intensive. MOH moved lower as monthly shipments increased, while inventories were flat or decreasing.



Below are the most pertinent upside and downside price risks:
Upside Risks:
Downside Risks:

The Platts TSI Daily Midwest HRC Index was up $2.75 to $560.50.

The CME Midwest HRC futures curve is below with last Friday’s settlements in white. The curve moved slightly higher.

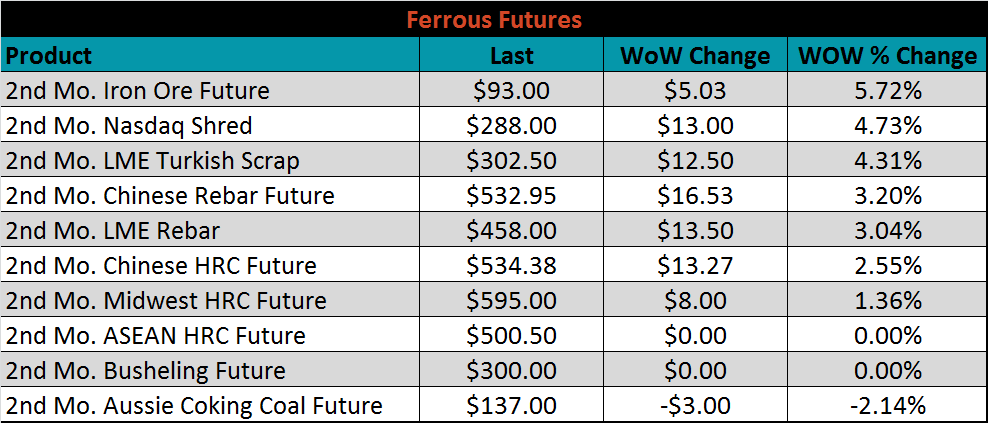
January ferrous futures were mixed. The iron ore future gained 5.7%, while the Aussie coking coal future lost another 2.1%.
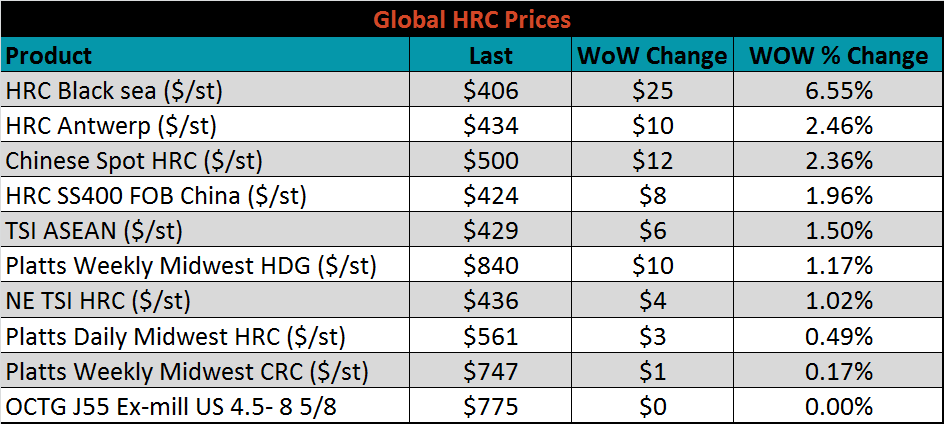
The global flat rolled indexes were all higher, led by Black Sea HRC and Antwerp HRC, up 6.6% and 2.5%, respectively.
The AISI Capacity Utilization Rate was down another 0.8% to 78.7%. On a year-to-date basis, the 80% goal set by the Trump administration continues to hold, but production is expected to remain low through the holidays.


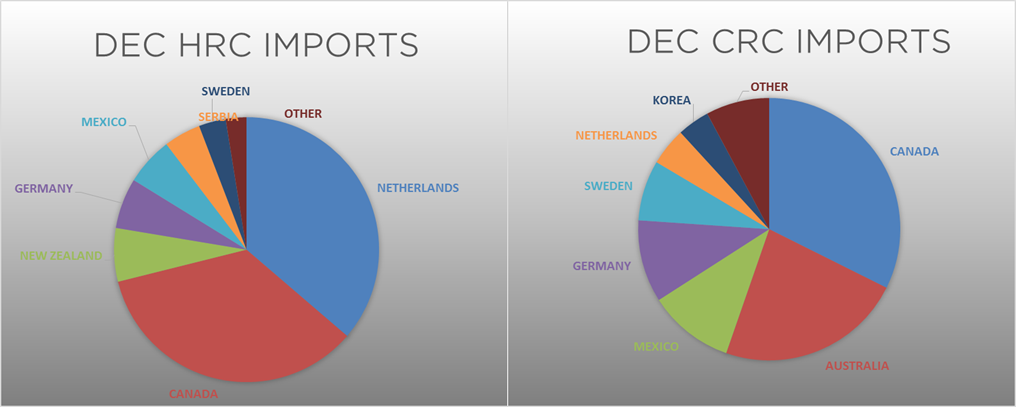
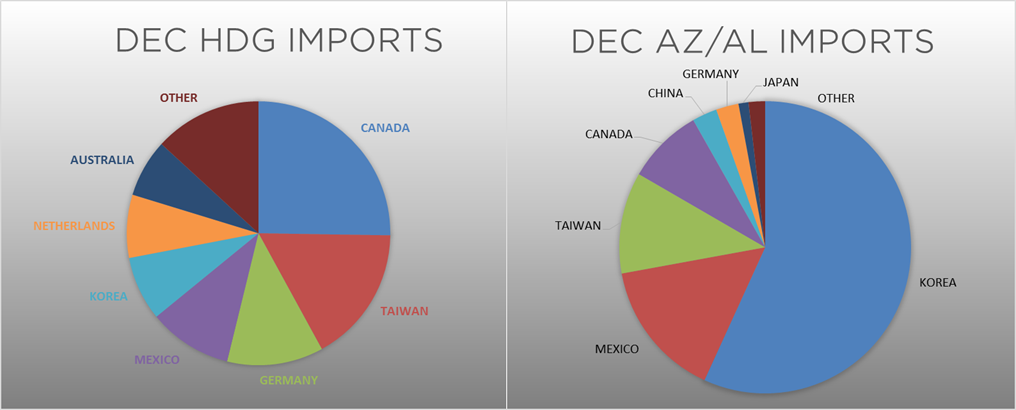
December flat rolled import license data is forecasting a decrease of 38k to 524k MoM.

Tube imports license data is forecasting a MoM decrease of 36k to 337k tons in December.


AZ/AL import license data is forecasting a decrease of 4k in December to 39k.

Below is November import license data through December 10, 2019.


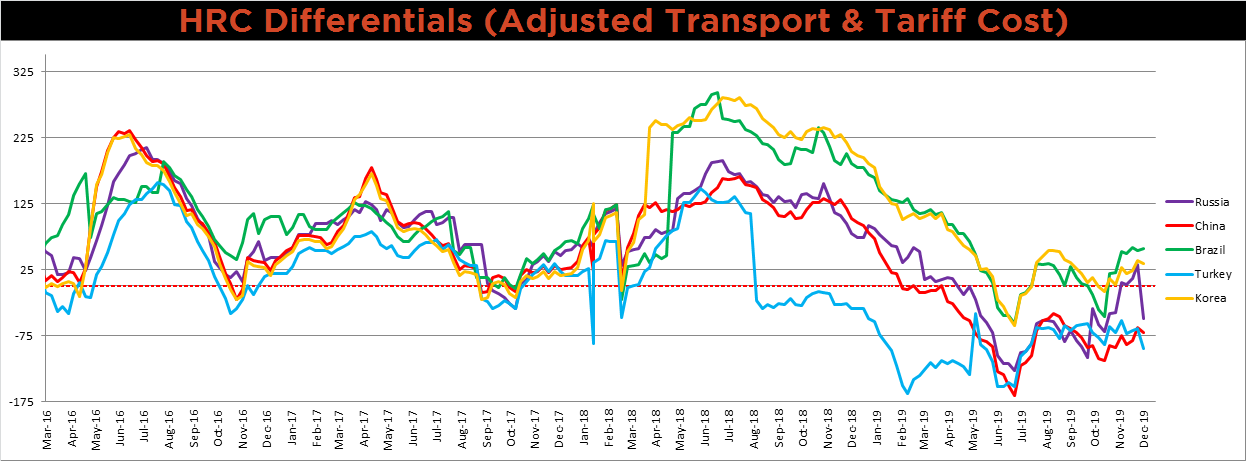
Below is the Midwest HRC price vs. each listed country’s export price using pricing from SBB Platts. We have adjusted each export price to include any tariff or transportation cost to get a comparable delivered price. The Brazilian differential was the only one to increase this week, although only slightly, while the Russian price differential moved dramatically lower.
SBB Platt’s HRC, CRC and HDG pricing is below. The Midwest HDG, HRC and CRC prices were all up, 1.2%, 0.5% and 0.2% higher, respectively. Globally, the Russian HRC and CRC export prices were up, 20% and 15.6%, respectively.


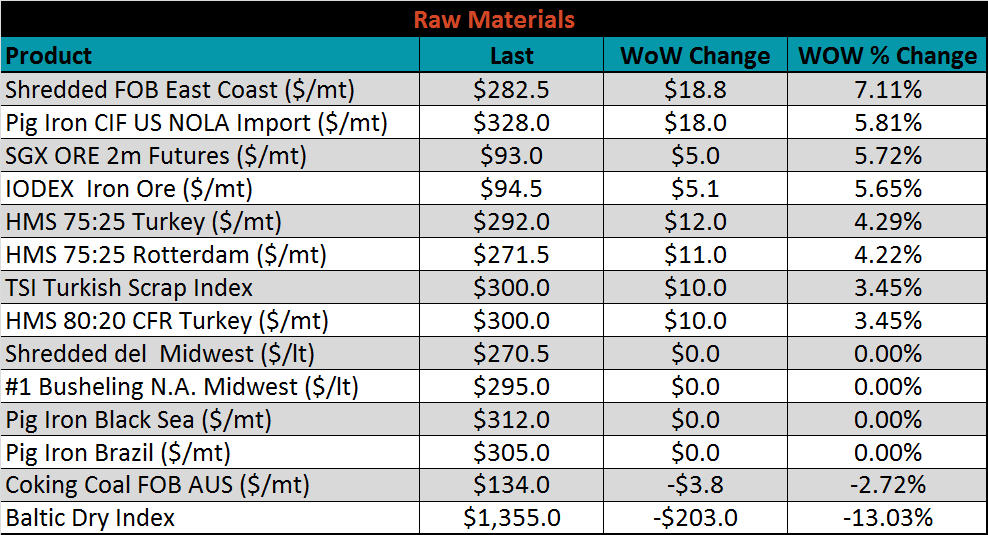
Raw material prices were mostly higher. Midwest shredded was up 7.1%, while Australian coking coal was down 2.7%
Below is the iron ore future curve with Friday’s settlments in orange, and the prior week’s settlements in green. The curve has continued to shift slightly higher over the last three weeks.

The ex-flat rolled prices are listed below.


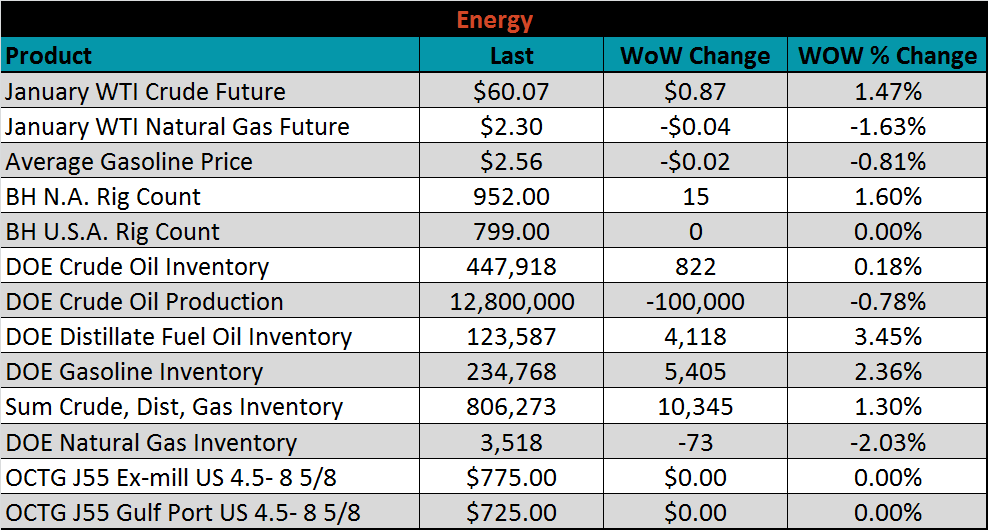
Last week, the January WTI crude oil future gained another $0.87 or 1.5% to $60.07/bbl. The aggregate inventory level was up 1.3% and crude oil production was slightly lower at 12.8m bbl/day. The Baker Hughes North American rig count was up fifteen rigs, while the U.S. rig count was flat.


The list below details some upside and downside risks relevant to the steel industry. The orange ones are occurring or look to be highly likely. The upside risks look to be in control.
Upside Risks:
Downside Risks: