Content
-
Weekly Highlights
- Market Commentary
- Upside & Downside Risks


This will be the final WoW report of the year, the next publication will be dated January 6th, 2023.
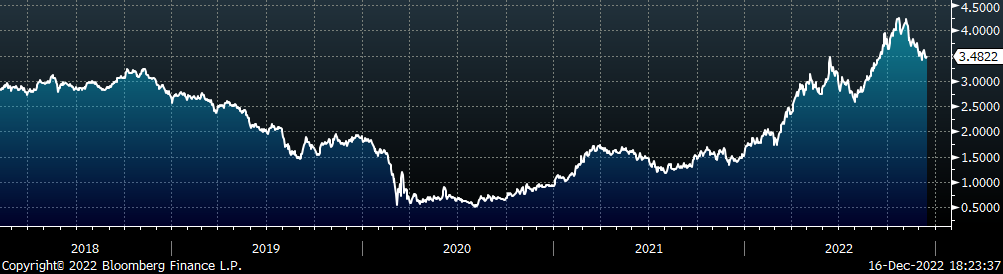
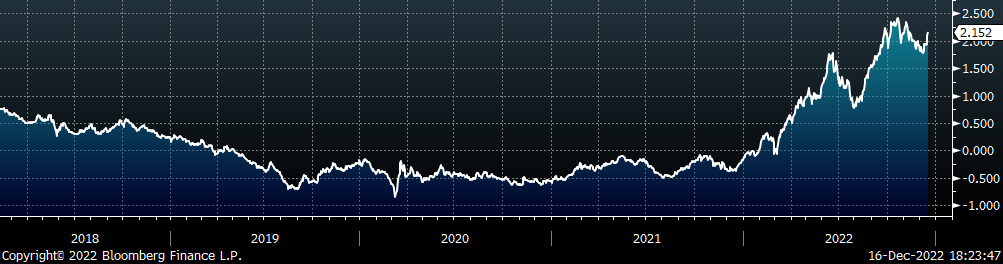
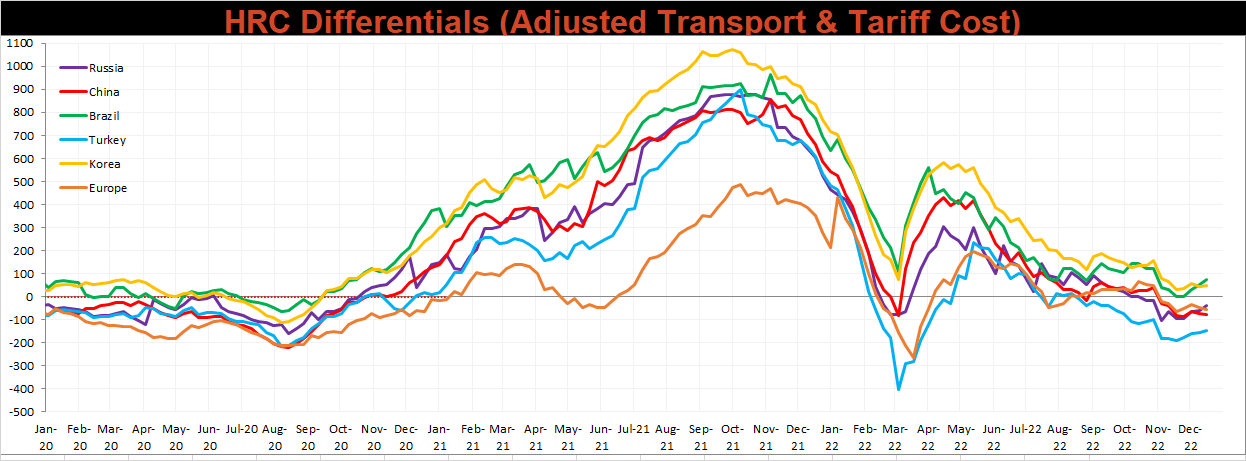
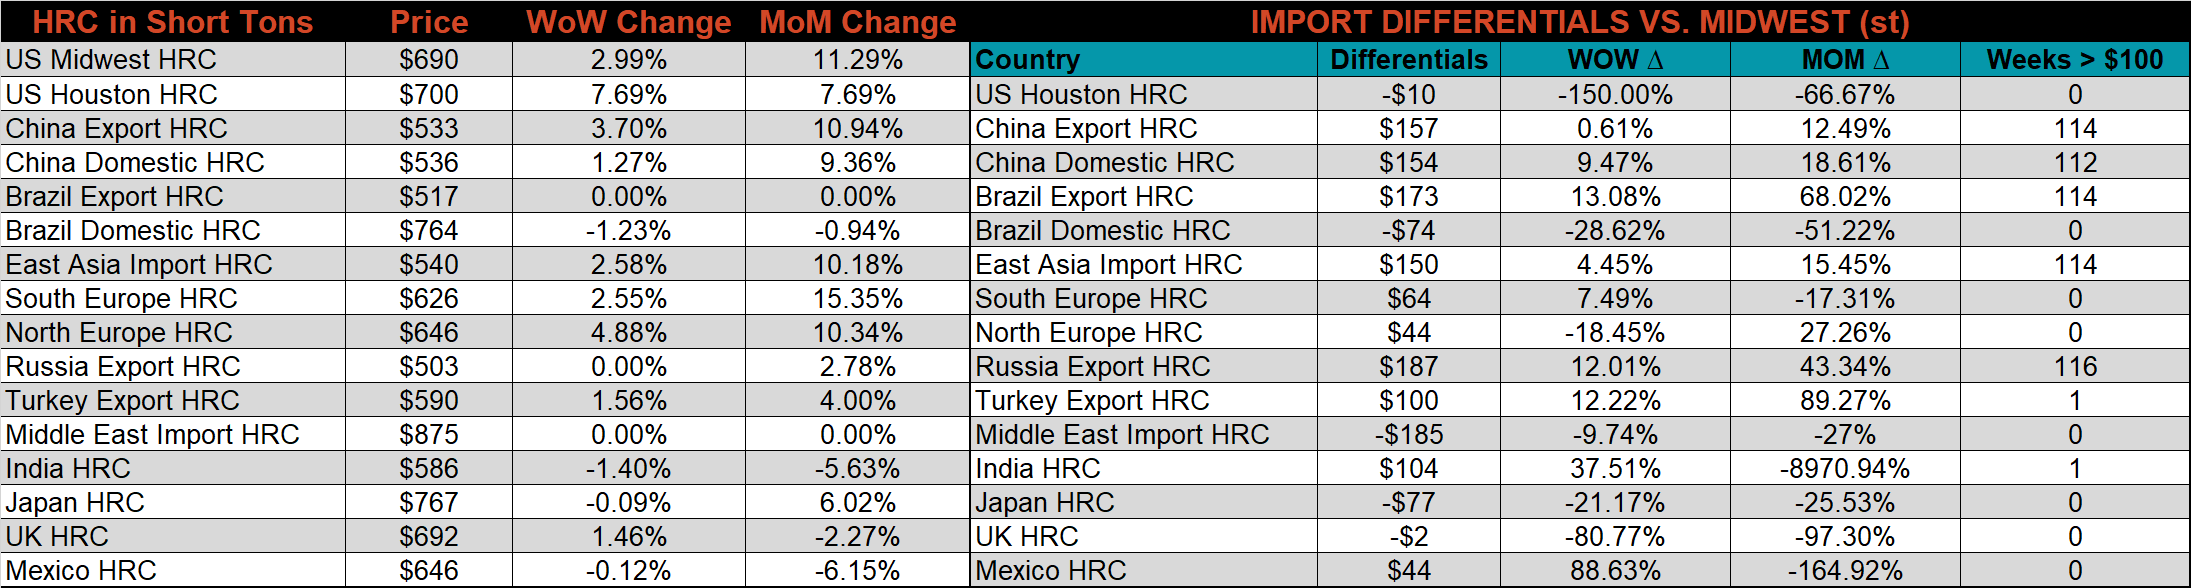
The Chinese export HRC price has now increased for 6 straight weeks, up over 14.2% since it bottomed over the week of November 4th. The chart below shows the spread between the U.S. Midwest HRC price, minus the Chinese export (adjusted for transportation and tariffs) HRC price.
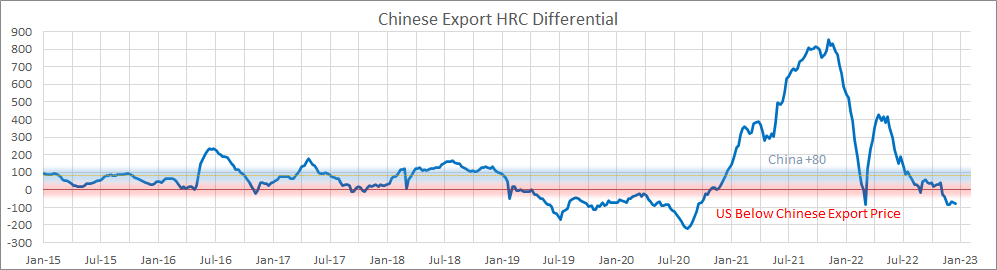
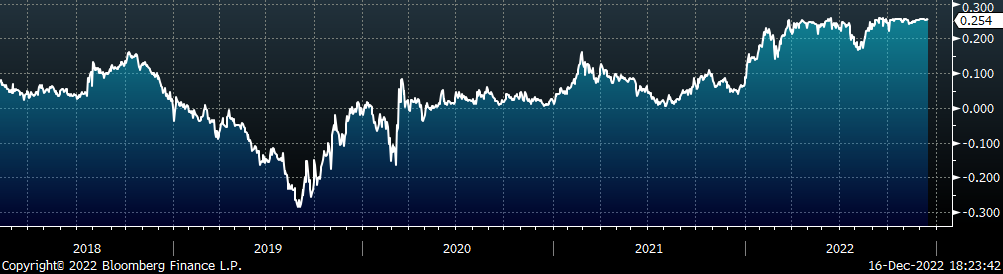
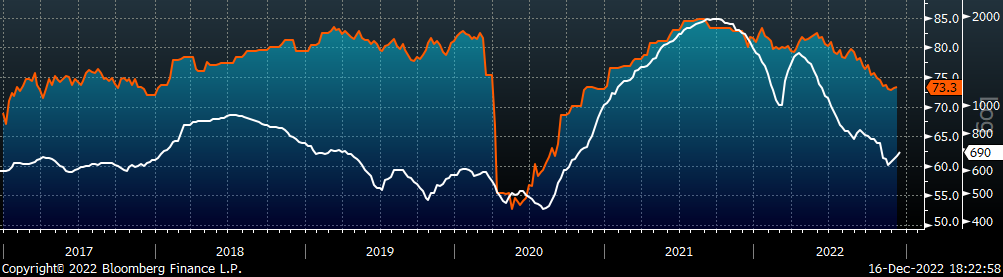
The main takeaway from this chart is that the Chinese export price (which is a good stand-in for the global price) does not offer a good opportunity for importing material over the next couple of months. Taking a closer look at short-term implications, a negative differential (i.e., below the red horizontal line) is a strong bullish signal for domestic prices. It means that there is minimal risk for domestic producers to be undercut by global producers and when taking the long-term average of the differential into account (blue horizontal line), this suggests that domestic prices could run for more than $150 from current spot levels before the threat of imports is critical. To further support that, the chart below shows the Midwest (dark blue) and Houston (orange) HRC prices.
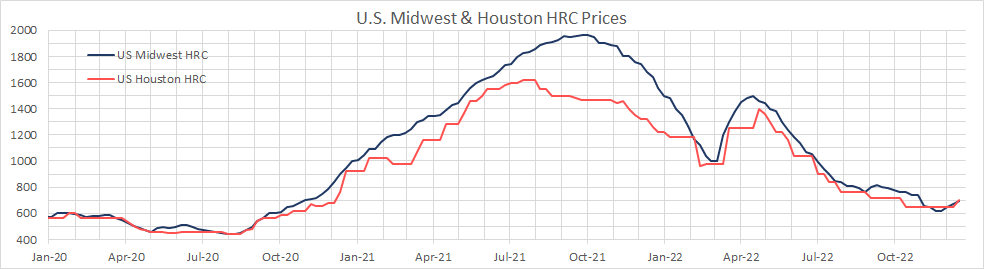
The main difference between the two prices above is that Houston HRC will always be more driven by import arrivals than the Midwest price. As referenced above, we have seen the global price rally over the last 6 weeks, and now we see the impact of that domestically, with the Houston price increasing for the first time in 34 weeks. While the impact on next year’s demand from the most significant tightening cycle in decades remains to be seen, the broad increase in global and domestic HRC prices should carry into the beginning of the year. It is important to remember that reduced demand for steel does not necessarily mean lower prices. Current prices are well below the inflated numbers from 2021 and the spring of this year. Compared to the rest of the world, US producers are in a unique position to throttle back supply and meet demand going forward if mills remain disciplined. This dynamic could be even more significant going into 2023 now that mills have shrunk their contract books and are not obligated to produce at elevated levels when demand is shaky.
Upside Risks:
Downside Risks:
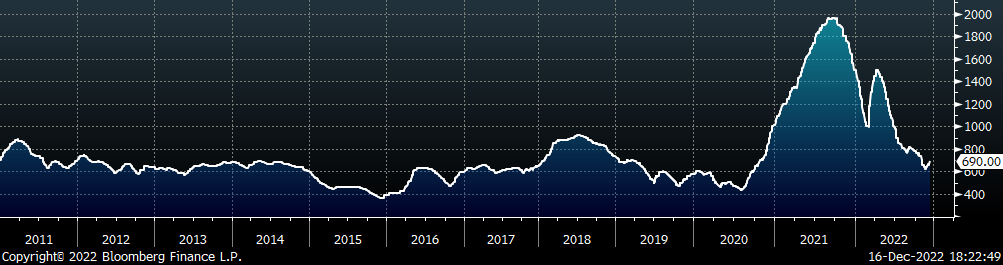
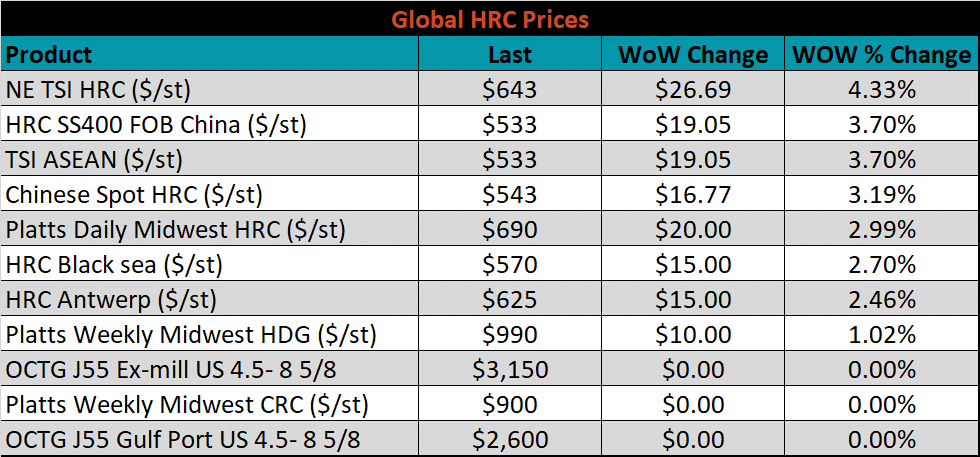
The Platts TSI Daily Midwest HRC Index was up another $20 this week, ending at $690.
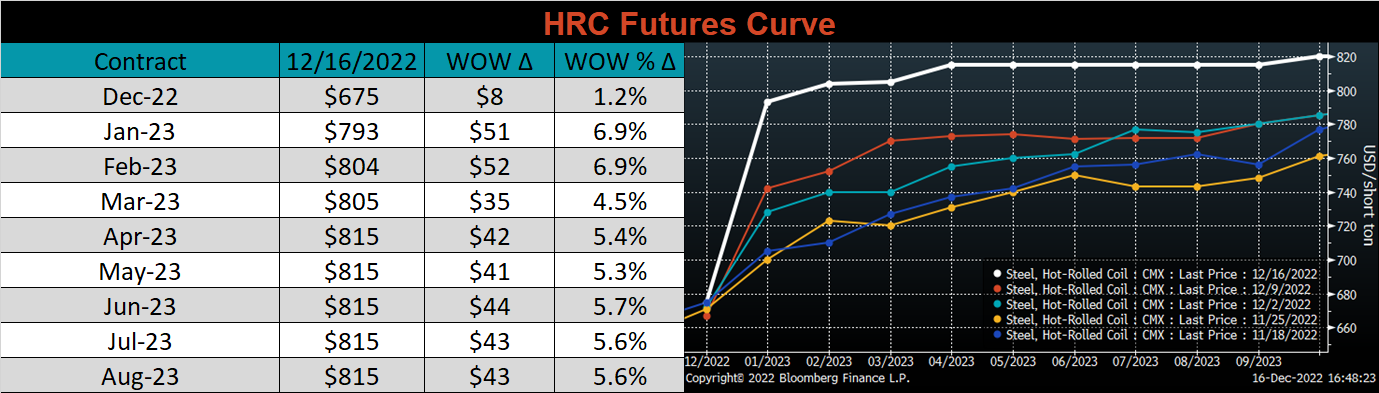
The CME Midwest HRC futures curve is below, with last Friday’s settlements in white. The entire curve was higher this week, most significantly in the front. The ended the week flat around $800-820 level for 2023.
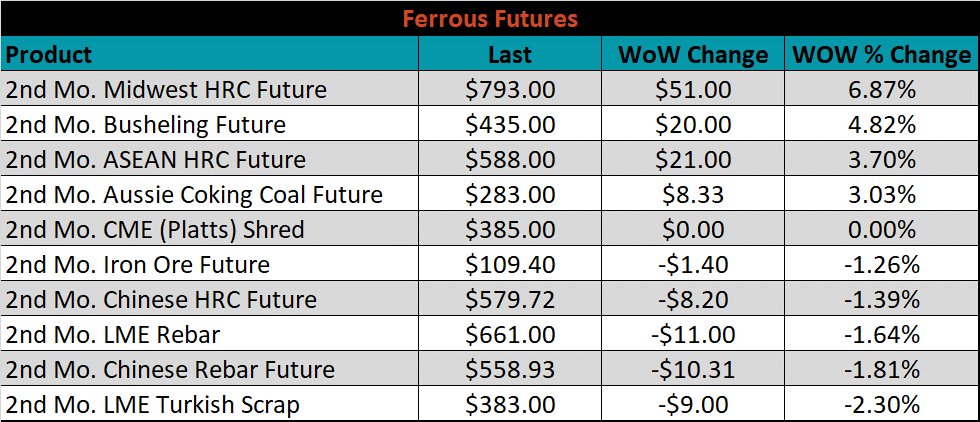
The 2nd month ferrous futures were mixed this week. Midwest HRC gained 6.9%, while Turkish scrap lost 2.3%.
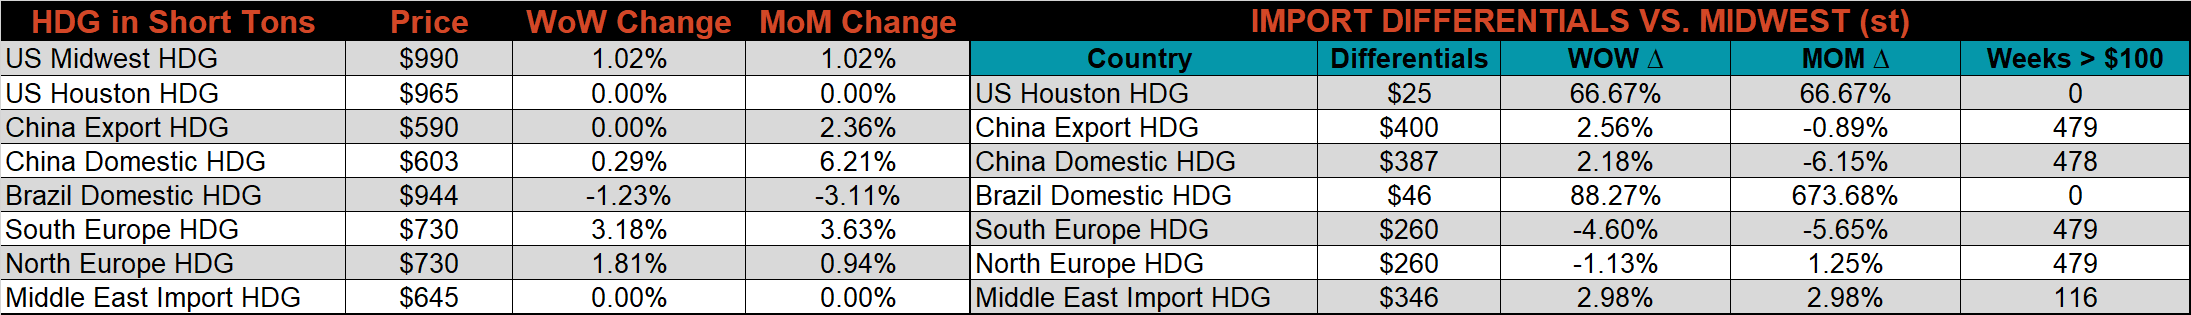
Global flat rolled indexes were all higher again this week, led this time by Northern European HRC up 4.3%.
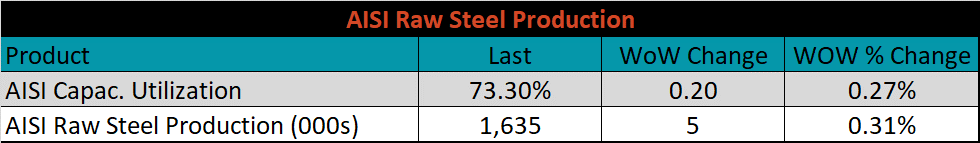
The AISI Capacity Utilization was up another 0.2% to 73.3%.
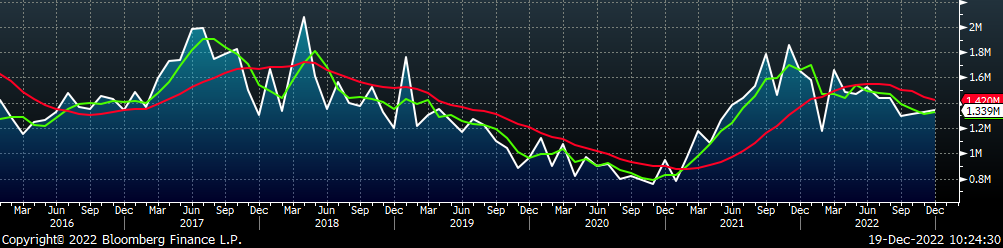
December flat rolled import license data is forecasting an increase of 3k to 768k MoM.
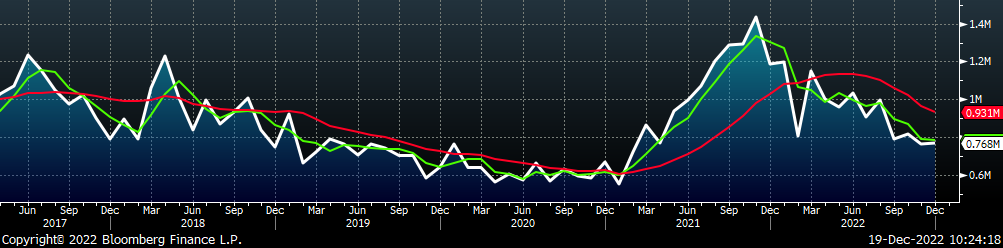
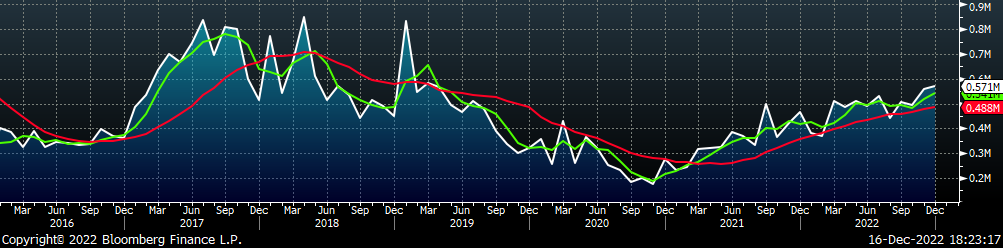
Tube imports license data is forecasting an increase of 5k to 571k in December.
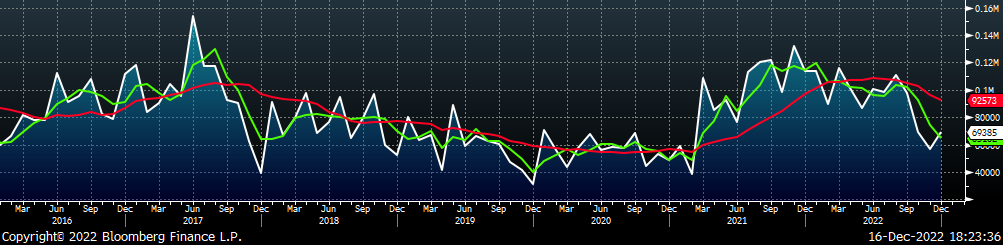
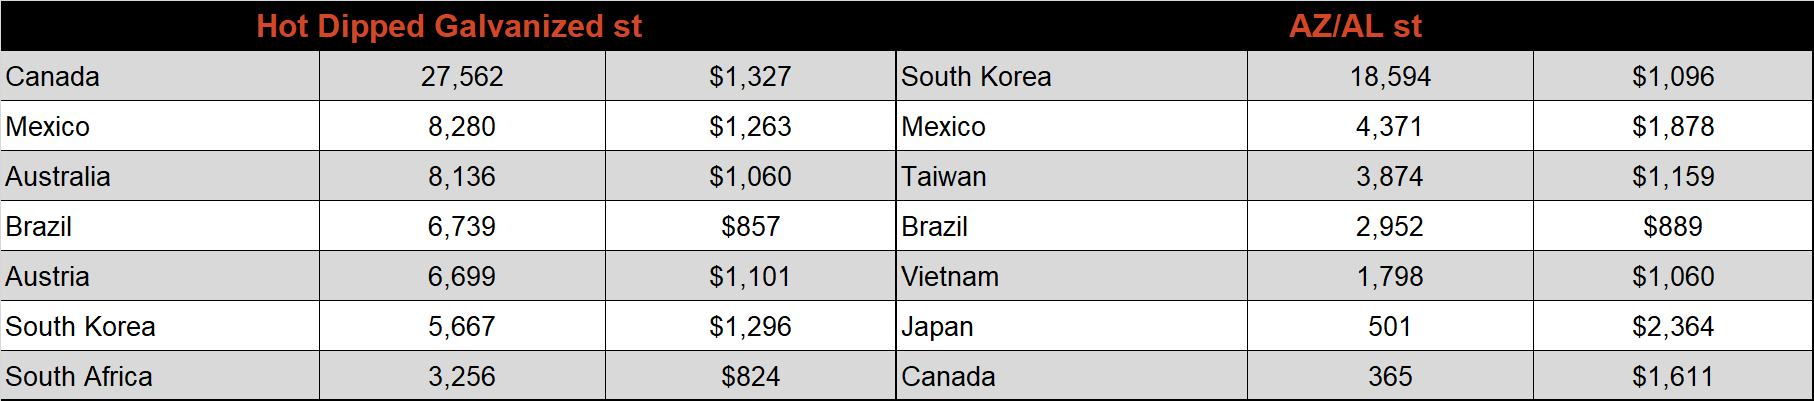
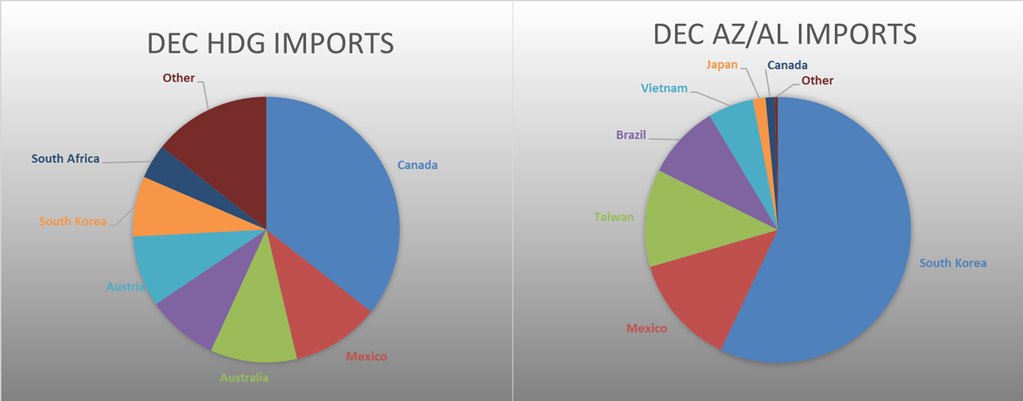
December AZ/AL import license data is forecasting an increase of 14k to 69k.
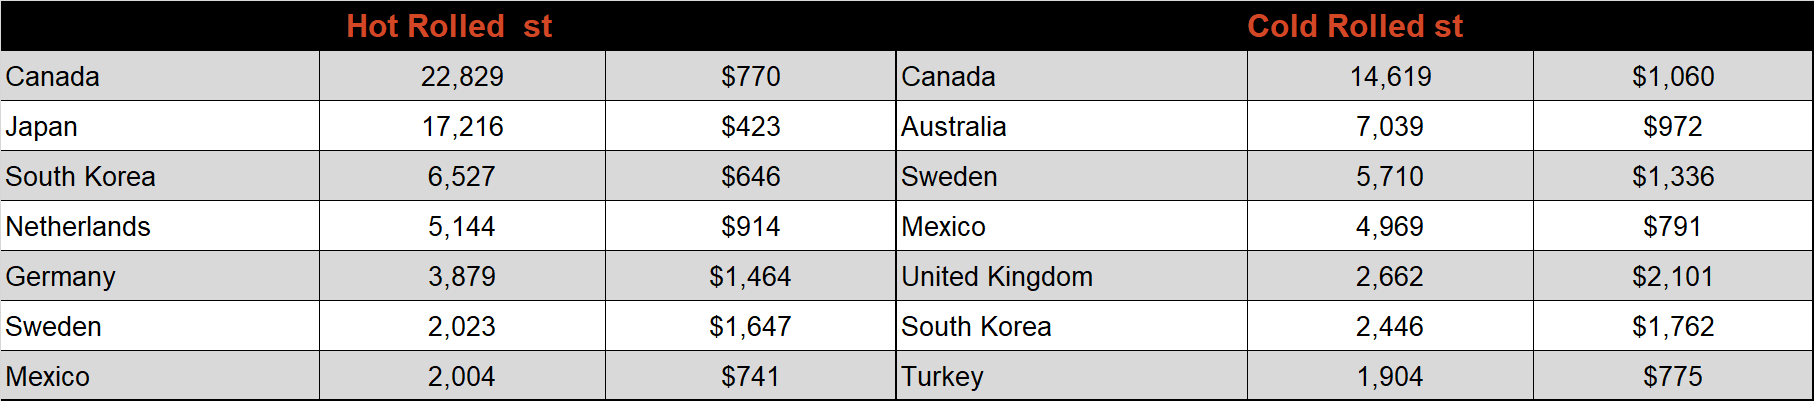
Below is December import license data through December 12th, 2022.
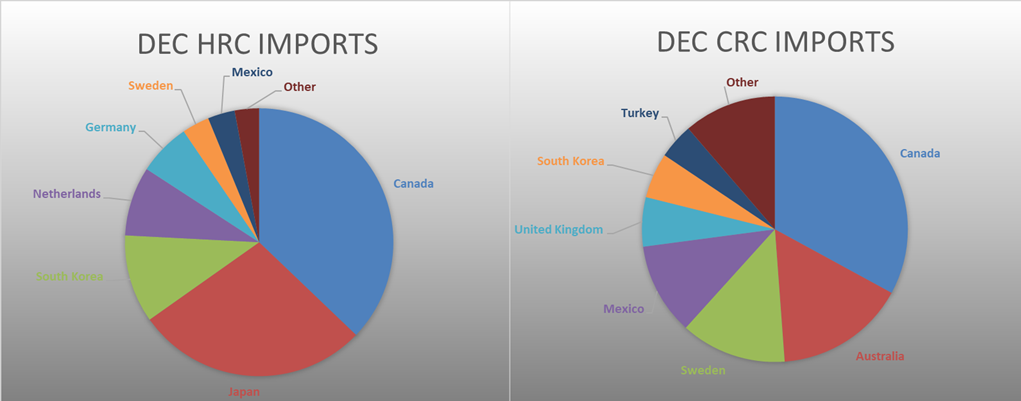
Below is the Midwest HRC price vs. each listed country’s export price using pricing from SBB Platts. We have adjusted each export price to include any tariff or transportation cost to get a comparable delivered price. The differentials for Northern Europe and China decreased this week, while the remaining countries differentials all increased.
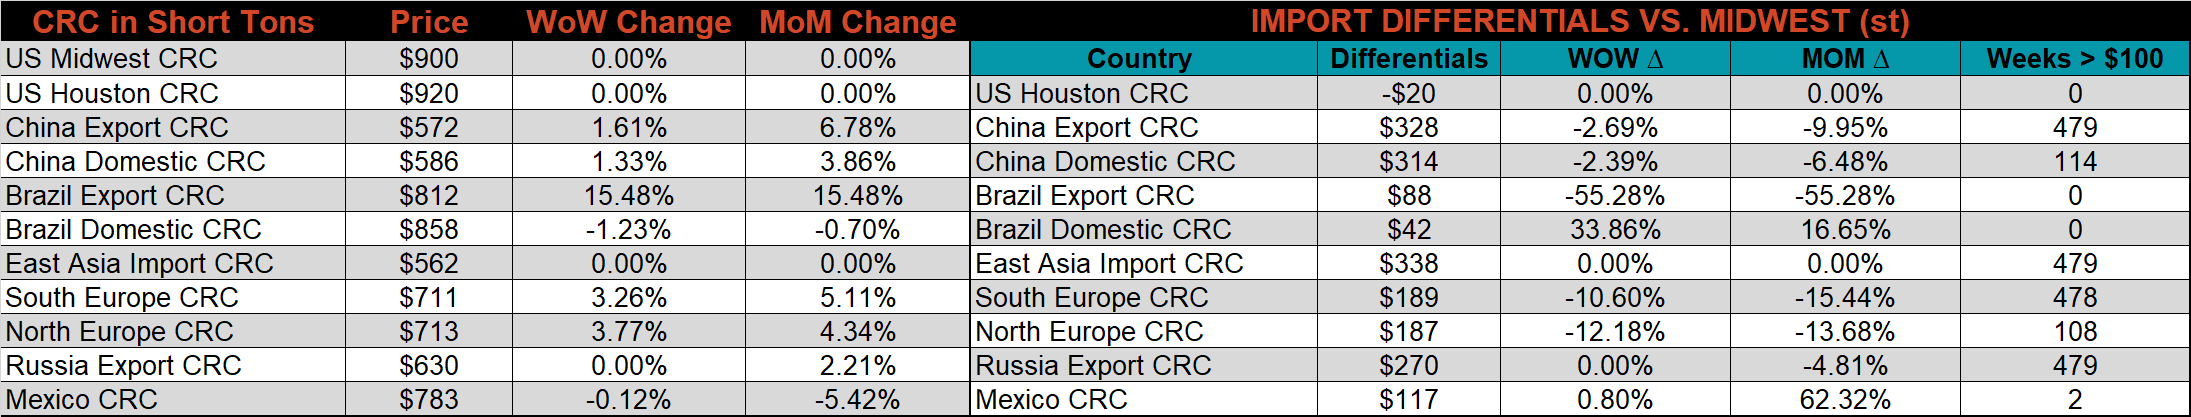
Global prices were mostly higher again this week, led by Brazilian Export CRC, up 15.5%.
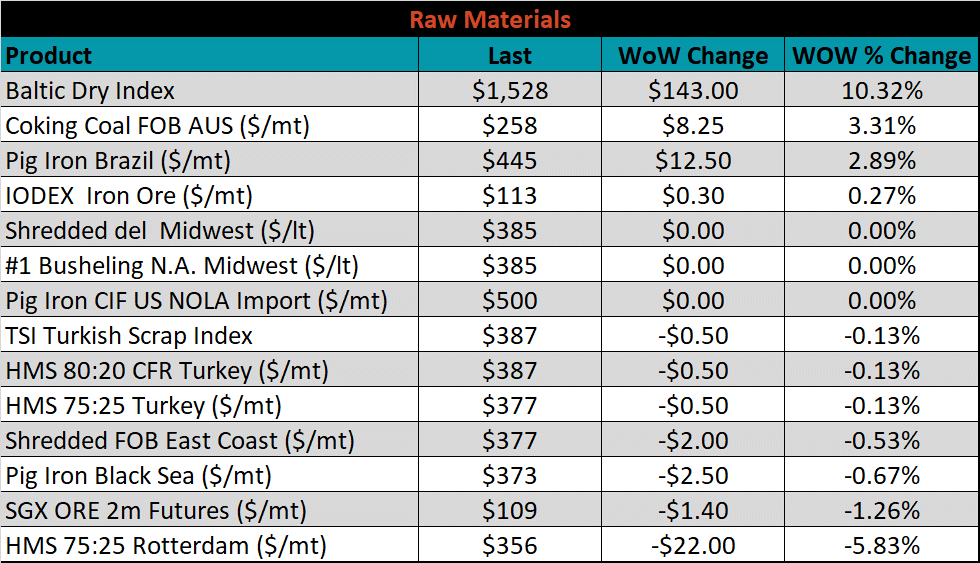
Raw material prices were mixed this week with Rotterdam HMS down 5.8%, while Aussie coking coal was up 3.3%.
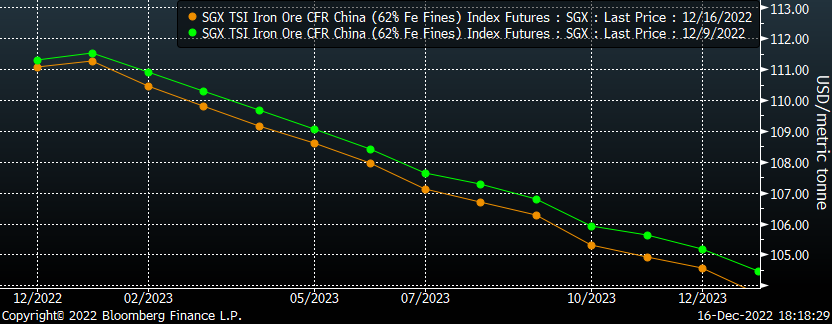
Below is the iron ore future curve with Friday’s settlements in orange, and the prior week’s settlements in green. Iron ore was down slightly across all expirations last week.
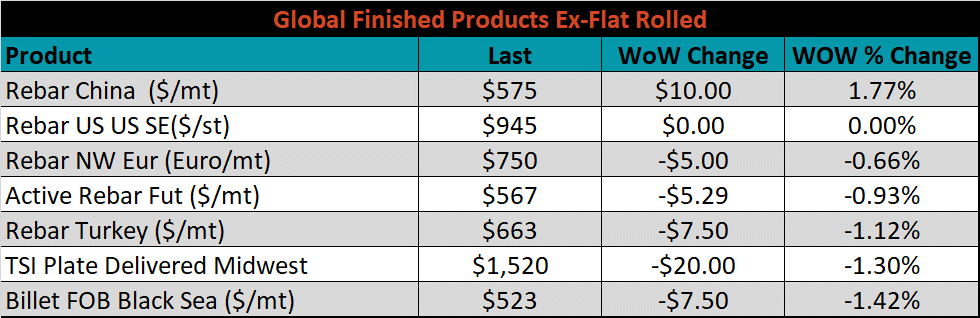
The ex-flat rolled prices are listed below.

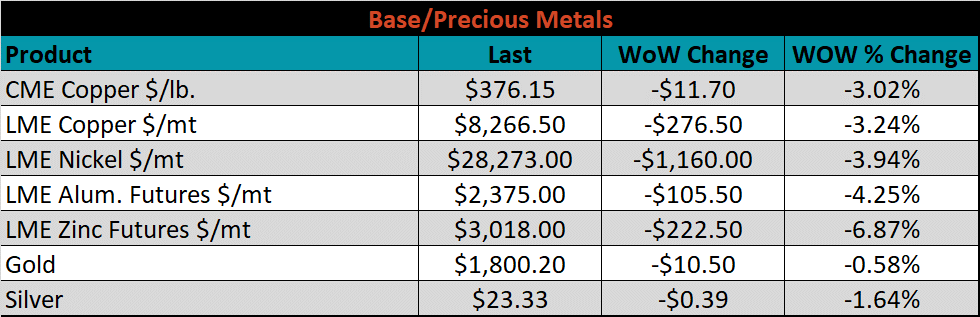
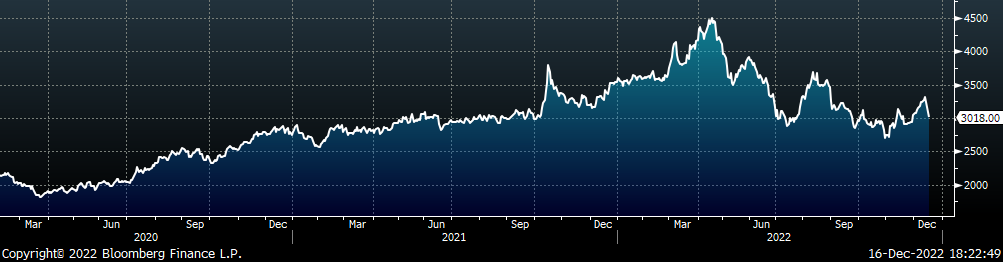
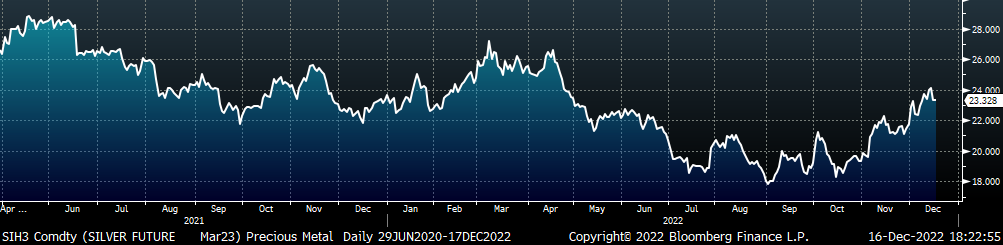
Base and precious metal futures were all lower this week, led by LME zinc down 6.9%. LME Aluminum, down 4.3% on the week, was lower on 4 of the 5 trading days. Silver and Gold, each down 1.6% and 0.6% were both under pressure after the Federal Reserve clearly indicated that they would remain steadfast in their higher for longer interest rate stance.
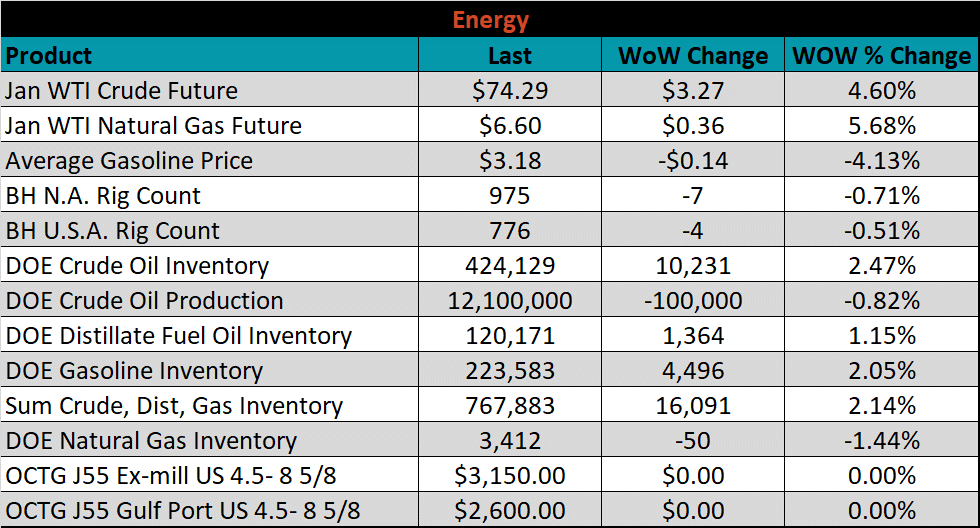
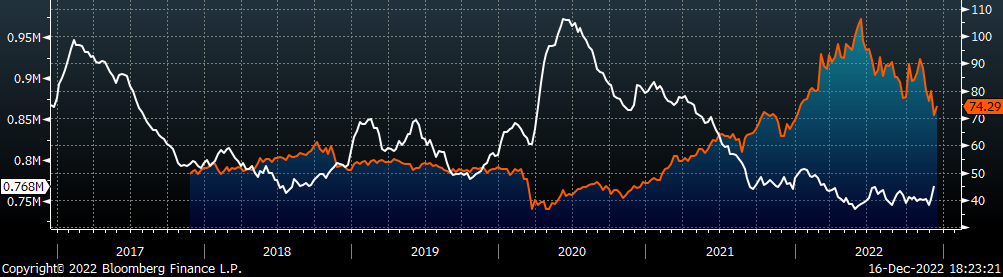
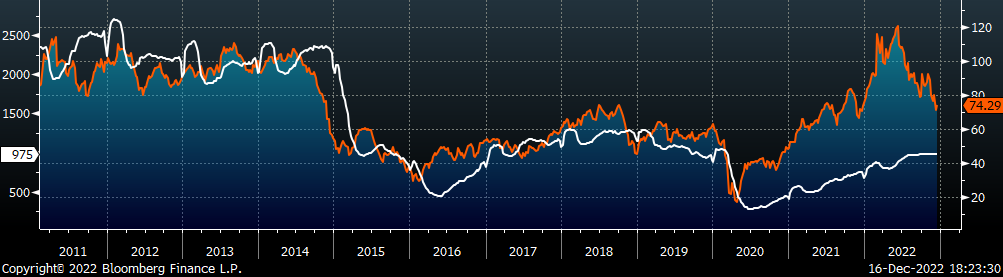
Last week, the January WTI crude oil future gained $3.27 or 4.6% to $74.29/bbl. The aggregate inventory level rose 2.1%. The Baker Hughes North American rig count decreased by 7 rigs and the U.S. rig count decreased by 4 rigs.
The list below details some upside and downside risks relevant to the steel industry. The bolded ones are occurring or highly likely.
Upside Risks:
Downside Risks: