Content
-
Weekly Highlights
- Market Commentary
- Upside & Downside Risks


In last week’s report, we referenced how many of the fundamental drivers of the U.S. domestic steel price had already begun reverting to more normal levels, namely the dynamics between lead times and mill production. In this week’s report, we will dig into another one of those drivers, imports. In the chart below we show the share of monthly flat rolled steel purchases, broken down by the percentage of imports (blue) and domestic mills (orange). The dashed line represents the 3-month moving average.
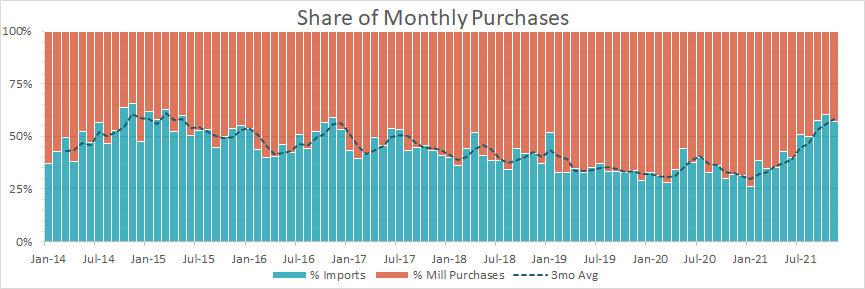
The current 3-month moving average is at the highest level of import purchases, on record, going to back to 2014. This clearly illustrates how bargaining power has shifted away from the mills and towards the buyers, since January 2021. While import price differentials were historically stretched for much of the year, the fact imports were less than 50% of purchases before July 2021 meant mills had more bargaining power. Buyers could not rely on imports to fill their material needs during the early stages of the demand driven shortage. The chart below further illustrates this point, with the Midwest HRC price (navy) and the Houston HRC price (orange).
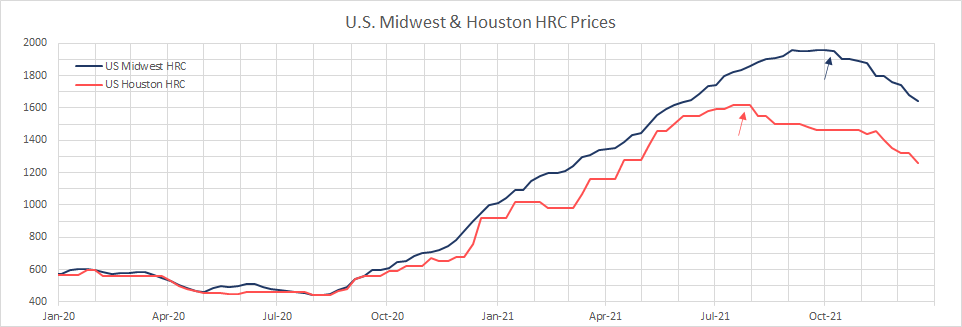
The Houston HRC price will always be more impacted by lower priced imports because that is where many of them will arrive. Here we see that as soon as imports became more than 50% of purchases and inventories began to increase, the price reacted. While supply chain issues and regional shortages initially kept the Midwest price elevated, the continued wave of arrivals and slowdown in demand caused by seasonality and the extended chip shortage, has led to falling prices. Over the coming months, as imports are expected to increase, we will closely watch the Houston price for a signal of where the Midwest price is headed. However, there is plenty of anecdotal evidence that mills are starting to price at “import busting” levels to regain some of their lost bargaining power by 2Q22.

Below are the most pertinent upside and downside price risks:
Upside Risks:
Downside Risks:

The Platts TSI Daily Midwest HRC Index decreased by another $40 to $1,640.

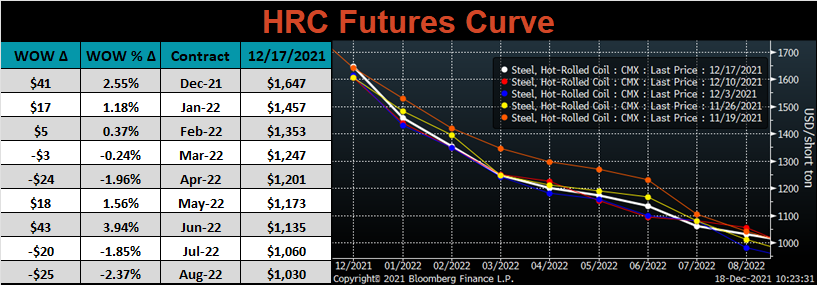
The CME Midwest HRC futures curve is below with last Friday’s settlements in white. Last week, the curve was mixed, with light volume of trades.
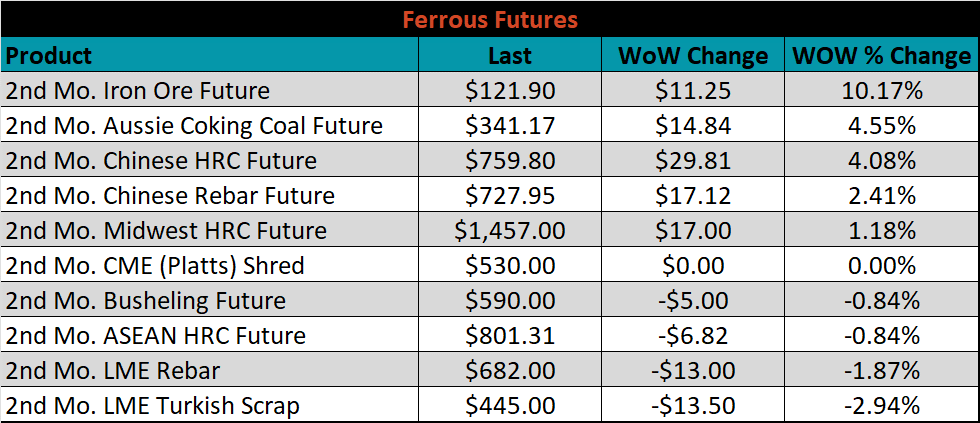
January ferrous futures were mixed, with iron ore gaining 10.2%, and LME Turkish scrap losing 2.9%.
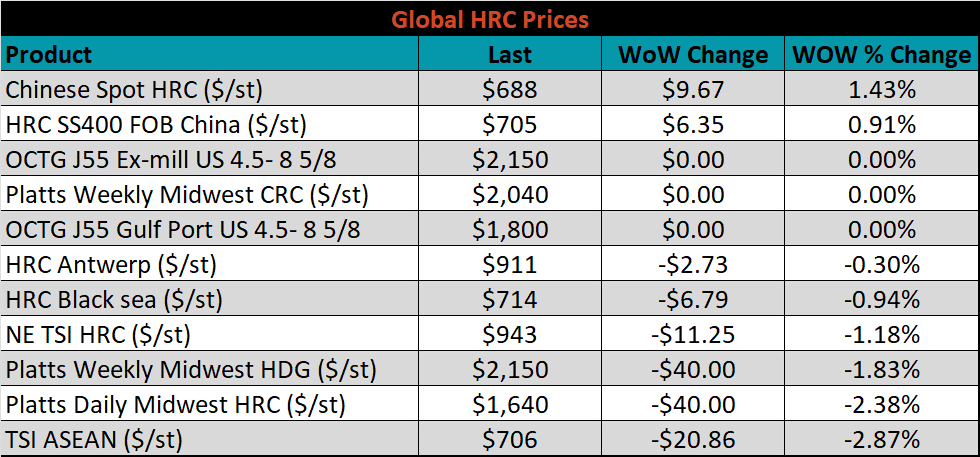
Global flat rolled indexes were mostly lower again this week, led by TSI ASEAN HRC, down 2.9%, while Chinese spot HRC was up 1.4%.
The AISI Capacity Utilization rose 0.5% to 82.4%.


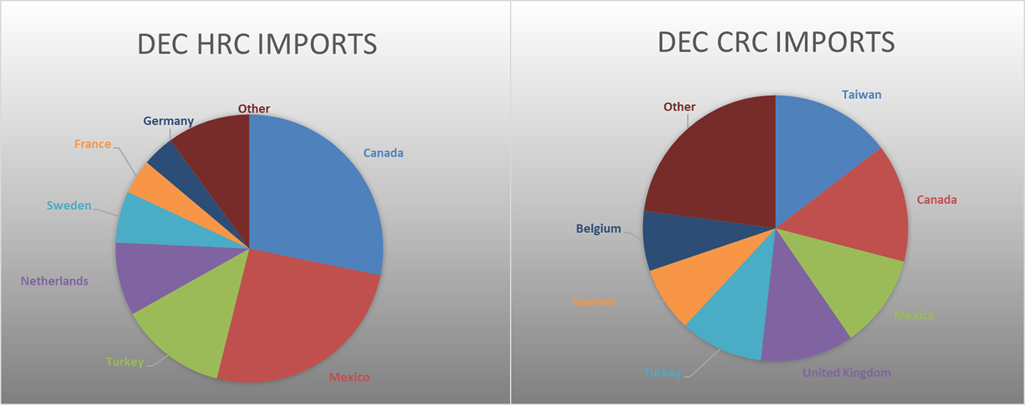
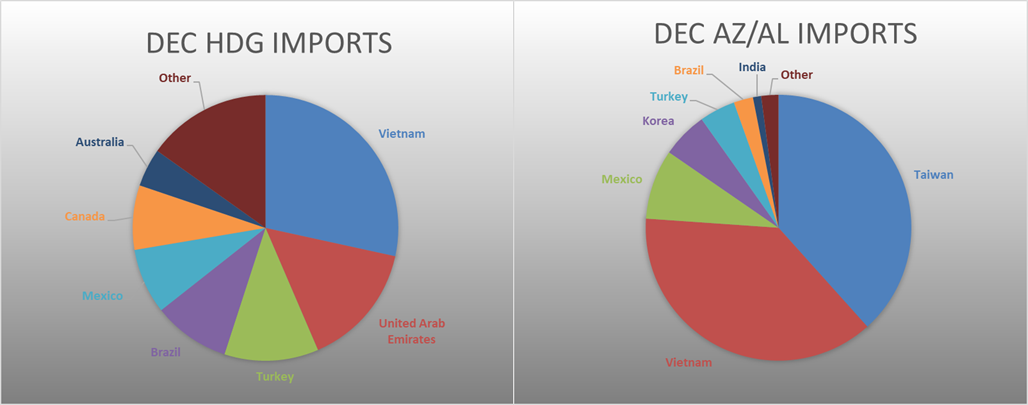
December flat rolled import license data is forecasting a decrease of 49k to 1.16M MoM.

Tube imports license data is forecasting an increase of 15k to 448k in December.


December AZ/AL import license data is forecasting an increase of 1k to 132k.

Below is December import license data through December 13th, 2021.


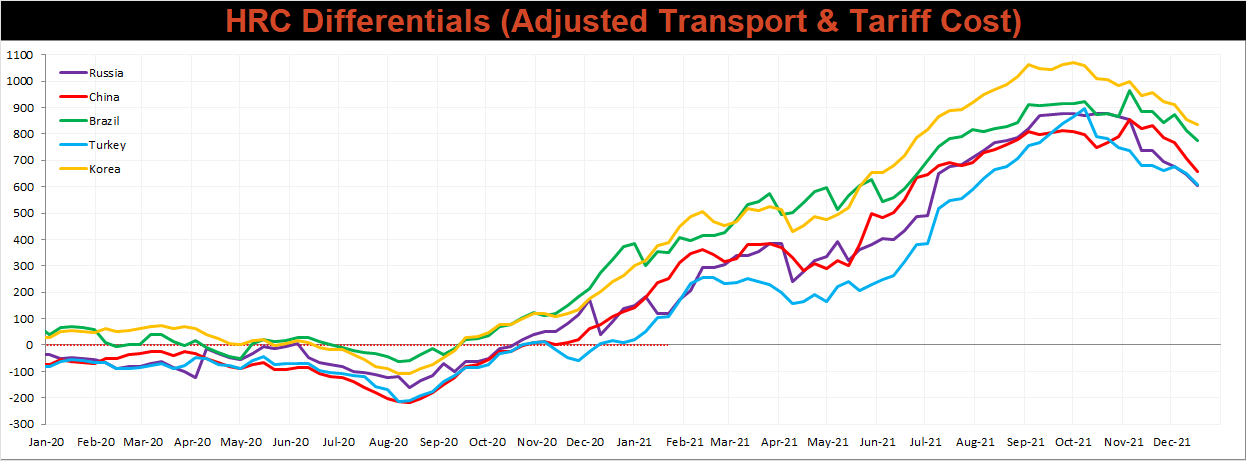
Below is the Midwest HRC price vs. each listed country’s export price using pricing from SBB Platts. We have adjusted each export price to include any tariff or transportation cost to get a comparable delivered price. All the watched countries differentials decreased for the 2nd week in a row, as the U.S. price continues to fall at a more rapid pace than other global prices.
SBB Platt’s HRC, CRC and HDG pricing is below. The Midwest HRC, and HDG prices were lower this week, down 2.4%, and 1.8%, respectively, while the CRC price was unchanged. On top of that, the Houston HRC price was down 4.6%, this price is more sensitive to inexpensive imports, because that is one of the major docks for arriving tons.


Raw material prices were mixed. The IODEX iron ore index rose 15.3%, while East Coast shredded scrap lost 2.1%.
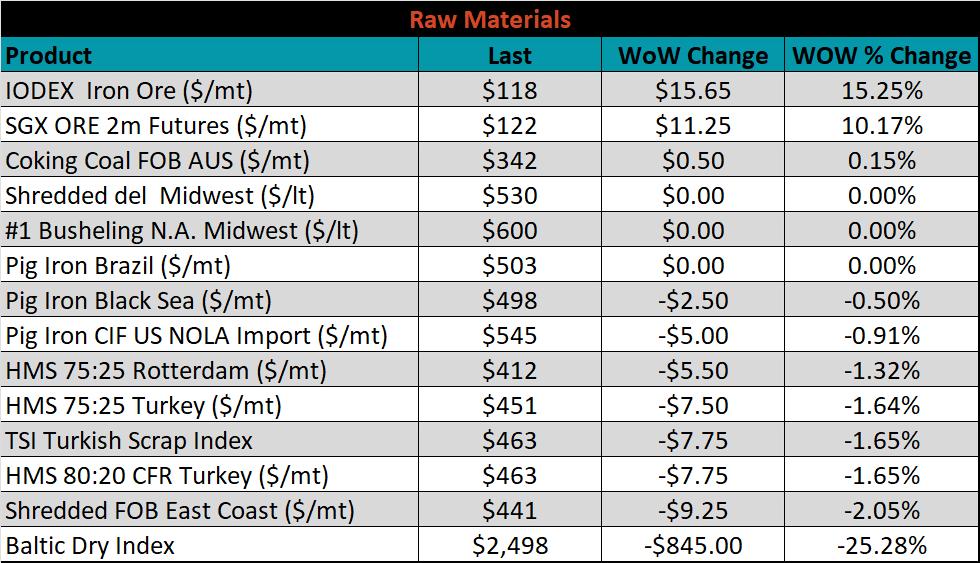
Below is the iron ore future curve with Friday’s settlements in orange, and the prior week’s settlements in green. Last week, the entire curve shifted higher again at all expirations.

The ex-flat rolled prices are listed below.


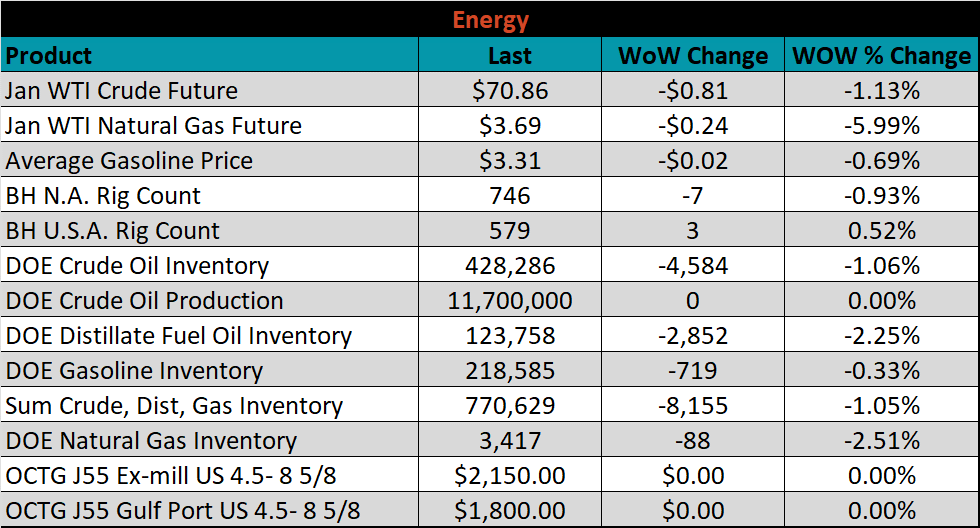
Last week, the January WTI crude oil future lost $0.81 or 1.1% to $7.86/bbl. The aggregate inventory level was down 1.1%, while crude oil production remains at 11.7m bbl/day. The Baker Hughes North American rig count was down 4 rigs, while the U.S. rig count was up 3 rigs.


The list below details some upside and downside risks relevant to the steel industry. The bolded ones are occurring or highly likely.
Upside Risks:
Downside Risks: