

December 2, 2022

Market Commentary
This month’s data shows depressed demand from the manufacturing, construction, and auto sectors. It is important to remember that an overall slowing of the economy to combat inflation is the current goal of the Federal reserve. The chart below shows the customer inventories subindex of the ISM Manufacturing PMI.
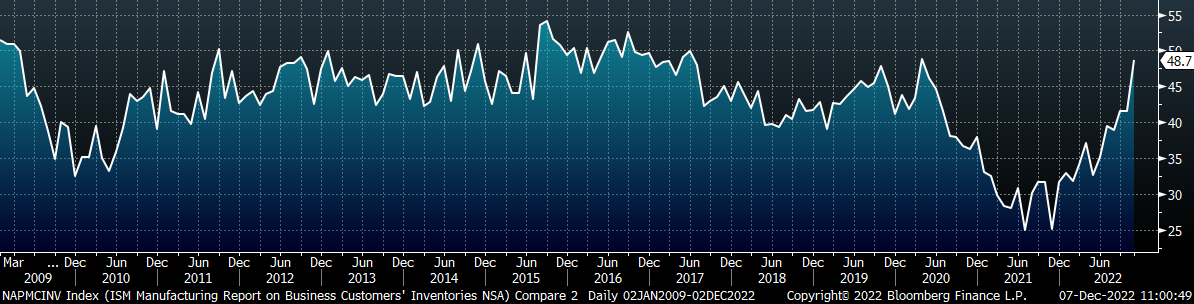
Currently, customer inventories while still categorized as “too low”, are at their highest level since April of 2020. This dynamic is going to be the biggest hurdle for mills through the first quarter. Anecdotally, the recent price hikes appear to have taken hold based on fundamental support from increasing global prices, higher input costs and a significant reduction in import arrivals. However, the chart above shows that buyers have clearly taken advantage of the recent fall in prices and will need to work through inventories before restocking in large quantities. If the mills are overeager in bringing production back online, a rally in price would be short lived.
ISM PMI
The chart below is the Platts Midwest HRC index (white) and the ISM Manufacturing PMI (orange). The HRC price has started to rebound over the last week, while the topline ISM Manufacturing PMI index is trending lower.
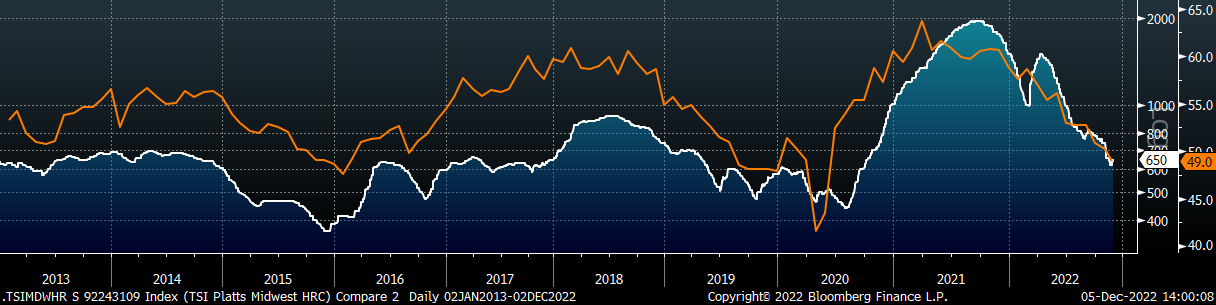
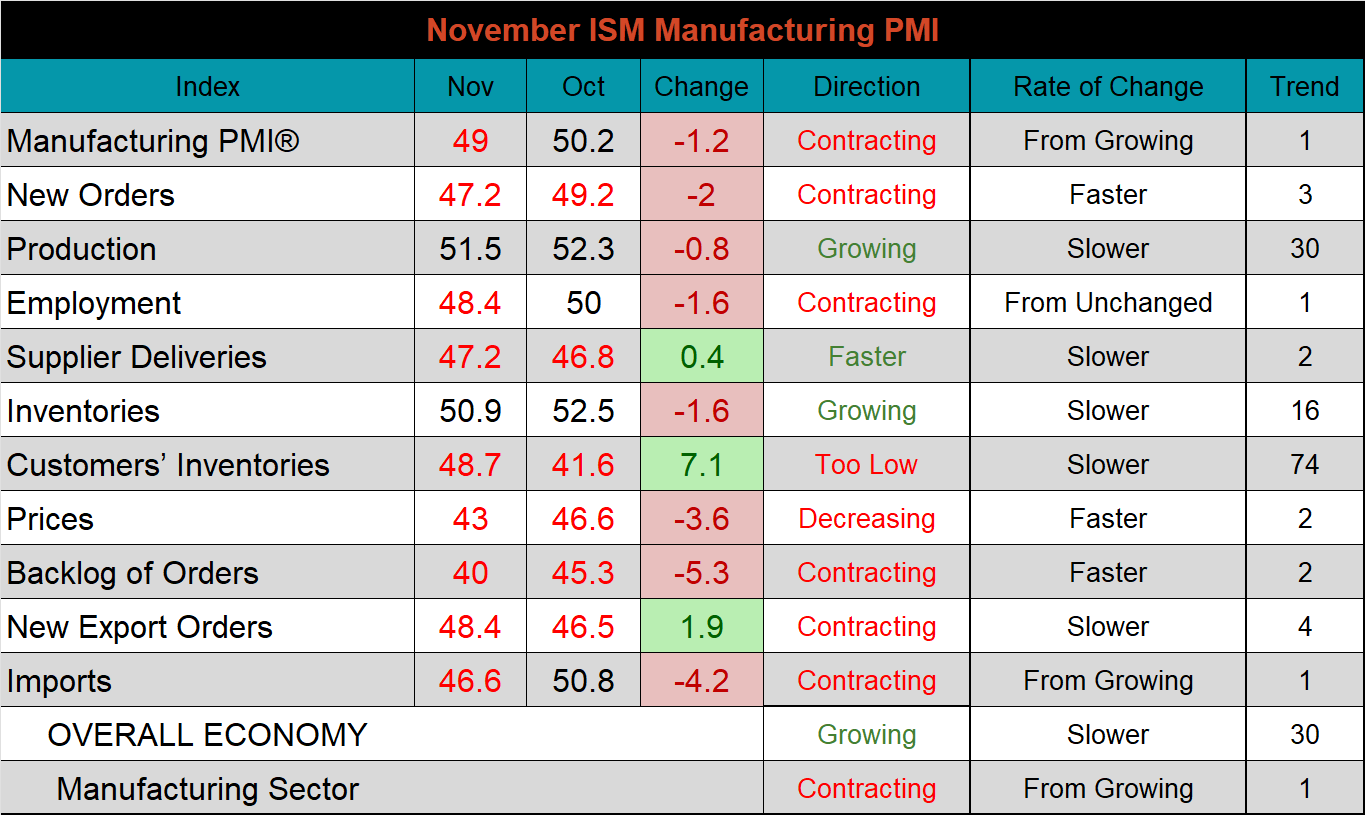
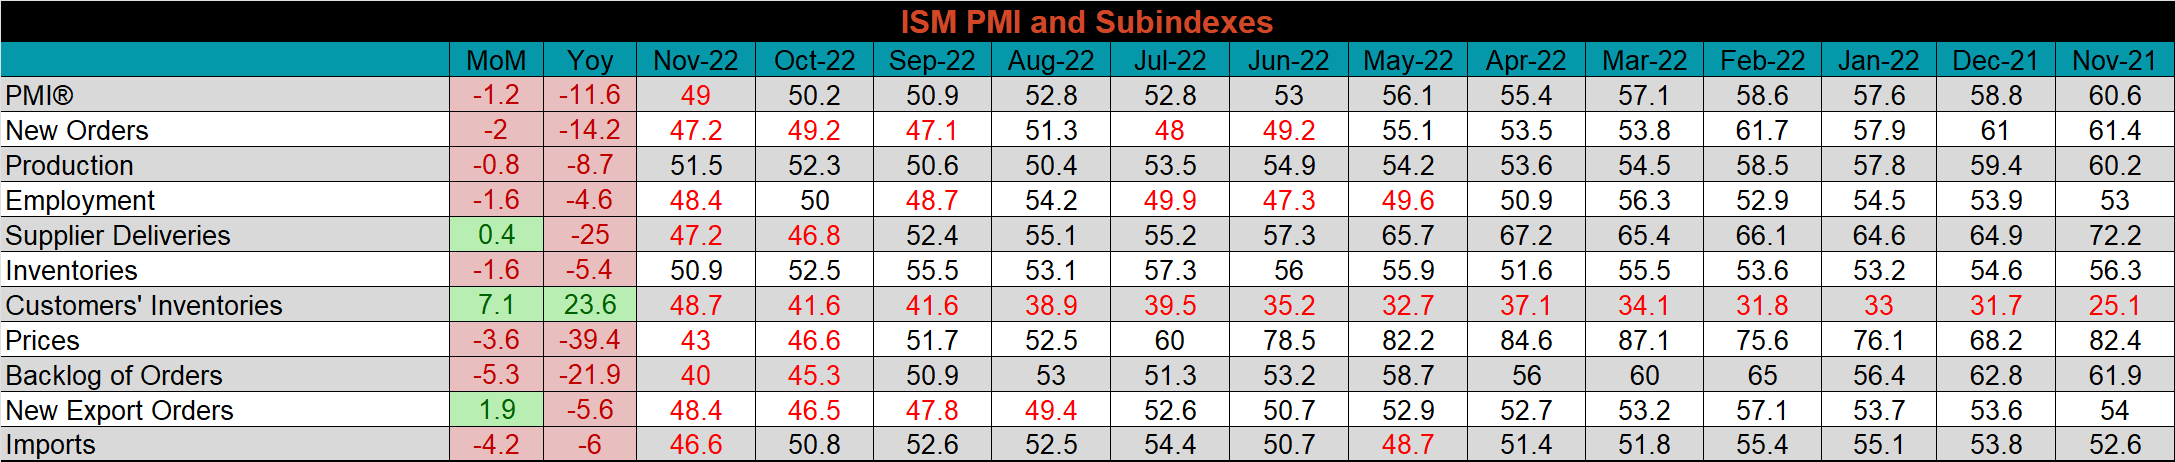
The November ISM Manufacturing PMI fell into contraction territory for the first time since May 2020 and the remaining subindexes are below.
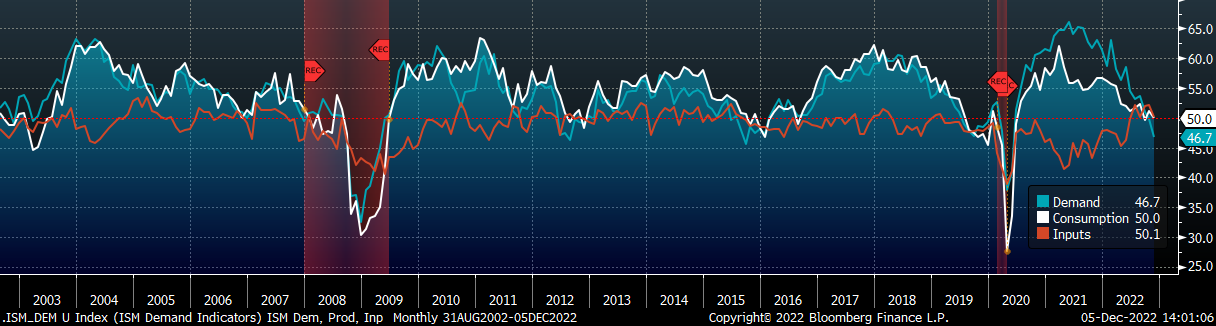
The chart below breaks down all the subcomponents of the ISM Manufacturing report into 3 categories: demand, consumption, and inputs. Of the three categories, the demand side subindexes fell most significantly, down into contraction territory. This was driven most significantly by the backlog of orders subindex falling to its lowest level since May 2020. Consumption and inputs also shifted lower, but both remain slightly in expansion territory.
ISM Manufacturing PMI: Demand (blue), Consumption (white), & Inputs (orange)
The table below shows the historical values of each subindex over the last twelve months.
Global PMI
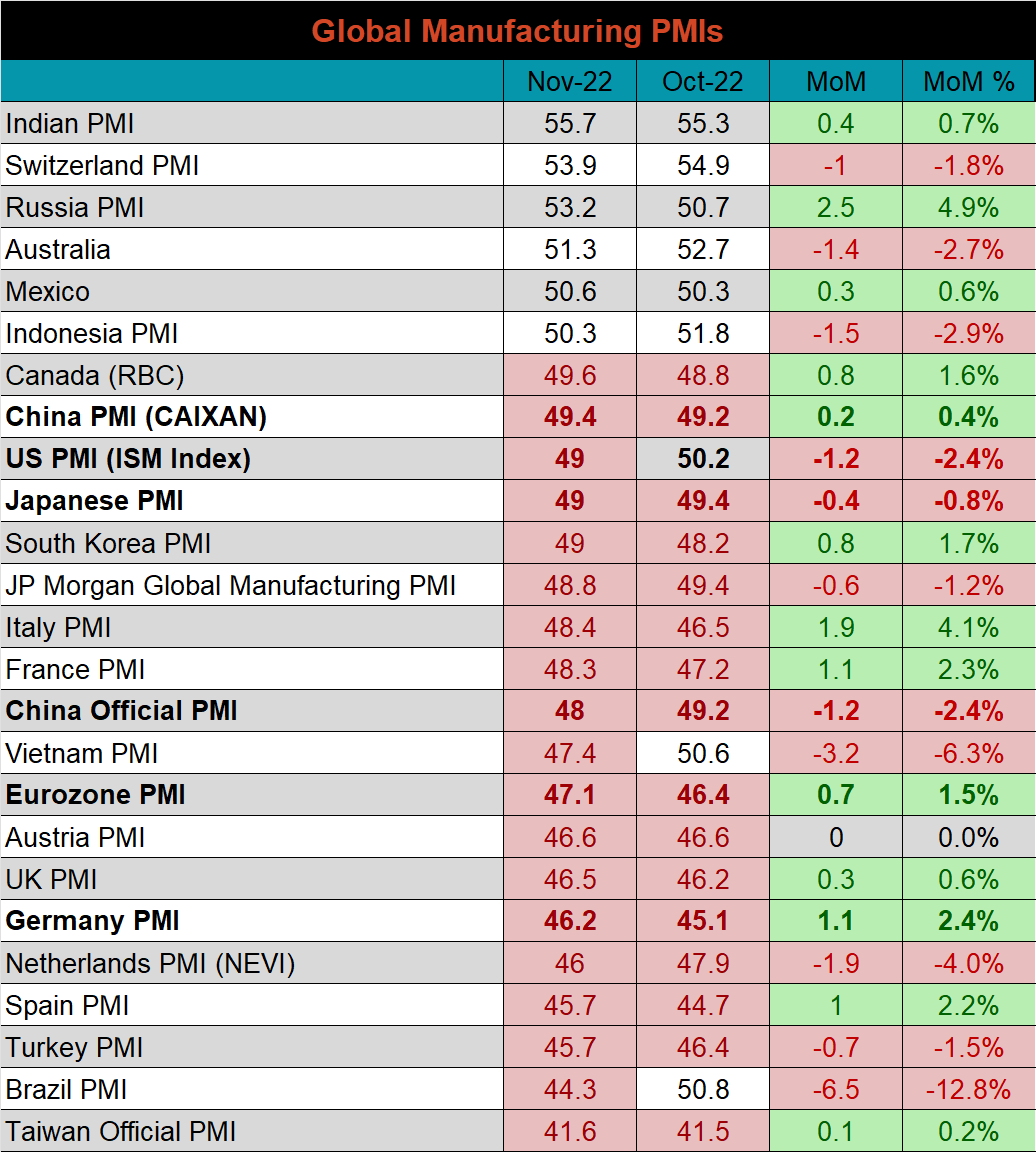
November global PMI data continues to show broad contraction in global manufacturing. 56% of the monitored global manufacturing sectors showed MoM increases, but 17 of the 23 and all the closely watched countries (bold) are in contraction territory.
Eurozone (white), German (orange), Italian (green), Spanish (red), and French (blue), U.K. (teal) Manufacturing PMIs

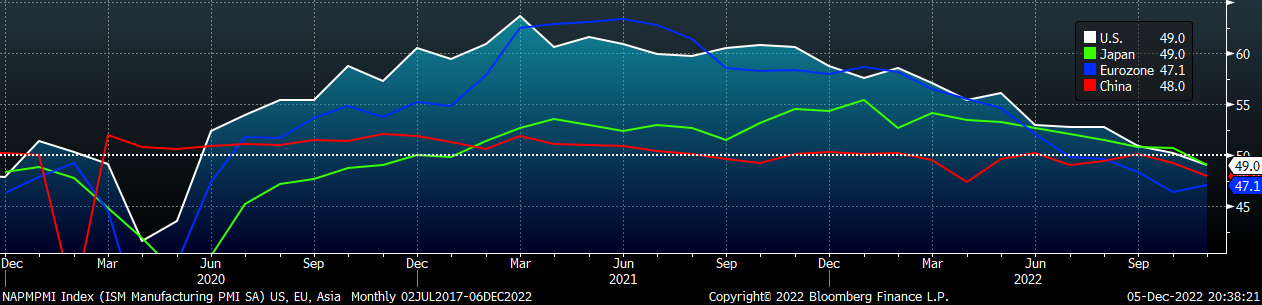
US (white), Euro (blue), Chinese (red) and Japanese (green) Manufacturing PMIs
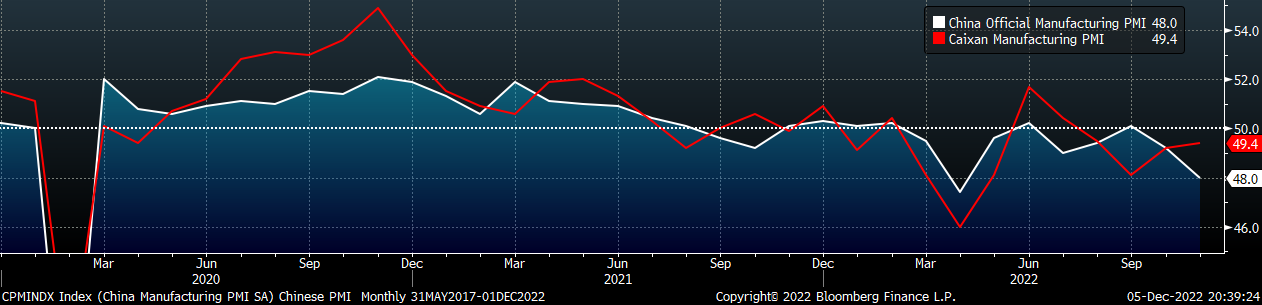
The Caixin PMI was slightly higher, but it and the Chinese official PMI index remain in contraction territory.
China Official (white) and Caixan (red) Manufacturing PMIs
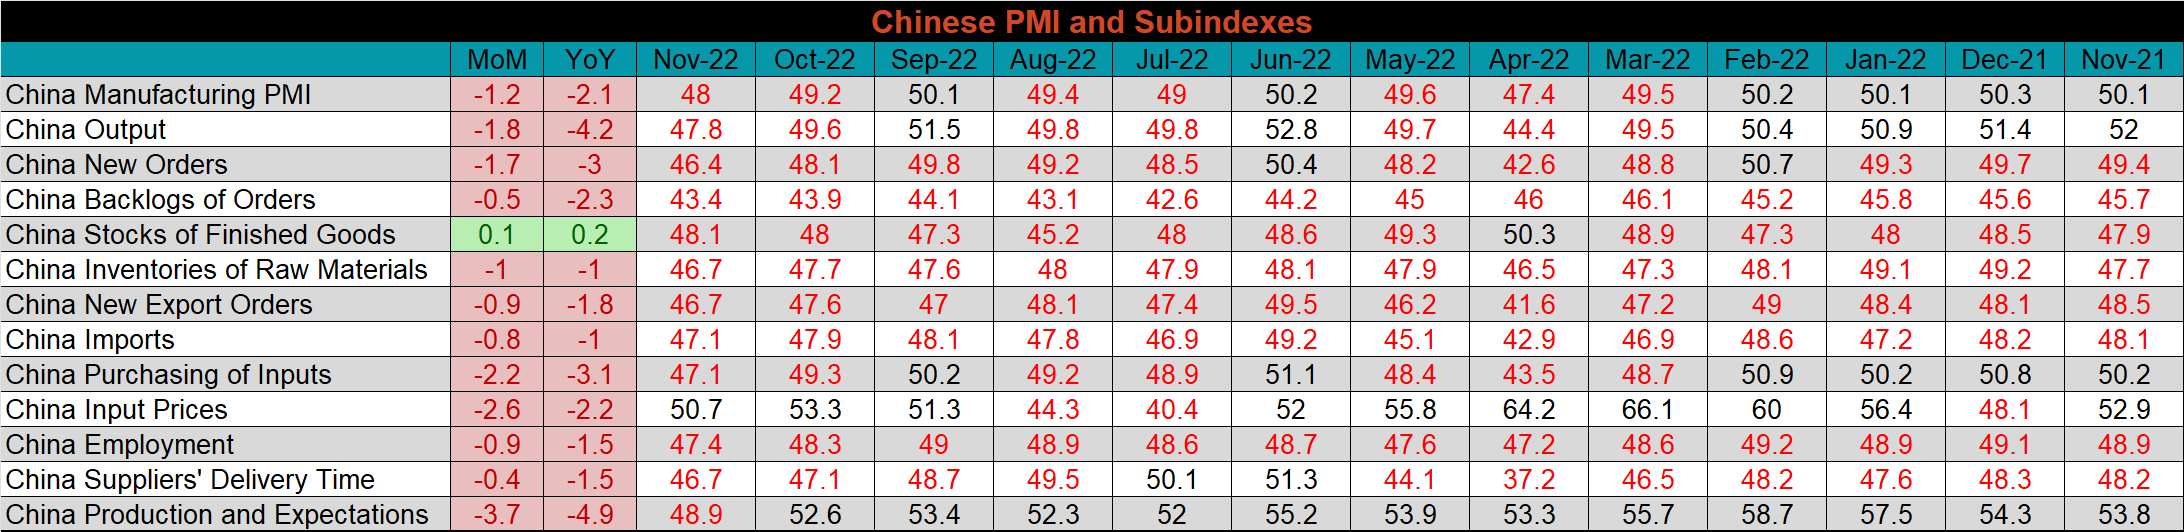
The table below breaks down China’s official manufacturing PMI subindexes. The Chinese manufacturing sector continues to be under significant pressure and has been in contraction in 7 of the last 7 months. The only subindex that saw a MoM or YoY increase was “stocks of finished goods”.
Construction Spending
October U.S. Construction Spending
October seasonally adjusted U.S. construction spending was down 0.3% MoM, but it remains 9.2% above last year’s spending level. This is now the 4th month in a row that seasonally adjusted growth was negative.
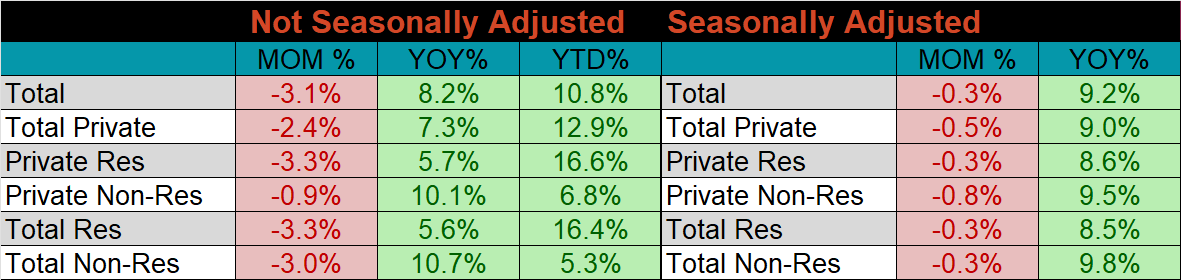
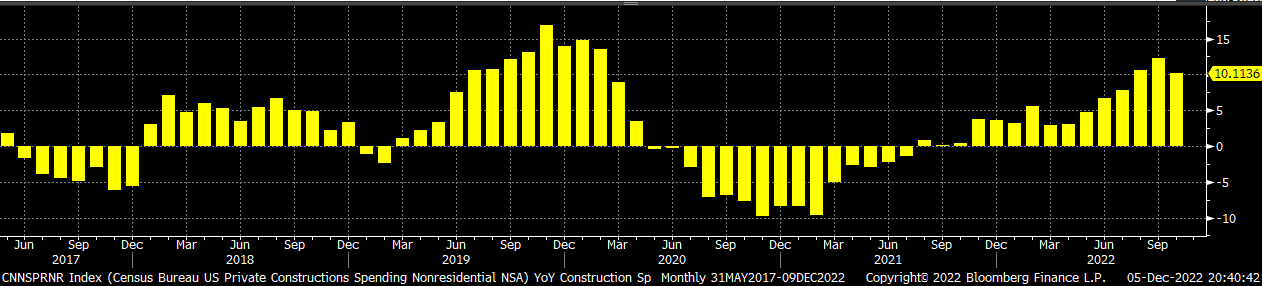
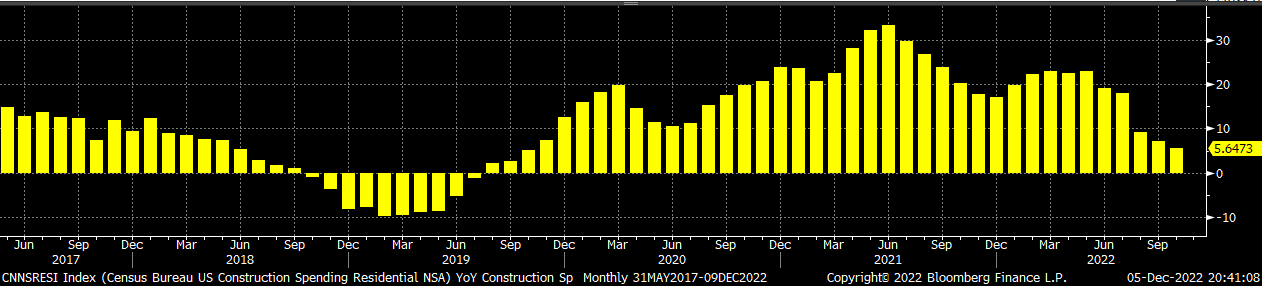
The charts below show the YoY changes in construction spending. Both residential and non-residential spending are above last year’s levels, however both are now trend towards slower growth.
U.S. Private Nonresidential Construction Spending NSA YoY % Change
U.S. Residential Construction Spending NSA YoY % Change
Auto Sales
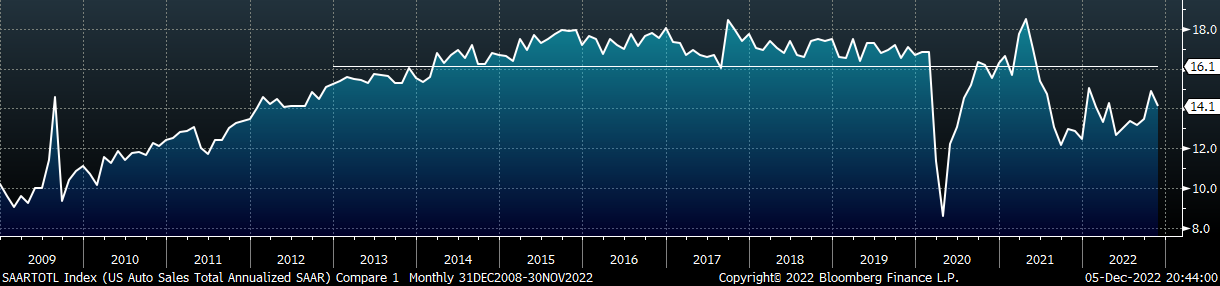
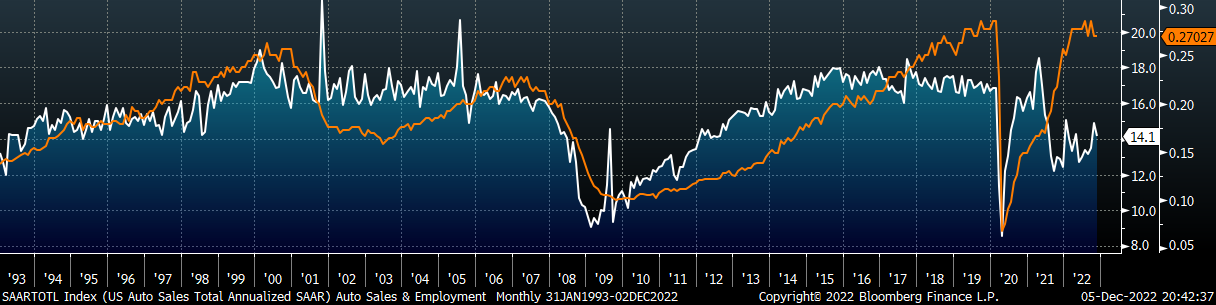
October U.S. light-vehicle sales decreased to a 14.1M seasonally adjusted annualized rate (S.A.A.R). This was below expectations of 14.5M, as well as the 10-year average of 16.1M. The second chart shows the relationship between the unemployment rate and auto sales. The unemployment rate is inverted to show that declining unemployment typically leads to increasing auto sales. This month’s jobs report showed a labor market that has been remarkably resilient, with the November unemployment rate steady at 3.7%. In the short-term, low unemployment implies increased demand for cars, however if the labor market does not start to meaningfully cool down, the risk of the Federal Reserve overshooting with interest rate hikes increases.
November U.S. Auto Sales (S.A.A.R.)
November U.S. Auto Sales (white) and the Inverted Unemployment Rate (orange)
Risks
Below are the most pertinent upside and downside price risks:
Upside Risks:
- A sudden dovish shift in financial policy leading to less aggressive rate hikes
- Strategic outages overshooting and causing production to fall below demand levels
- Easing supply chain restraints and labor shortages causing an increase in activity
- Energy issues abroad curtailing global production
- China reopening its economy with further stimulus measures
Downside Risks:
- Economic slowdown caused by increasing interest rates and sustained restrictive policy from the Federal Reserve
- Decreasing input costs allowing mills to aggressively sell lower while remaining profitable
- Increased domestic production capacity leading to an increase in competitive pricing
- Sustained levels of import arrivals keeping pressure on domestic mill pricing
- Limited desire to restock and persistently short lead times causing a “Buyer’s Strike”
HRC Futures
All of the below data points are as of December 2, 2022.
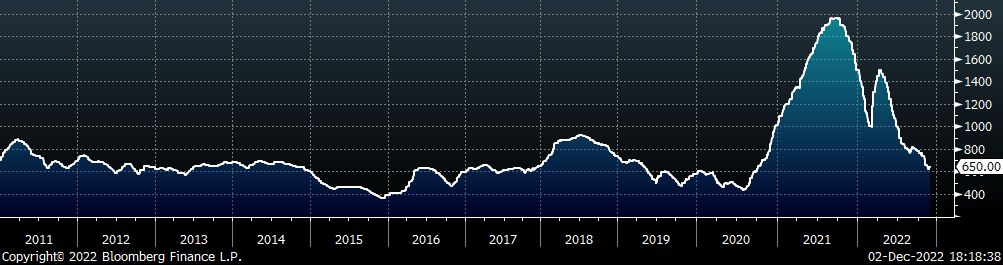
The Platts TSI Daily Midwest HRC Index was up $30 this week, ending at $650. This was the first time the spot price rose in 11 weeks.
Platts TSI Daily Midwest HRC Index
The CME Midwest HRC futures curve is below, with last Friday’s settlements in white. The entire curve shifted higher again this week.
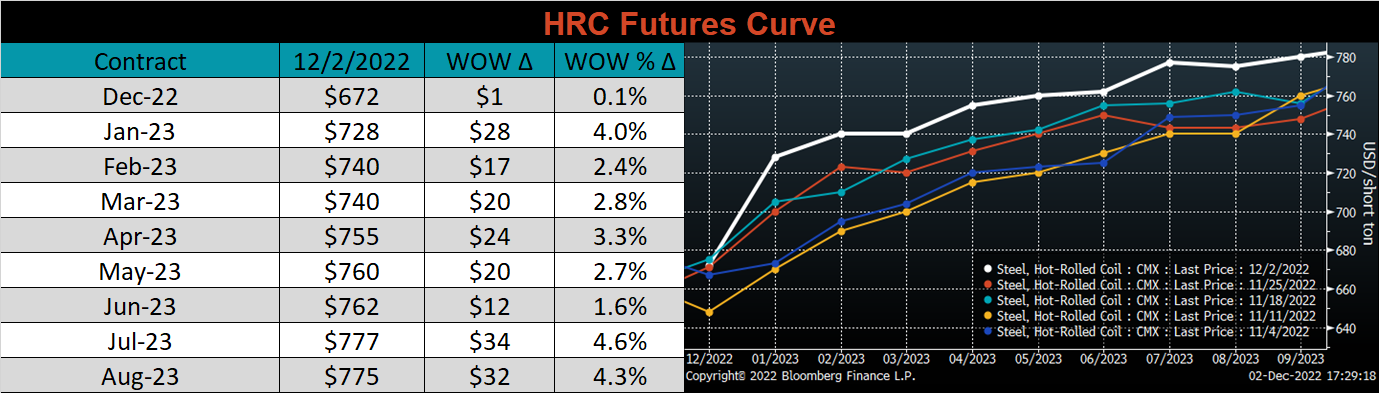
The 2nd month ferrous futures ended the week higher, led by Midwest HRC, up 8.5%.
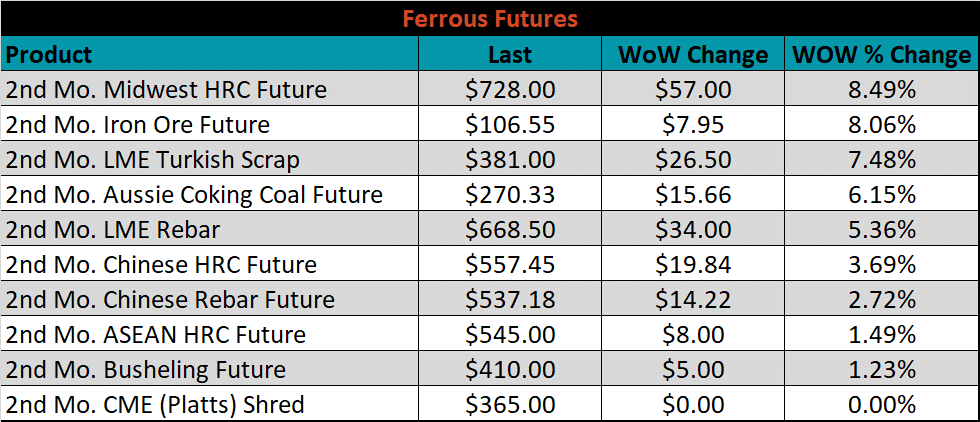
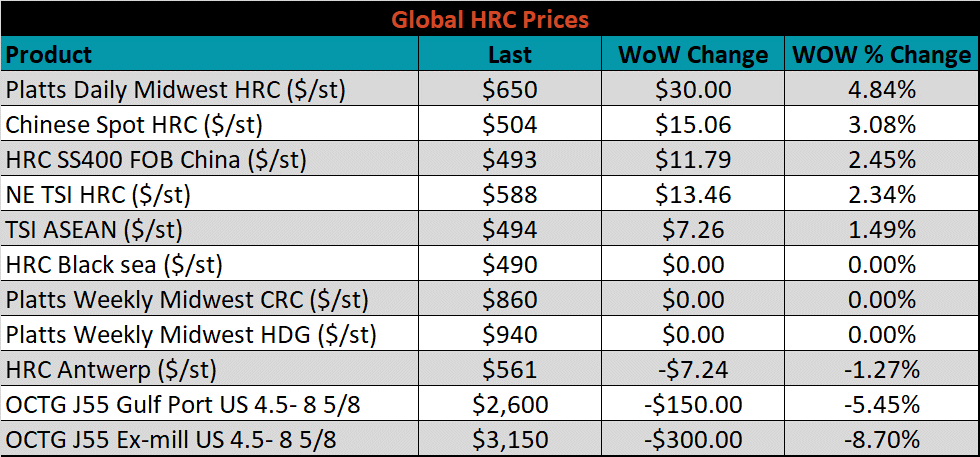
Global flat rolled indexes were mixed last week, Midwest HRC was up 4.8%, while Antwerp HRC was down 1.3% and U.S. domestic tube was down 8.7%.
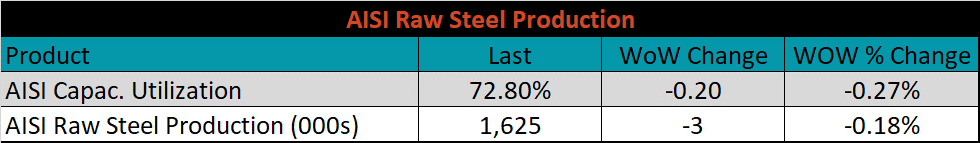
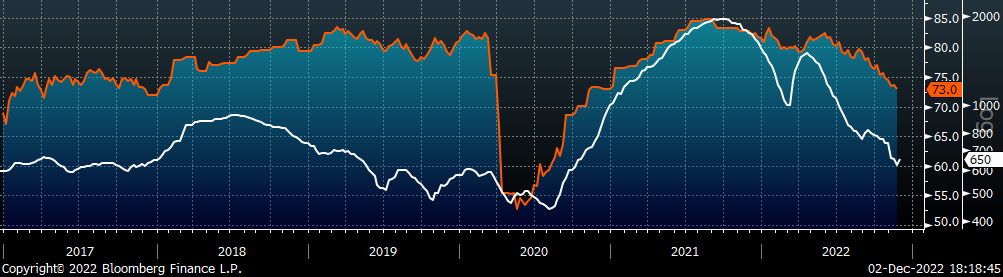
The AISI Capacity Utilization was down another 0.2% to 72.8%.
AISI Steel Capacity Utilization Rate (orange) and Platts TSI Daily Midwest HRC Index (white)
Imports & Differentials
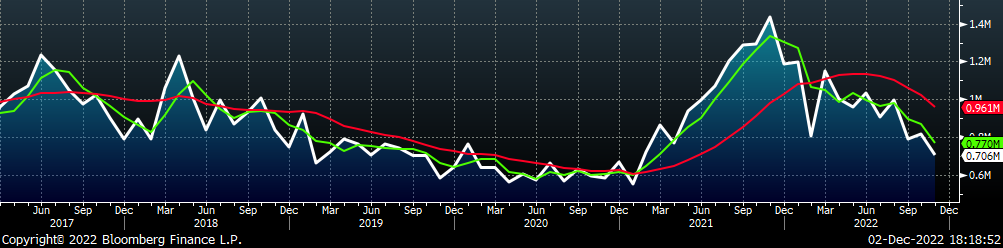
November flat rolled import license data is forecasting a decrease of 109k to 706k MoM.
All Sheet Imports (white) w/ 3-Mo. (green) & 12-Mo. Moving Average (red)
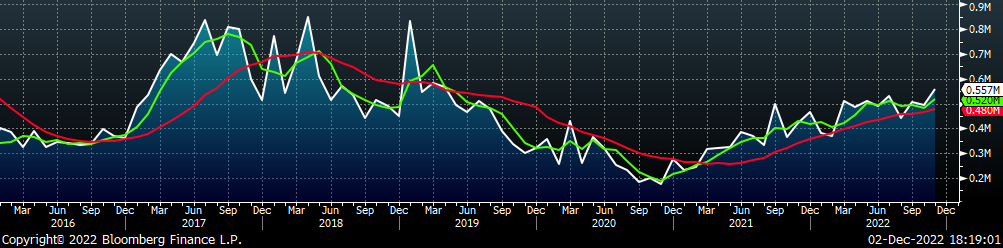
Tube imports license data is forecasting an increase of 62k to 557k in November.
All Tube Imports (white) w/ 3-Mo. (green) & 12-Mo. Moving Average (red)
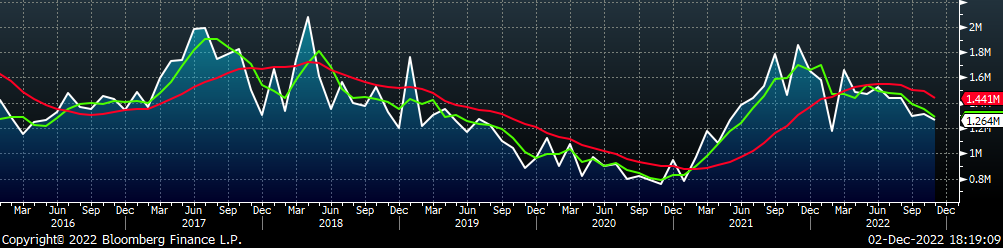
All Sheet plus Tube (white) w/ 3-Mo. (green) & 12-Mo. Moving Average (red)
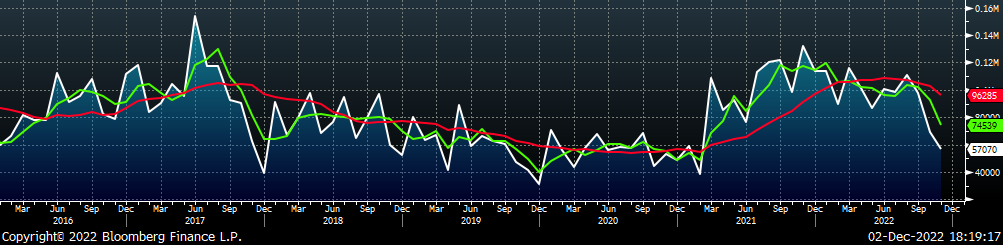
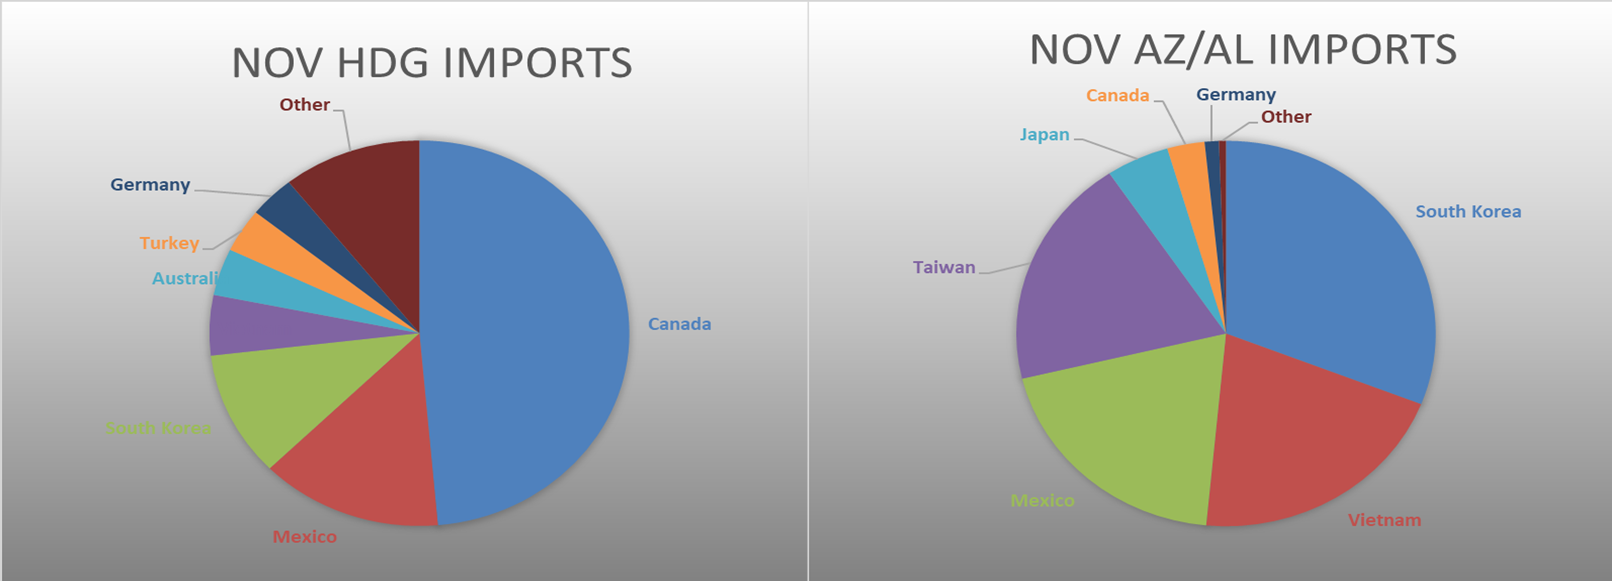
November AZ/AL import license data is forecasting a decrease of 12k to 57k.
Galvalume Imports (white) w/ 3 Mo. (green) & 12 Mo. Moving Average (red)
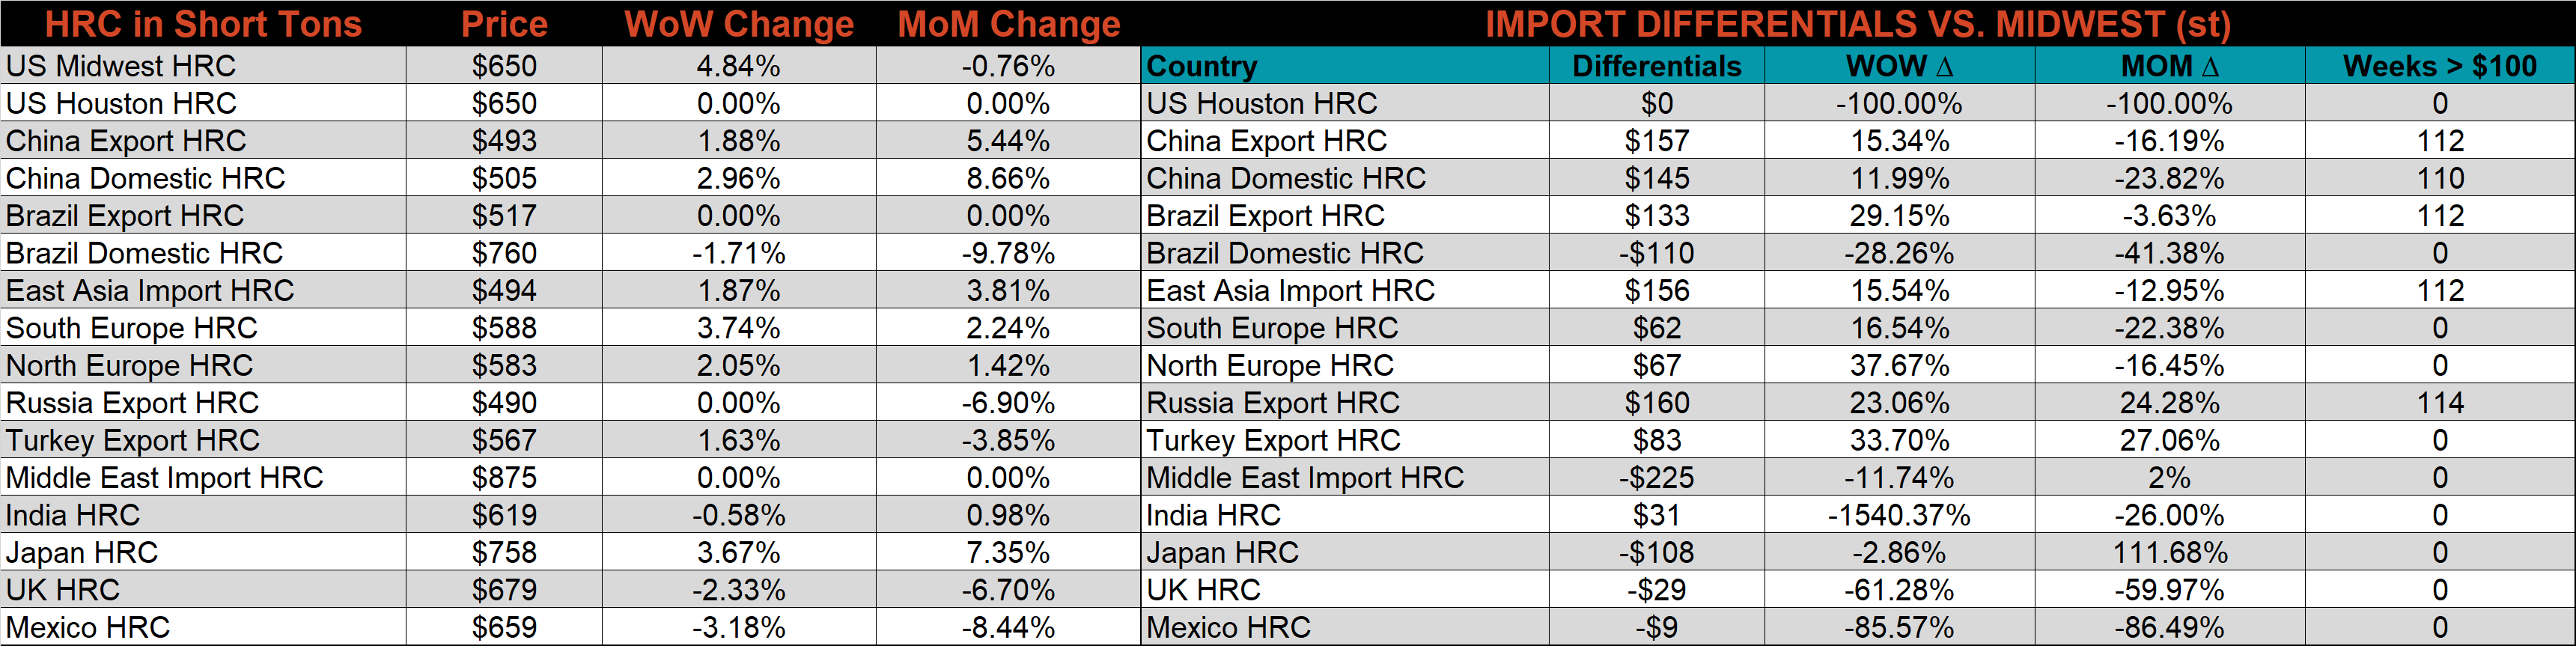
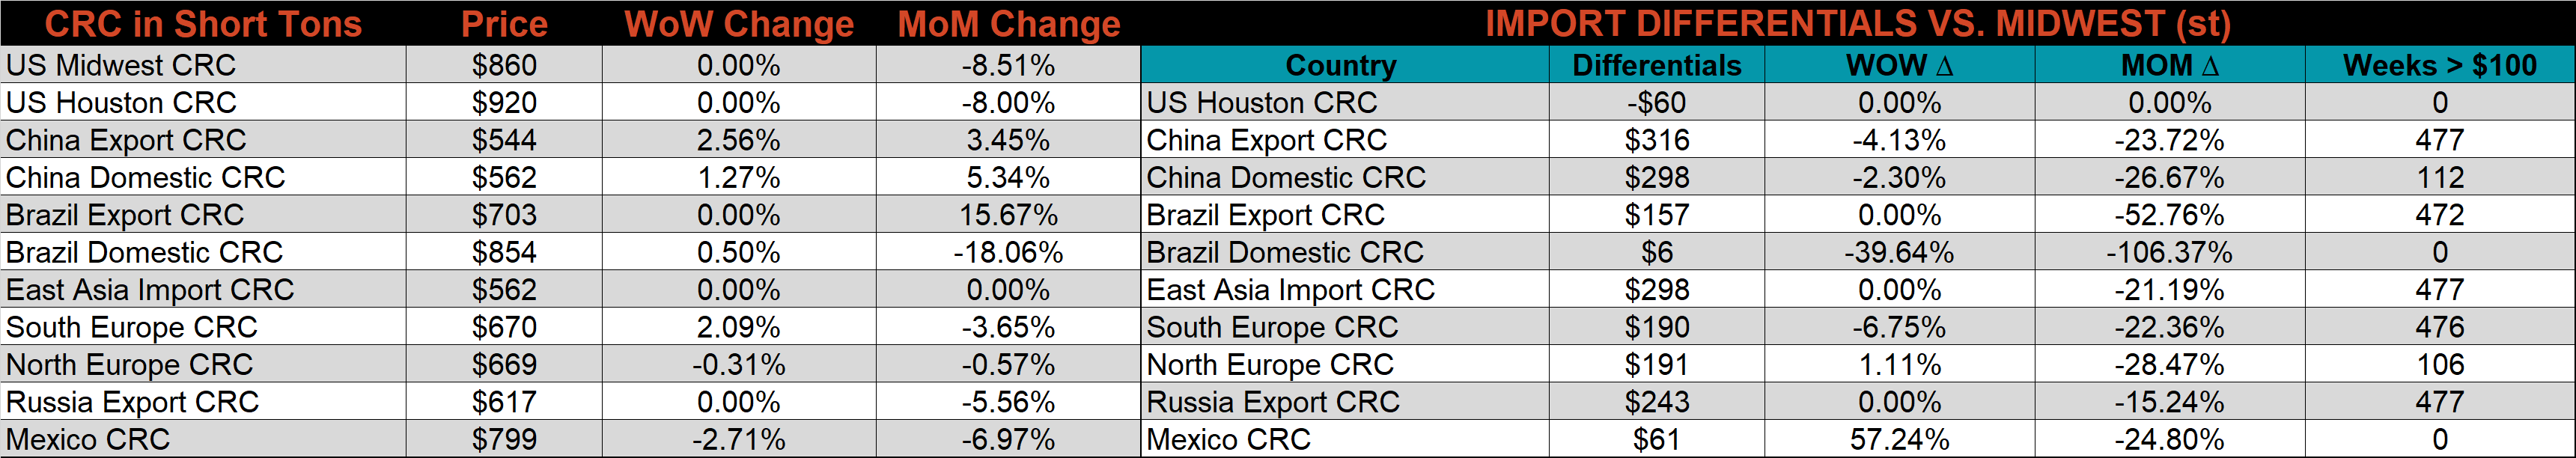
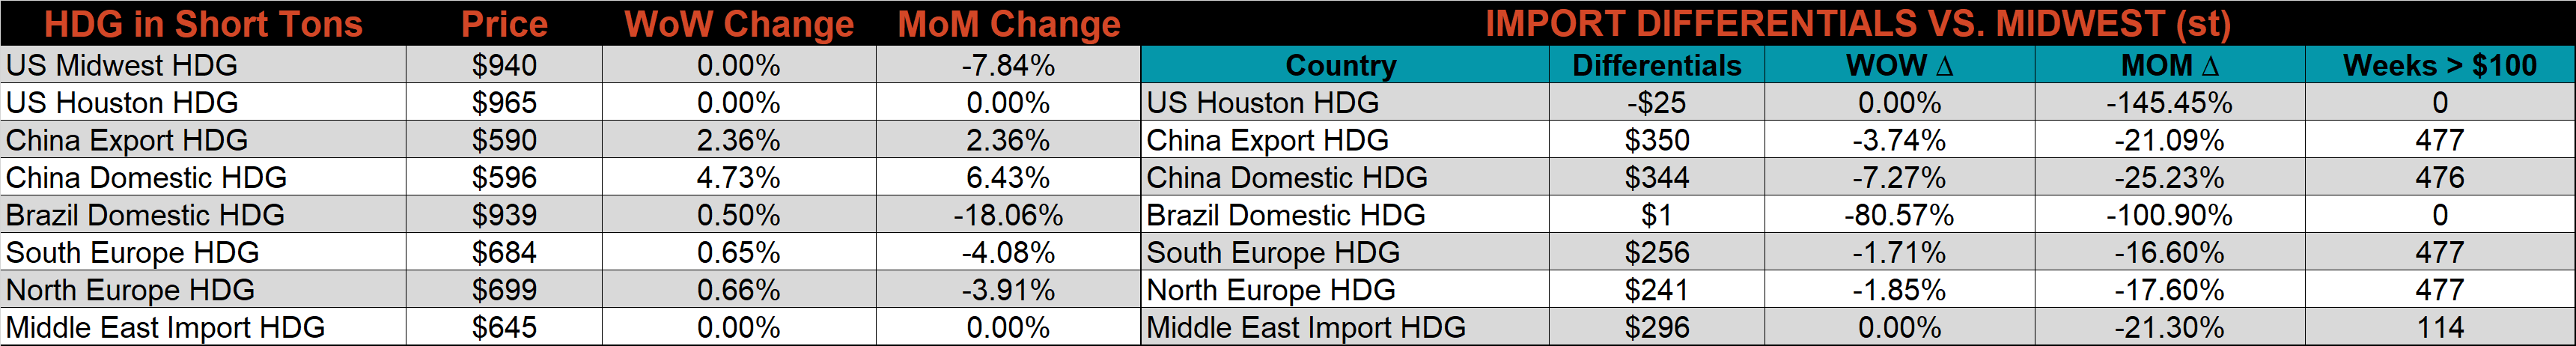
Below is November import license data through November 27th, 2022.
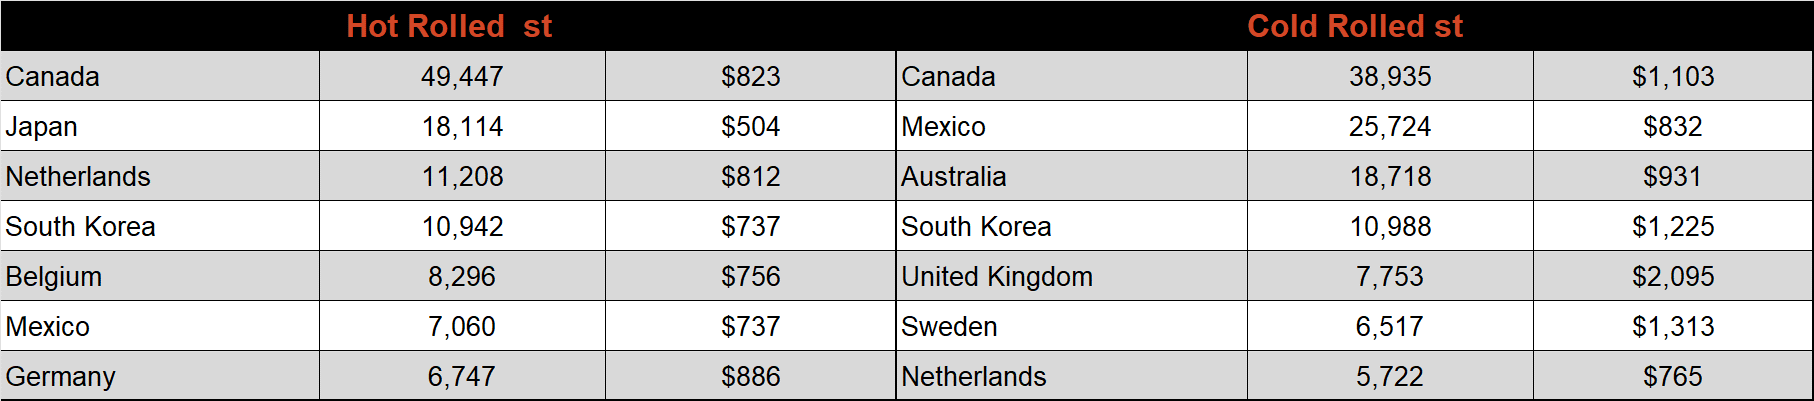
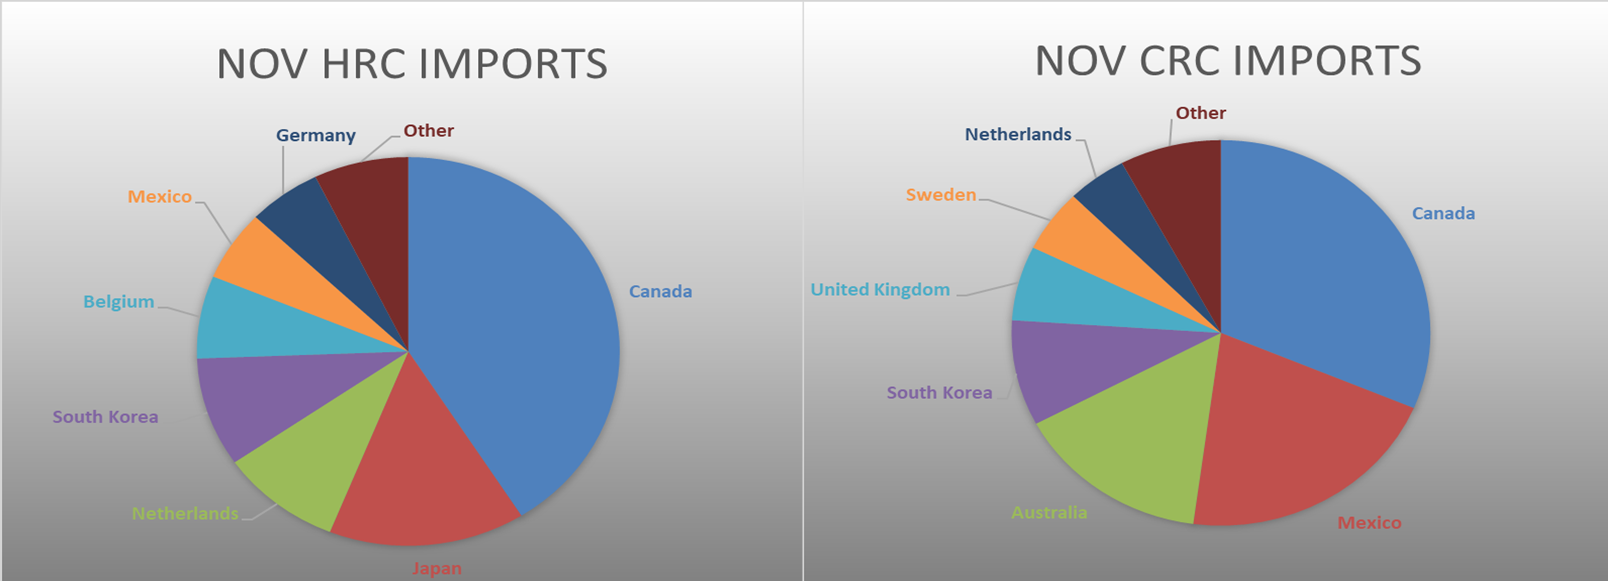
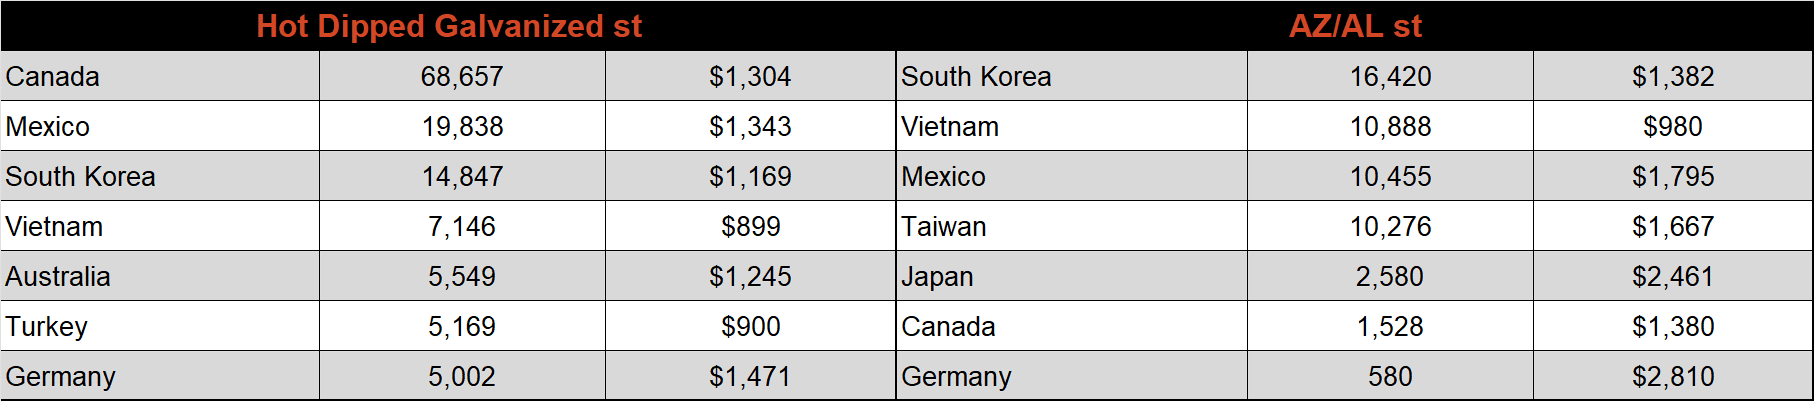
Below is the Midwest HRC price vs. each listed country’s export price using pricing from SBB Platts. We have adjusted each export price to include any tariff or transportation cost to get a comparable delivered price. All the global differentials increased this week, as the U.S. domestic price increased more significantly than the rest of the world. Even after the increase, however, only Korea and Brazil have positive price differentials with the U.S.
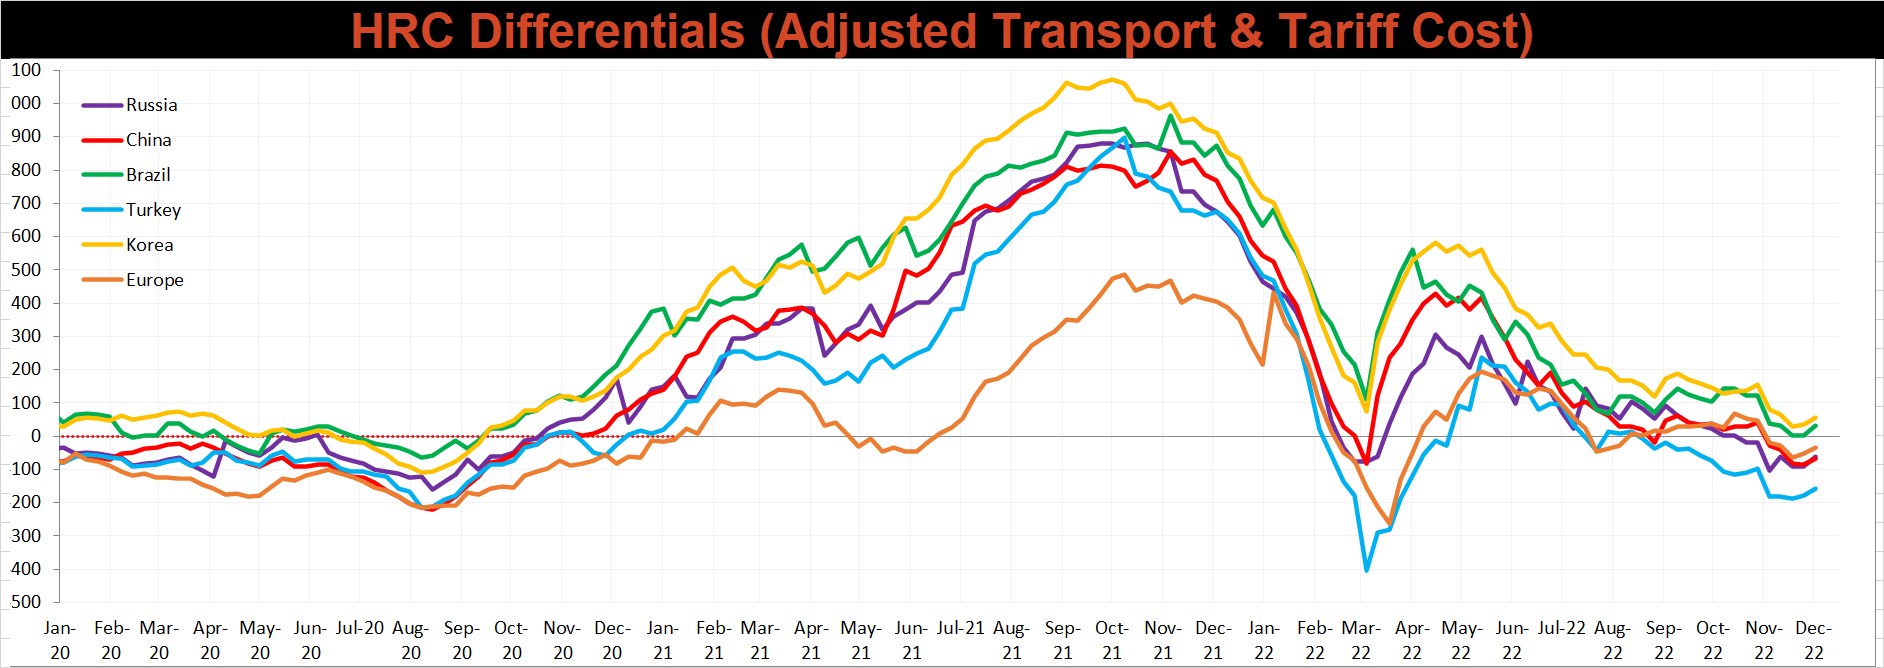
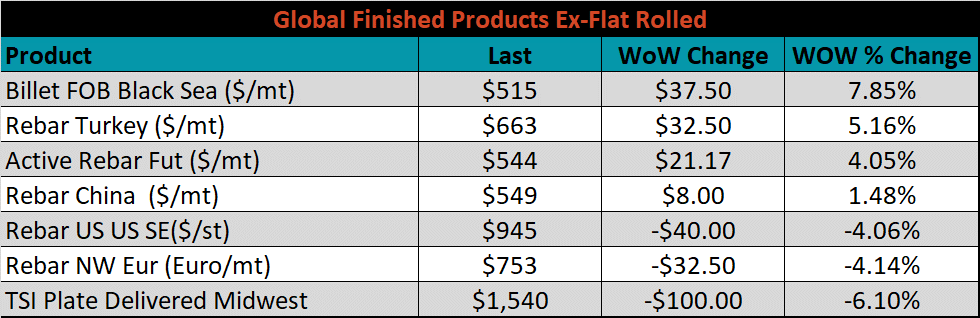
Global prices were mostly higher this week, led by Southern European HRC, up 3.7%.
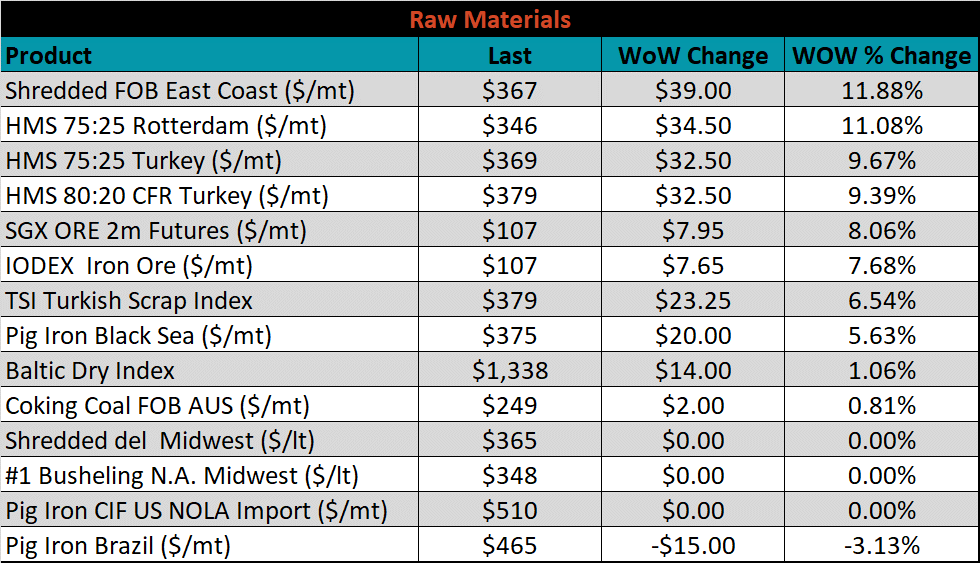
Raw Materials
Raw material prices were mostly higher this week, led by East Coast shredded, up 11.9%, while Brazilian pig iron was down 3.1%.
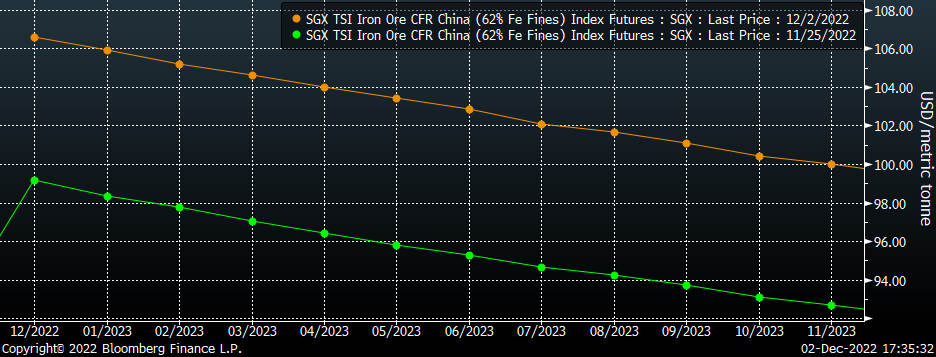
Below is the iron ore future curve with Friday’s settlements in orange, and the prior week’s settlements in green. Iron ore shifted sharply higher again at all expirations last week, the sustained rally has been mostly driven by China reopening their economy and supporting the struggling real estate sector.
SGX Iron Ore Futures Curve
The ex-flat rolled prices are listed below.


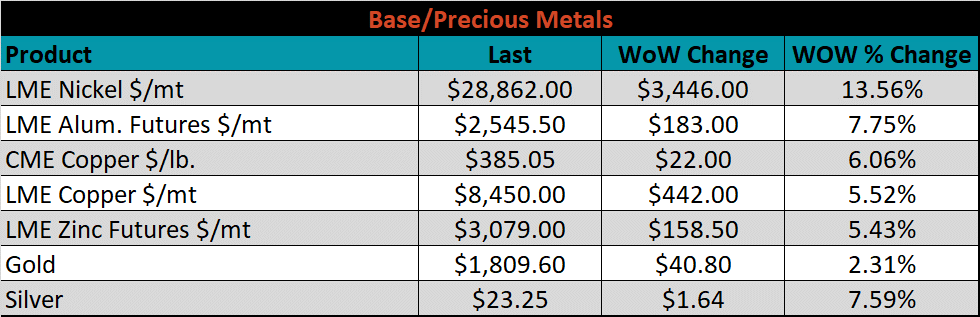
Base & Precious Metals
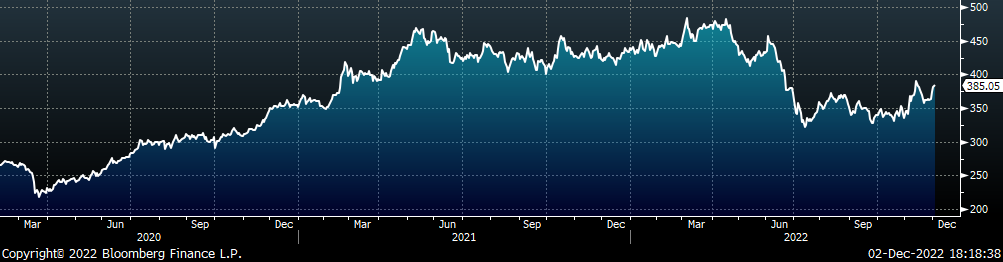
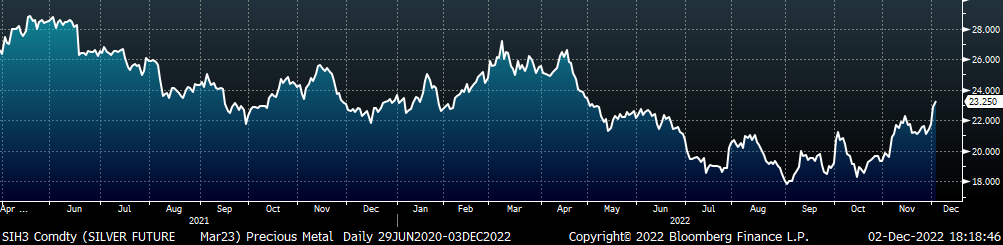
Base and precious metal futures were all higher this week, led by LME nickel, LME aluminum and silver, each up 13.6%, 7.8%, and 7.6%, respectively. This move was largely driven by an improved macro environment, where participants saw weaker economic data in the beginning of the week as a sign that the Fed was going to start slowing the pace of rate hikes.
LME Nickel
Silver


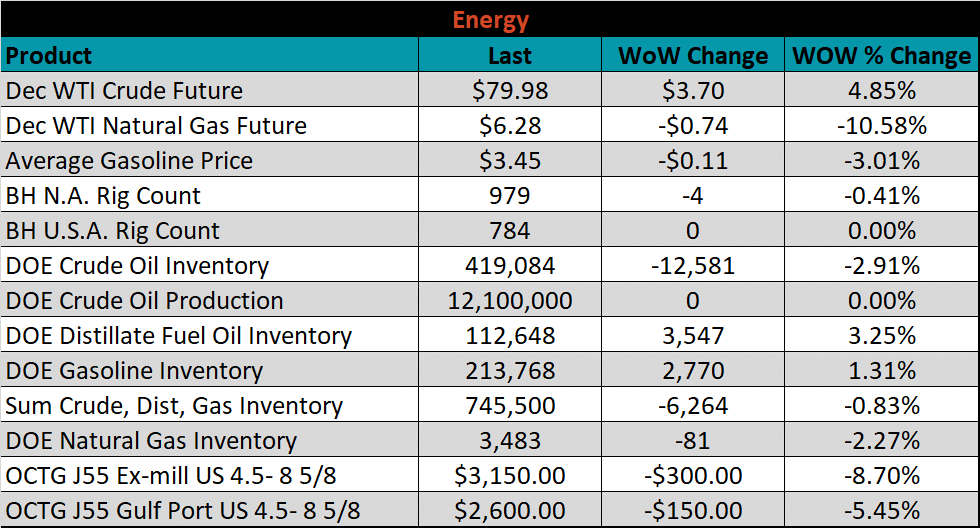
Energy
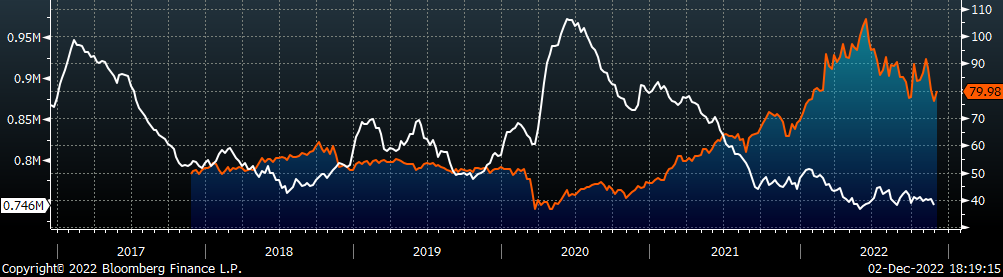
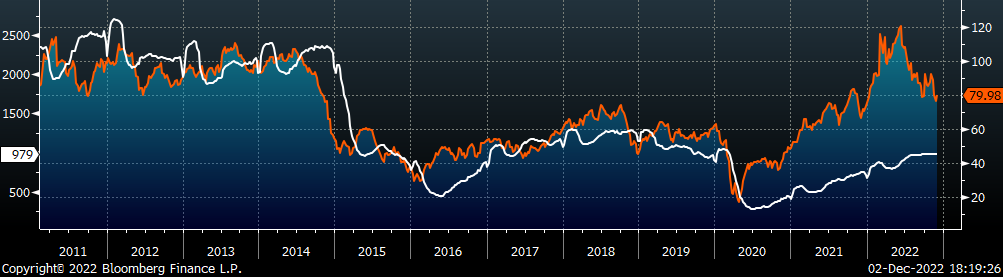
Last week, the January WTI crude oil future gained $3.70 or 4.9% to $79.98/bbl. The aggregate inventory level fell another 0.8%. The Baker Hughes North American rig count decreased by 4 rigs, while the U.S. rig count was unchanged.
January WTI Crude Oil Futures (orange) vs. Aggregate Energy Inventory (white)
Front Month WTI Crude Oil Future (orange) and Baker Hughes N.A. Rig Count (white)


The list below details some upside and downside risks relevant to the steel industry. The bolded ones are occurring or highly likely.
Upside Risks:
- Inventory at end users and service centers below normal operational levels
- A higher share of discretionary income allocated to goods from steel-intensive industries
- Changes in China’s policies regarding ferrous markets, including production cuts and exports
- Unplanned & extended planned outages, including operational issues leaving mills behind
- Energy issues abroad curtailing global production
- Easing labor and supply chain constraints allowing increased manufacturing activity
- Mills extending outages/taking down capacity to keep prices elevated
- Global supply chains and logistics restraints causing regional shortages
- Fluctuating auto production, pushing steel demand out into the future
- The threat of further protectionist trade policies muting imports
Downside Risks:
- Increased domestic production capacity
- Elevated price differentials and hedging opportunities leading to sustained higher imports
- Steel consumers substitute to lower cost alternatives
- Steel buyers and consumers “double ordering” to more than cover steel needs
- Tightening credit markets, as elevated prices push total costs to credit caps
- Supply chain disruptions allowing producers to catch up on orders
- Limited desire to restock at elevated prices, causing a “Buyer’s Strike”
- Economic slowdown caused by the emergence of Coronavirus Variants
- Reduction and/or removal of domestic trade barriers
- Political & geopolitical uncertainty
- Chinese restrictions in the property market
- Unexpected sharp China RMB devaluation