

December 3, 2021

Market Commentary
In last week’s market commentary, we concluded by noting that increased volatility will lead to opportunities in both the physical and financial steel markets. The chart below shows the HRC price in red, and the estimated range of spot transactions (as a percentage of the TSI Platts Midwest price) in blue.
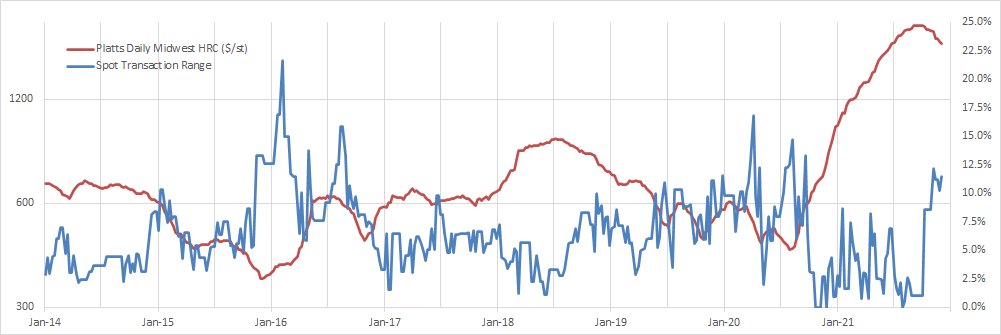
As prices peaked and the standoff formed between mills and buyers spot material became largely available. The difference between late-September and now, is that mills are showing a willingness to bridge the gap and take orders at lower prices to fill holes in their orderbook. This becomes clear when we see the spot transaction range jump higher after a historic period of mill unity in price quotes (September 2020-August 2021). What remains entirely unclear, though, is whether this divergence will lead to a snowball effect, or if mills are truly “filling temporary holes” and moving onto 2022. However, as that spread remains wide and tons are available, prices will follow the path of least resistance, which is clearly lower. One of the best forward indications of this will be any changes in lead times, which are currently operating right around their historic average.
It is also important to view this shift in the context of the recent contract negotiations. Moving into next year, mills actively reduced the size of their contract books and opted towards dynamism and flexibility. While they may not have anticipated the auto slowdown, or buyers moving to their minimums in 4Q22, a more robust spot market was a named goal. With that in mind, there have been tectonic changes to the industry since the last downcycle and buyer’s strike, and the full impact from those changes will not be clear until years down the road. First, there are significantly fewer mills competing for orders; and second, the U.S. market has a higher percentage of EAF production than anywhere else in the world. With variable input costs, mini mills have increased leverage and more flexibility to slow steel production. With prices in a clear downtrend, capacity utilization has been trending lower since reaching its peak in mid-October. The problem is that by the time it is obvious that mills have meaningfully reduced supply, it will be too late to act because demand for goods across the manufacturing sector remains strong amid a positive economic environment (supporting data in report below).
ISM PMI
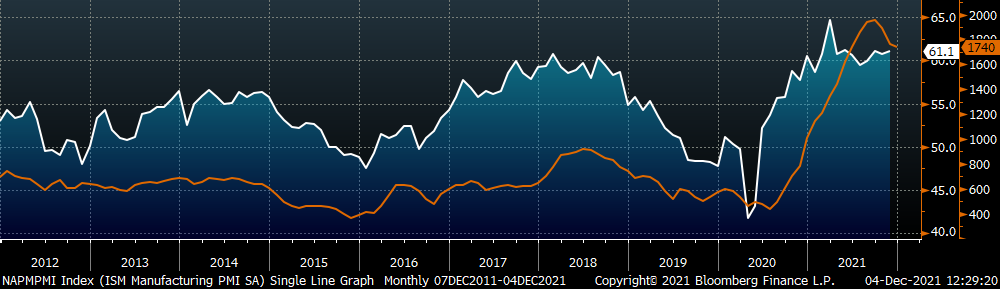
The chart below is the Platts Midwest HRC index (orange) and the ISM Manufacturing PMI (white). The overall ISM Manufacturing PMI ticked higher and remains well in expansion territory. This level of sustained expansion (prints above 50) continues to be unprecedented, with 10 prints above 60 in one period.
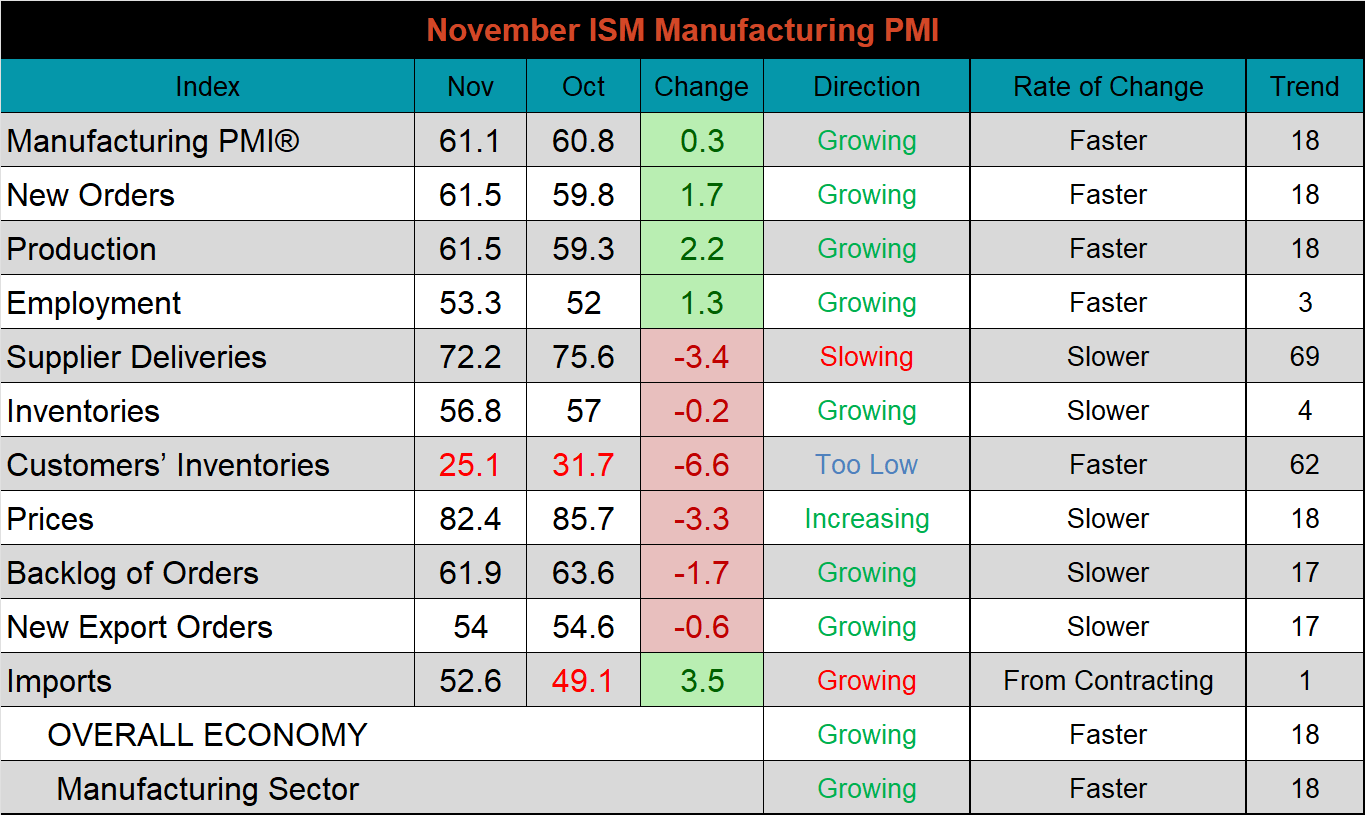
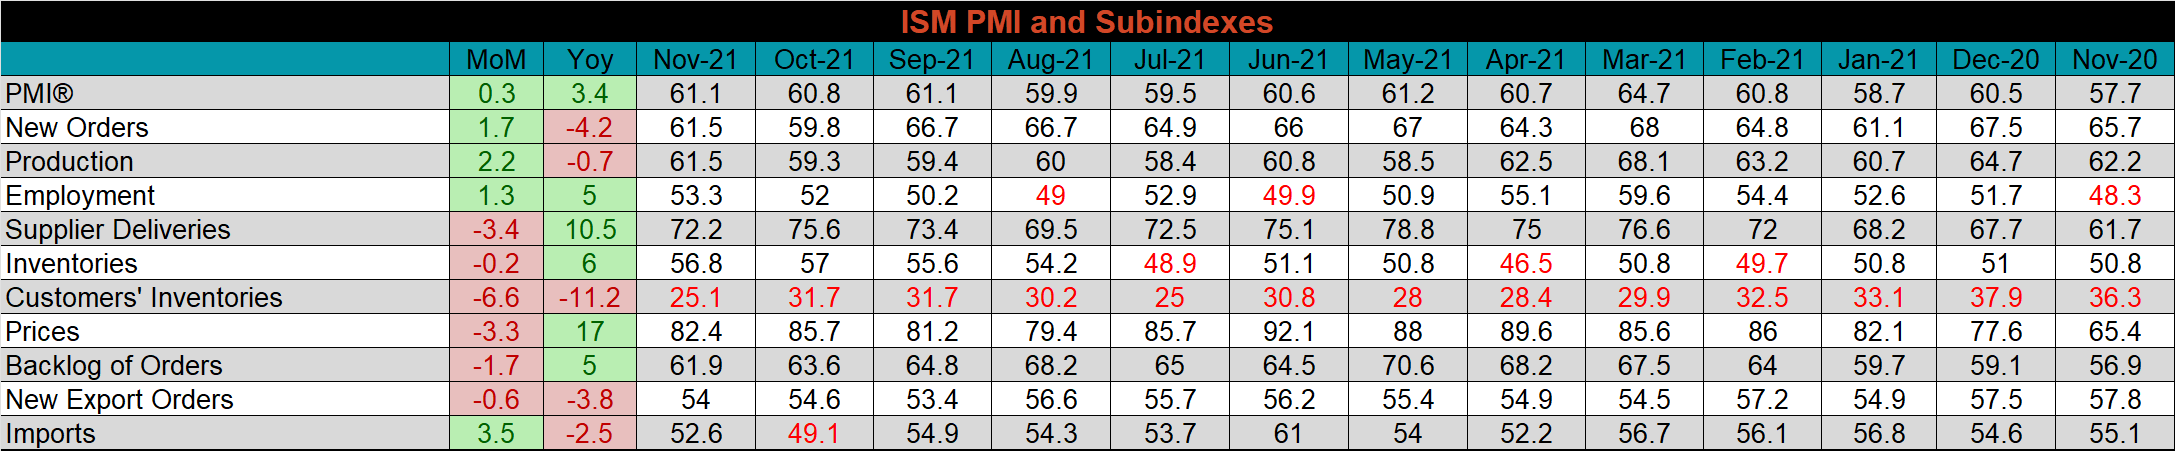
The November ISM Manufacturing PMI and subindexes are below.
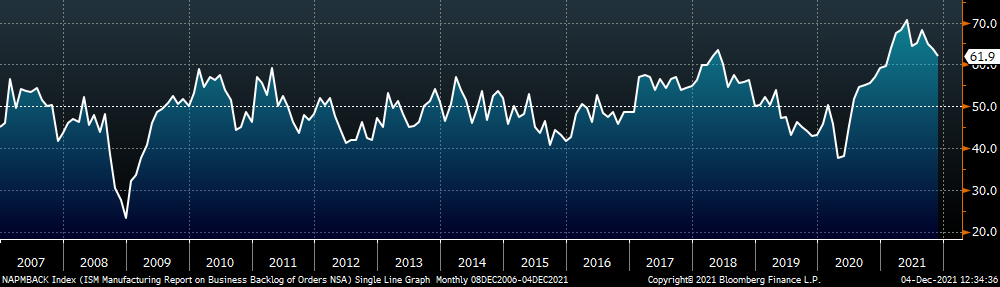
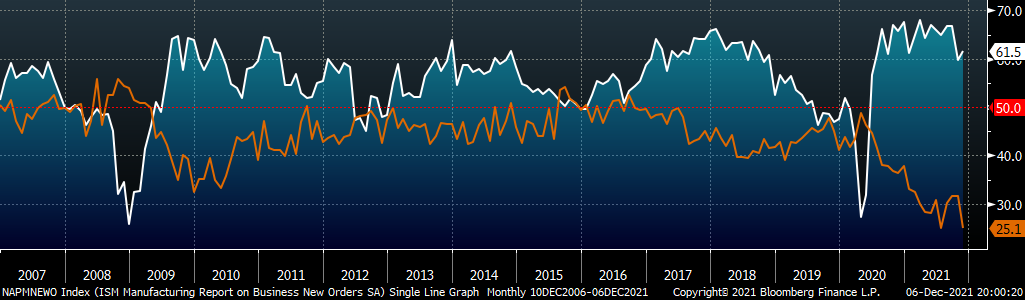
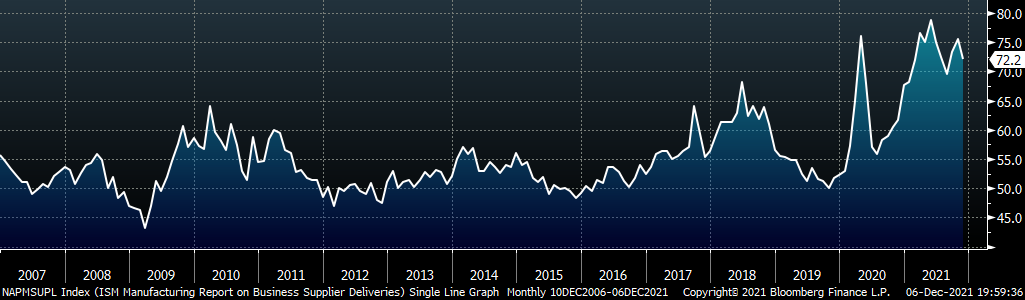
Now that we are clearly in a downcycle for steel prices, we’ve adjusted the date range of the 3 charts below to include a visual on the dynamics that were occurring in the 2008 collapse in steel pricing. The first chart is the ISM Manufacturing PMI backlog subindex showing the level to which manufacturers have existing orders in their pipeline. Prints from this cycle are at the highest, sustained levels on record and clearly show that demand for manufactured goods will remain strong going into 2022. The second chart shows new orders in white versus customer inventories in orange. This indicates a significant upside risk for buyers that are waiting for better prices with inventories this low, and a churn of new orders. The final chart shows the supplier deliveries subindexes, which eased slightly but remains well above the historical norm. It is clear that while steel prices should remain under pressure well into the first quarter, the risks that led to the dramatic increases in price have not subsided in the manufacturing sector.
ISM Manufacturing PMI Backlog Subindex
ISM Manufacturing PMI Customer Inventories Subindex & New Orders Subindex
ISM Manufacturing Supplier Deliveries
The table below shows the historical values of each subindex over the last year.
Global PMI
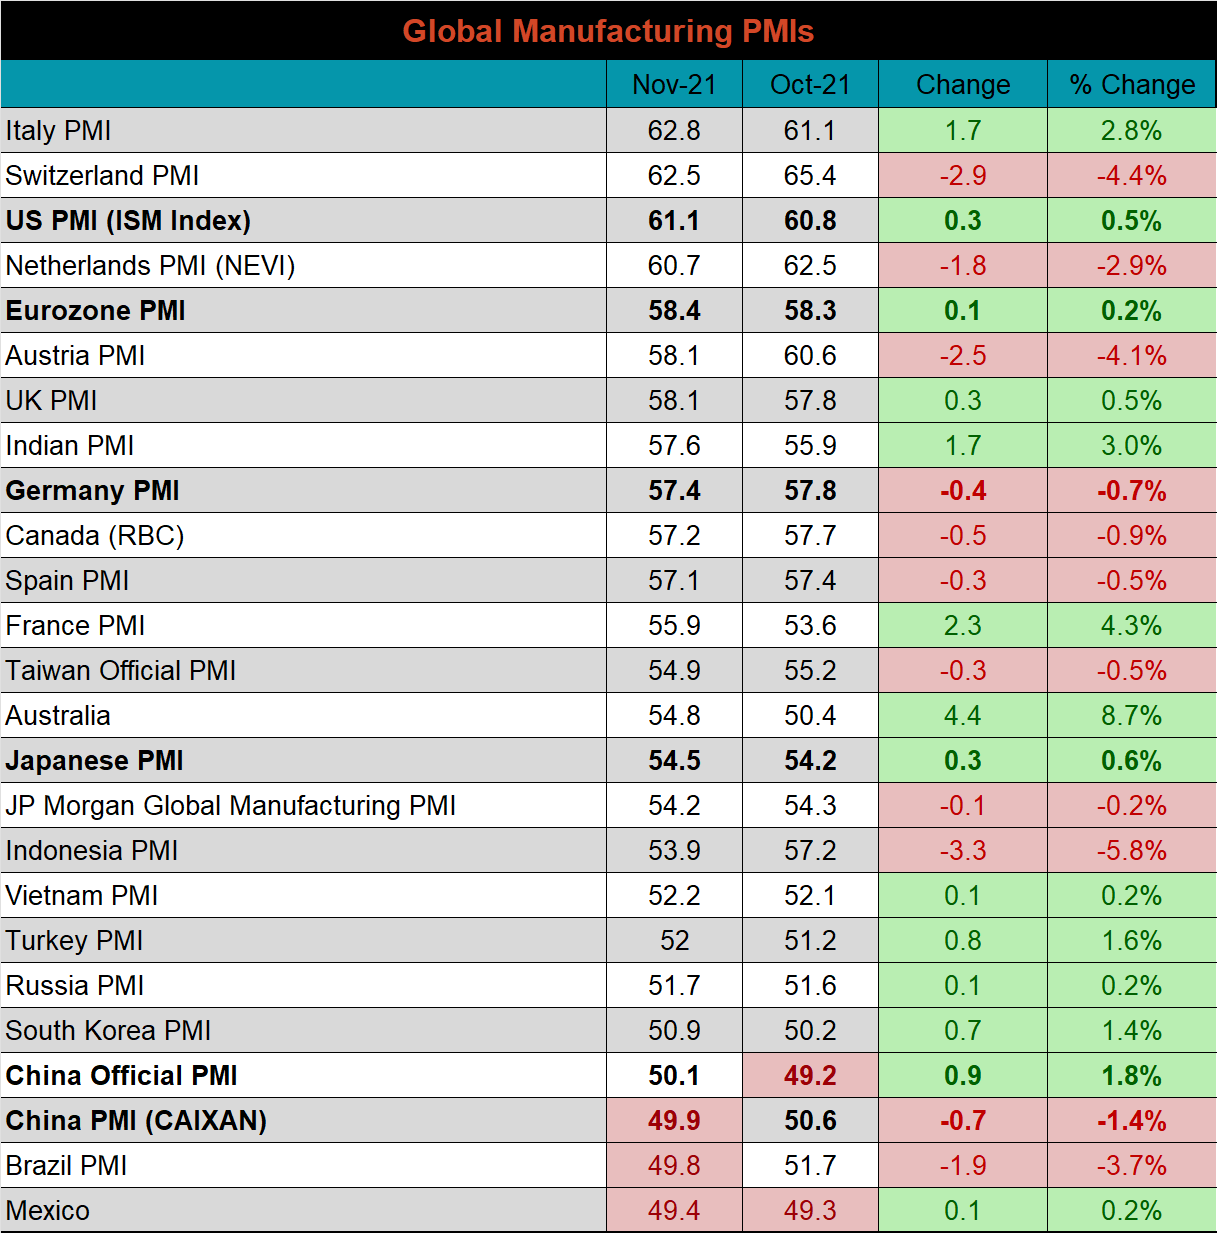
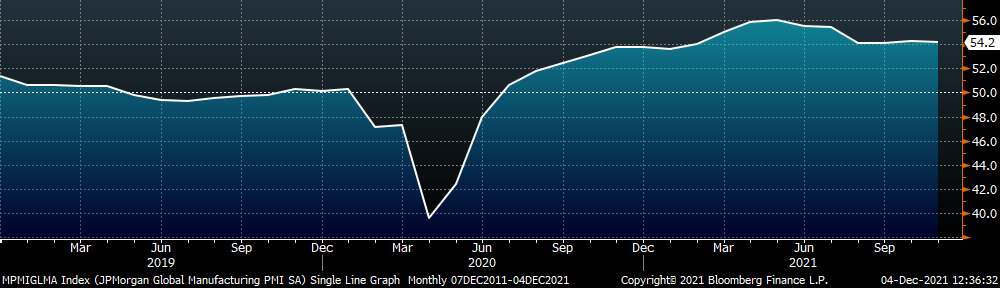
The November global PMI printings were mostly higher, and 21 of the 23 watched countries saw expansion in their respective manufacturing industries. The five most significant countries (bold) continue to expand, except for the Chinese (CAIXAN) PMI.
J.P. Morgan Global Manufacturing
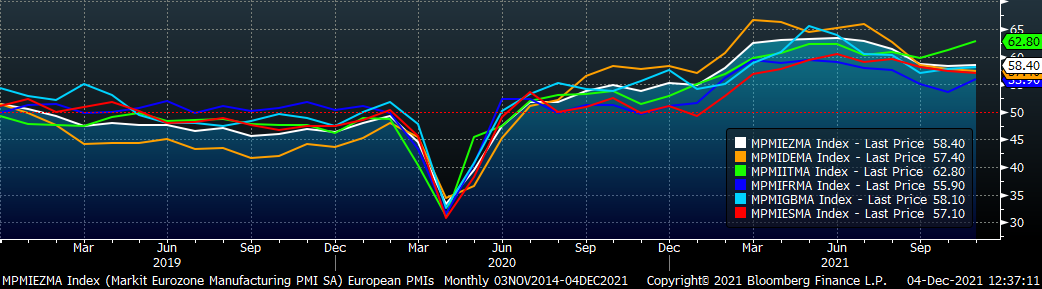
Eurozone (white), German (orange), Italian (green), Spanish (red), and French (blue), U.K. (teal) Manufacturing PMIs
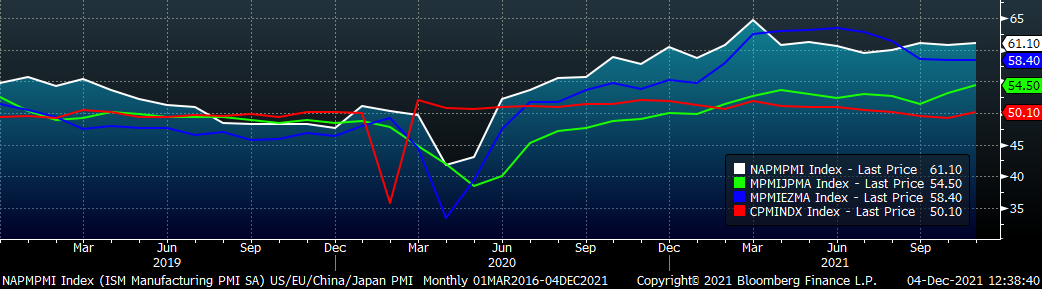
US (white), Euro (blue), Chinese (red) and Japanese (green) Manufacturing PMIs
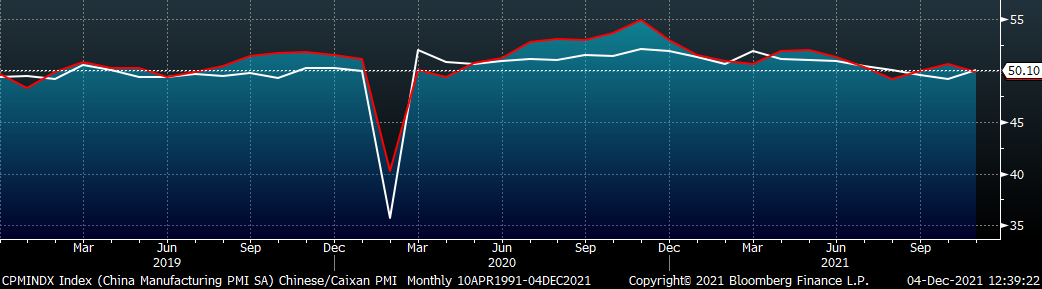
China’s official manufacturing PMI moved slightly into expansion, while the Caixan PMI decreased slightly and moved into contraction.
China Official (white) and Caixan (red) Manufacturing PMIs
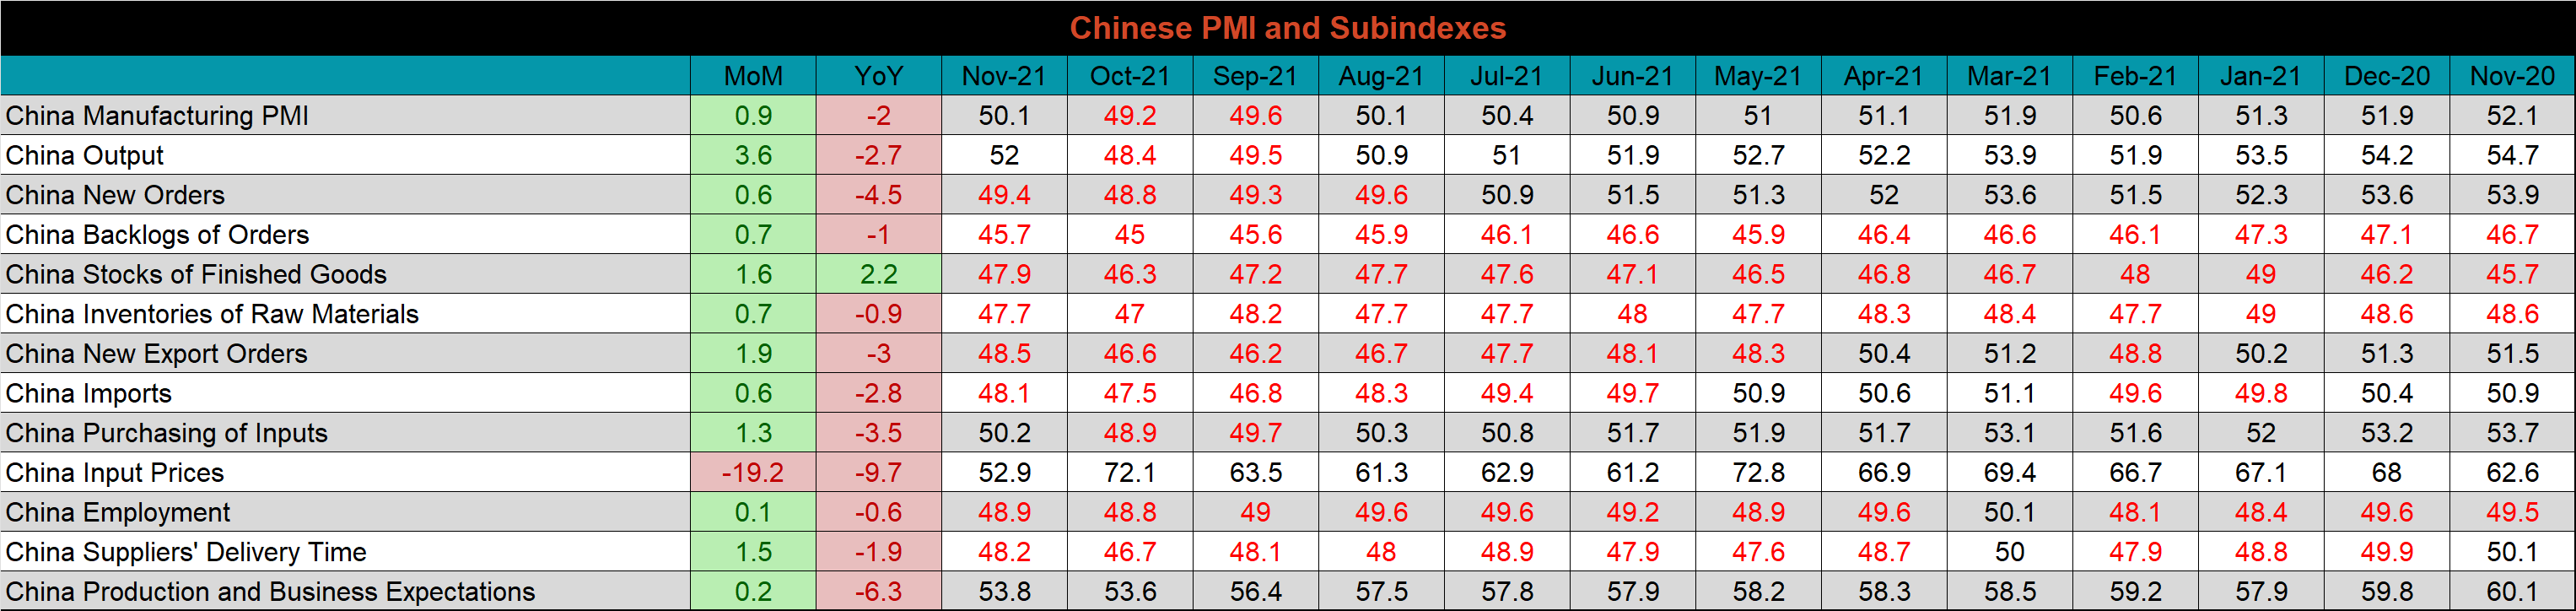
The table below breaks down China’s official manufacturing PMI subindexes. November’s subindexes rebounded significantly compared to last month, with only the input price down, significantly. This is a clear example of how acutely the Chinese manufacturing sector is impacted by high input prices.
Construction Spending
October seasonally adjusted U.S. construction spending was up 0.2% compared to September, and 7.8% higher than October 2020.
October U.S. Construction Spending
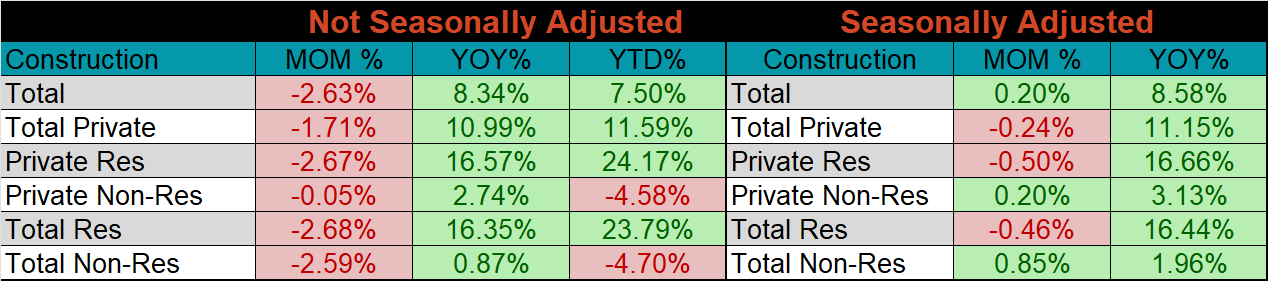
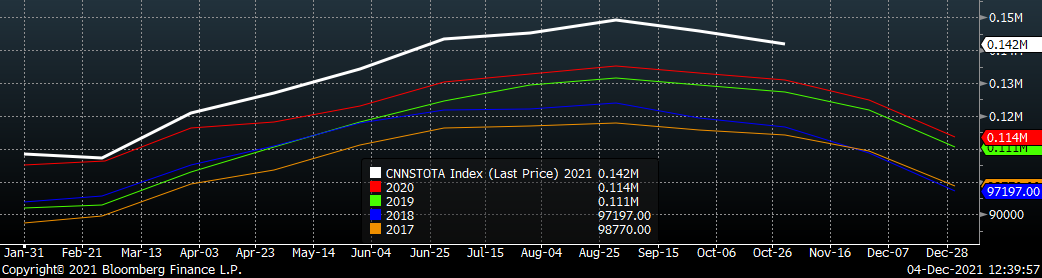
The white line in the chart below represents not seasonally adjusted construction spending in 2021 and compares it to the spending of the previous 4 years. Total spending remains strong and is at its highest seasonal level in the last 4 years.
U.S. Construction Spending NSA
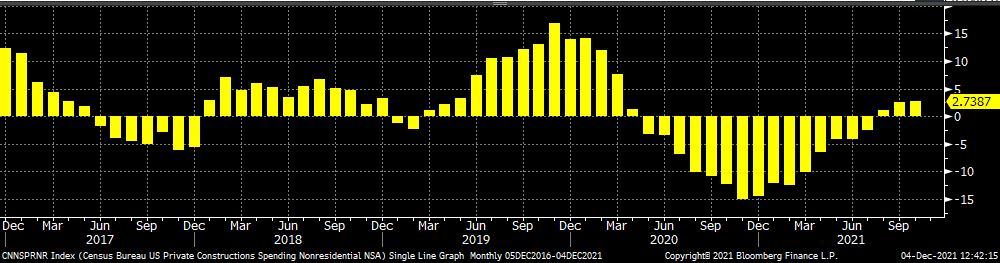
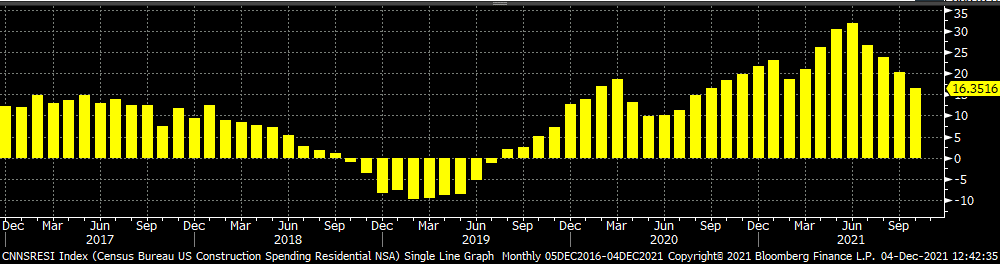
The two charts below show the YoY changes in construction spending. After August and September were both revised higher, private non-residential spending finally moved to a 3-month trend of year-over-year growth. Residential spending remains strong, with 27 straight months of YoY growth, however, the pace continues to slip.
U.S. Private Nonresidential Construction Spending NSA YoY % Change
U.S. Residential Construction Spending NSA YoY % Change
Auto Sales
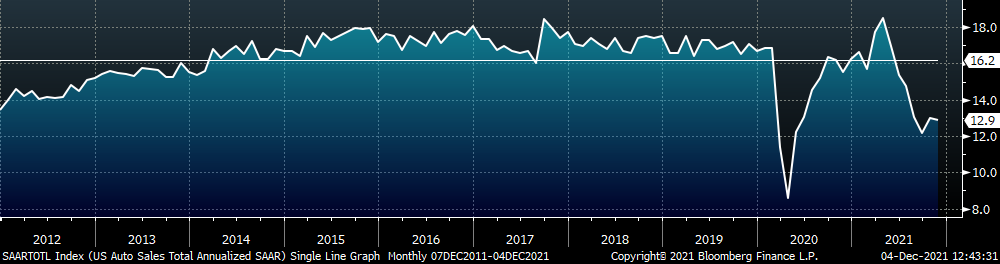
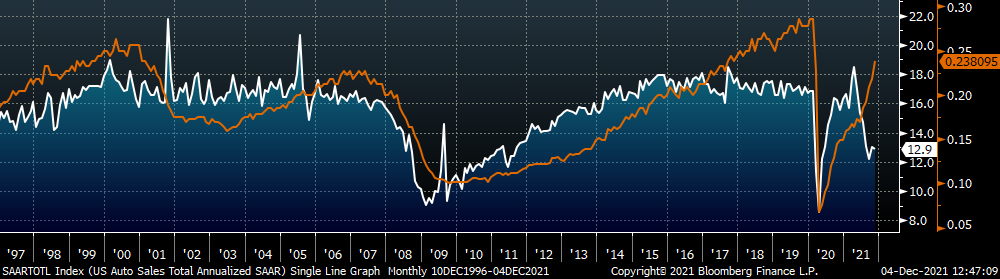
November U.S. light vehicle sales ticked slightly lower, to a 12.9m seasonally adjusted annualized rate (S.A.A.R). The second chart shows the relationship between the unemployment rate and auto sales. The unemployment rate is inverted to show that declining unemployment typically leads to increasing auto sales. The labor market recovery continued improved, albeit below expectations in November, and continues to show significant existing pent-up demand for cars, once the chip shortage is resolved.
November U.S. Auto Sales (S.A.A.R.)
November U.S. Auto Sales (orange) and the Inverted Unemployment Rate (white)
Risks
Below are the most pertinent upside and downside price risks:
Upside Risks:
- Inventory at end users and service centers below normal operational levels
- Higher share of discretionary income allocated to goods from steel intensive industries
- Changes in China’s policies regarding ferrous markets, including production cuts and exports
- Unplanned & extended planned outages, including operational issues leaving mills behind
- Energy & construction industry rebound
- Easing labor and supply chain constraints allowing increased manufacturing activity
- Mills extending outages/taking down capacity to keep prices elevated
- Global supply chains and logistics restraints causing regional shortages
Downside Risks:
- Increased domestic production capacity
- Elevated price differentials and hedging opportunities leading to sustained higher imports
- Steel consumers substitute to lower cost alternatives
- Steel buyers and consumers “double ordering” to more than cover steel needs
- Tightening credit markets, as elevated prices push total costs to credit caps
- Supply chain disruptions allowing producers to catch up on orders
- Limited desire to restock at elevated prices, causing a “Buyer’s Strike”
- Economic slowdown caused by the emergence of Coronavirus Variants
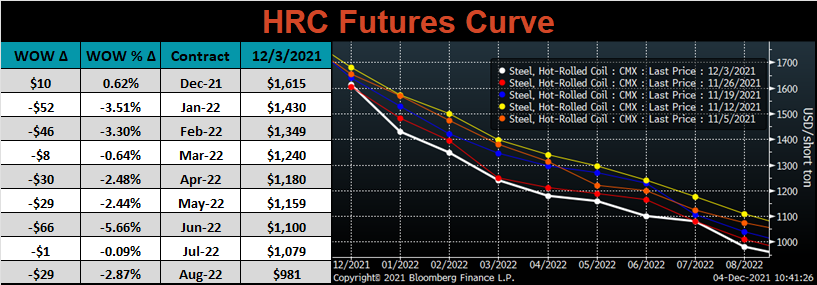
HRC Futures
All of the below data points are as of December 3, 2021.
The Platts TSI Daily Midwest HRC Index decreased by $20 to $1,740.
Platts TSI Daily Midwest HRC Index
The CME Midwest HRC futures curve is below with last Friday’s settlements in white. Last week, the entire curve was lower, most significantly in Jan/Feb of 2022.
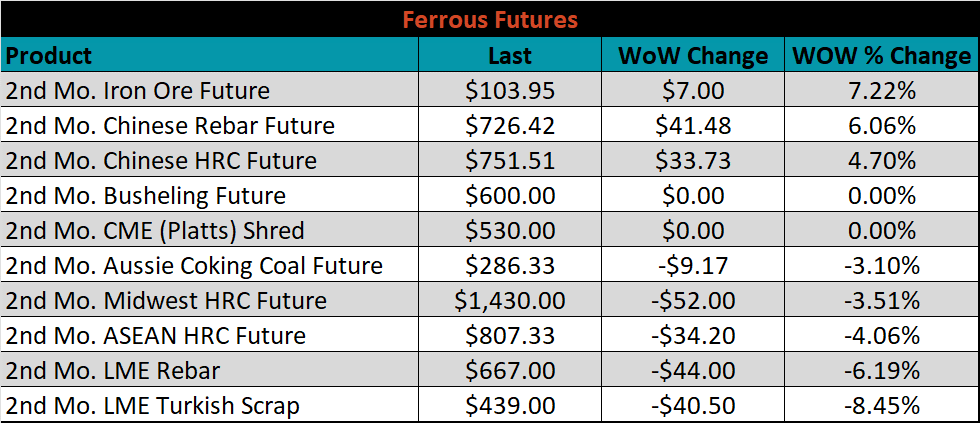
January ferrous futures were mixed. Iron ore gained another 7.2%, while Turkish scrap lost 8.5%.
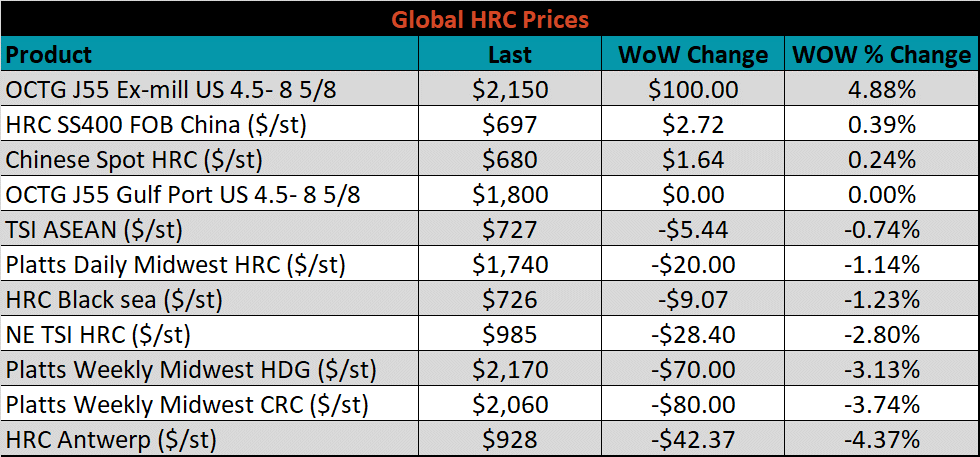
Global flat rolled indexes were mostly lower again this week, led by Antwerp HRC, down another 4.4%, while Chinese Export HRC was slightly higher, up 0.4%.
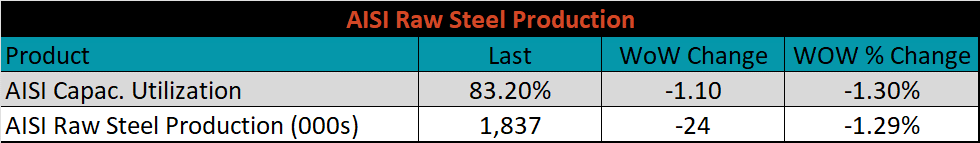
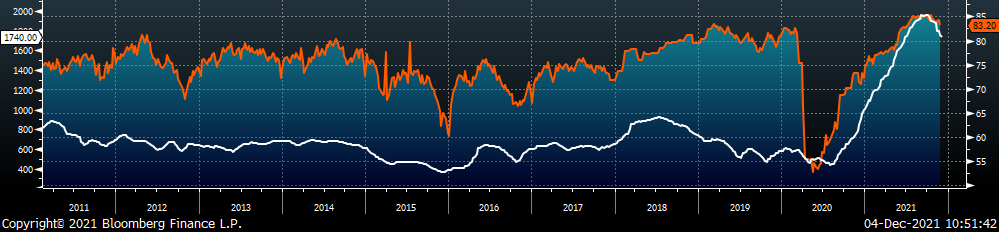
The AISI Capacity Utilization fell 1.1% to 83.2%.
AISI Steel Capacity Utilization Rate (orange) and Platts TSI Daily Midwest HRC Index (white)
Imports & Differentials
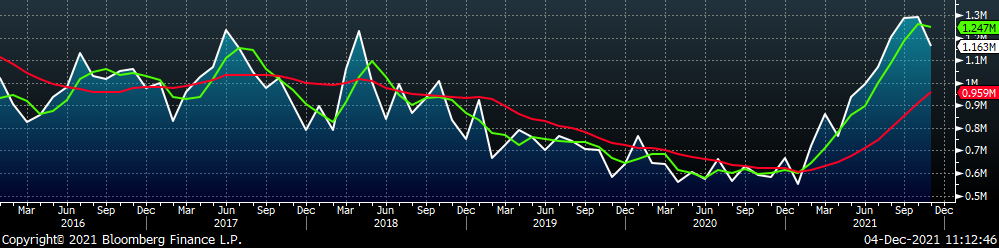
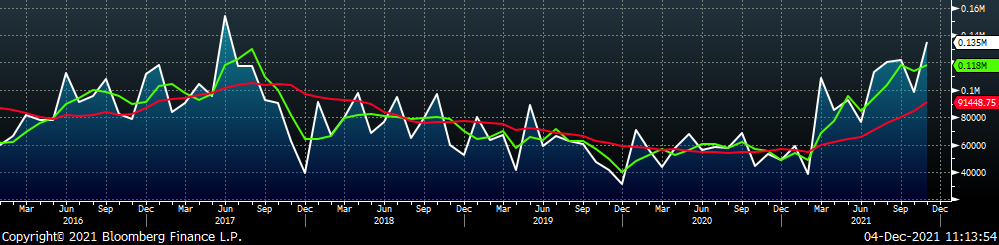
November flat rolled import license data is forecasting a decrease of 128k to 1.16M MoM.
All Sheet Imports (white) w/ 3-Mo. (green) & 12-Mo. Moving Average (red)
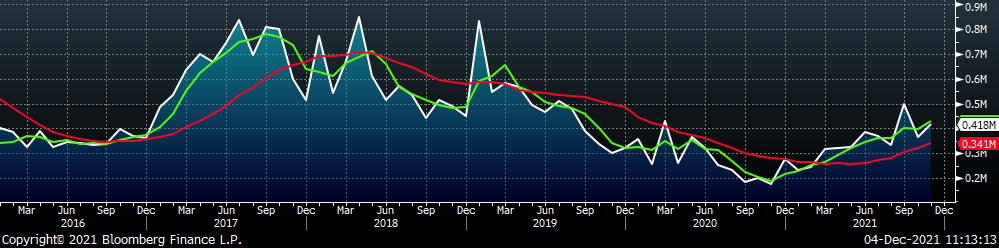
Tube imports license data is forecasting an increase of 51k to 418k in November.
All Tube Imports (white) w/ 3-Mo. (green) & 12-Mo. Moving Average (red)
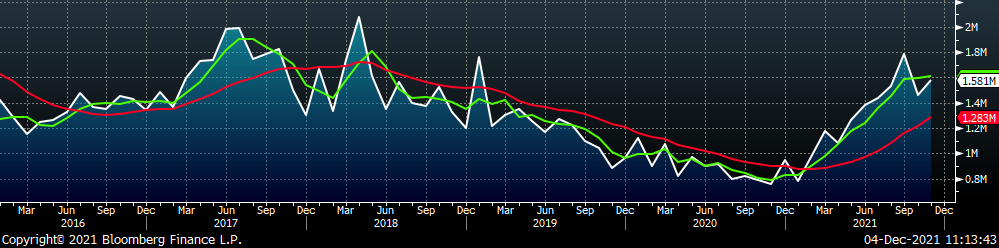
All Sheet plus Tube (white) w/ 3-Mo. (green) & 12-Mo. Moving Average (red)
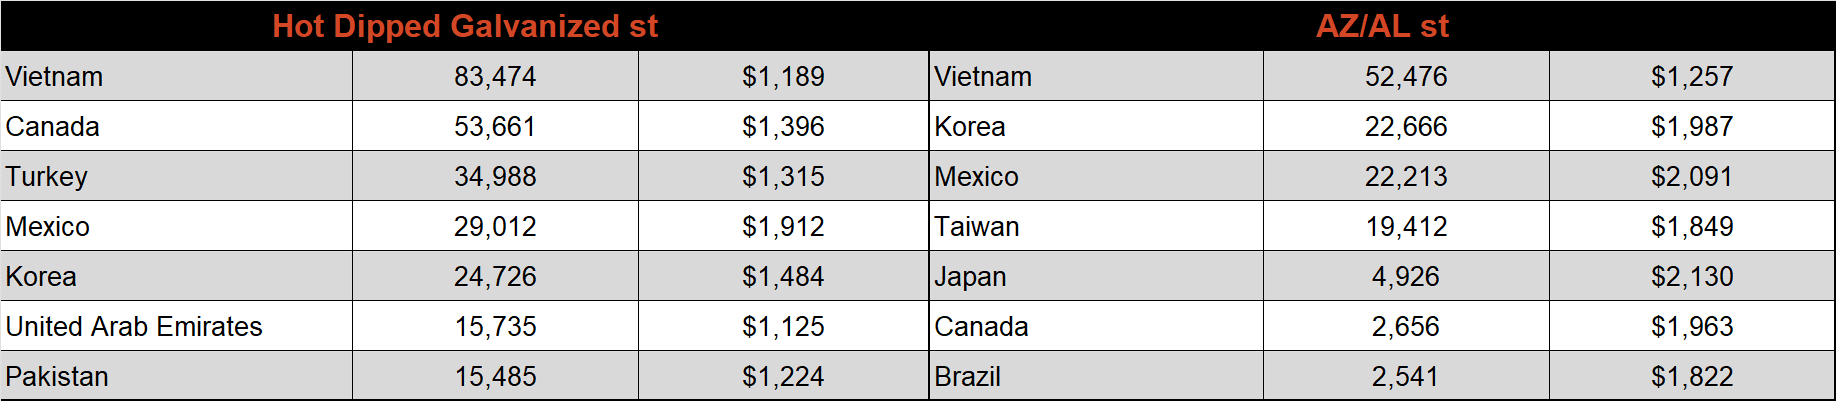
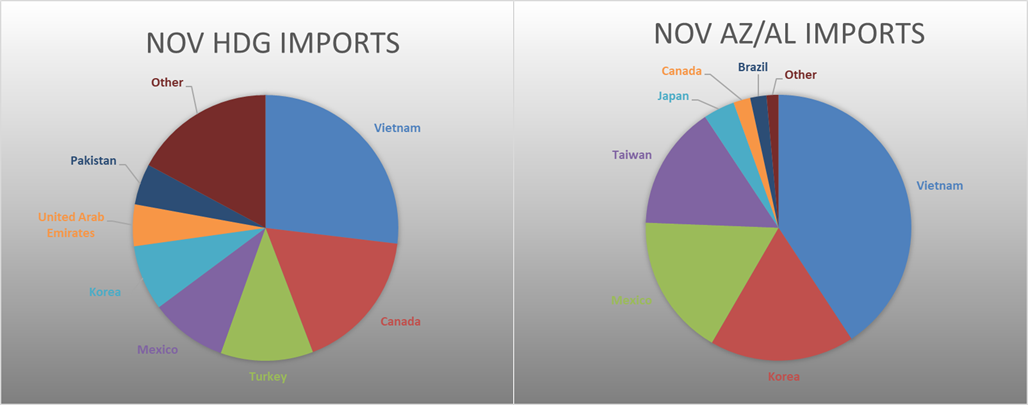
November AZ/AL import license data is forecasting an increase of 36k to 135k.
Galvalume Imports (white) w/ 3 Mo. (green) & 12 Mo. Moving Average (red)
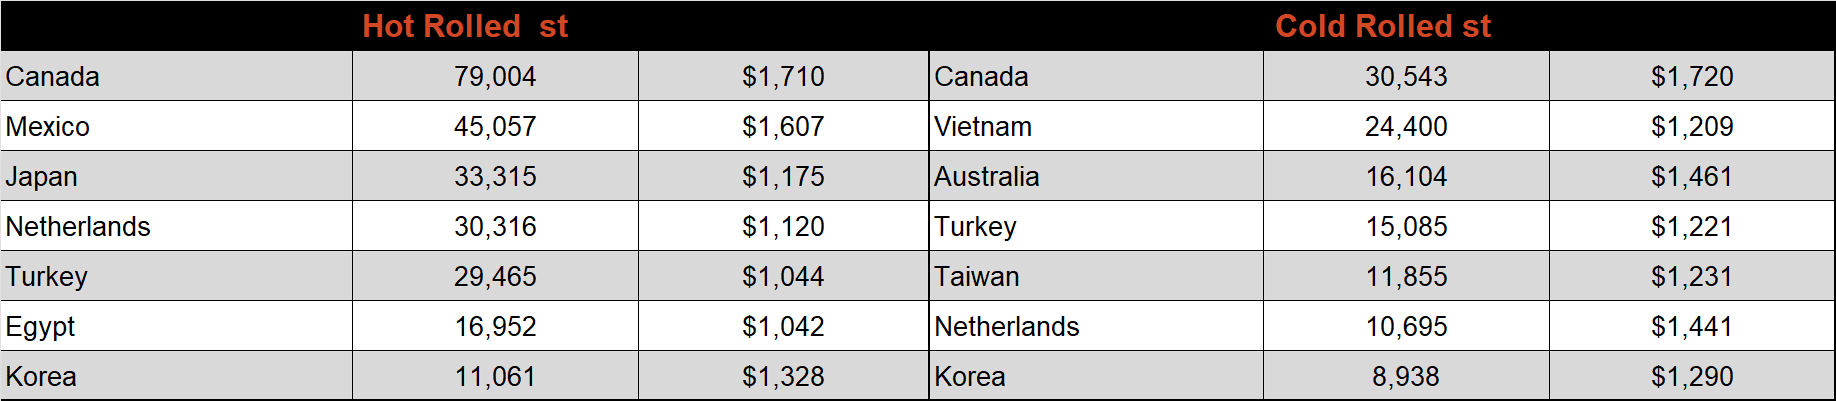
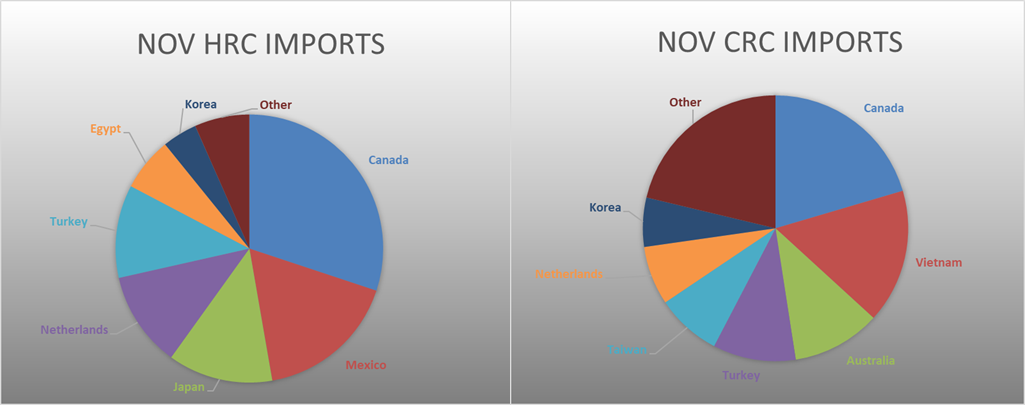
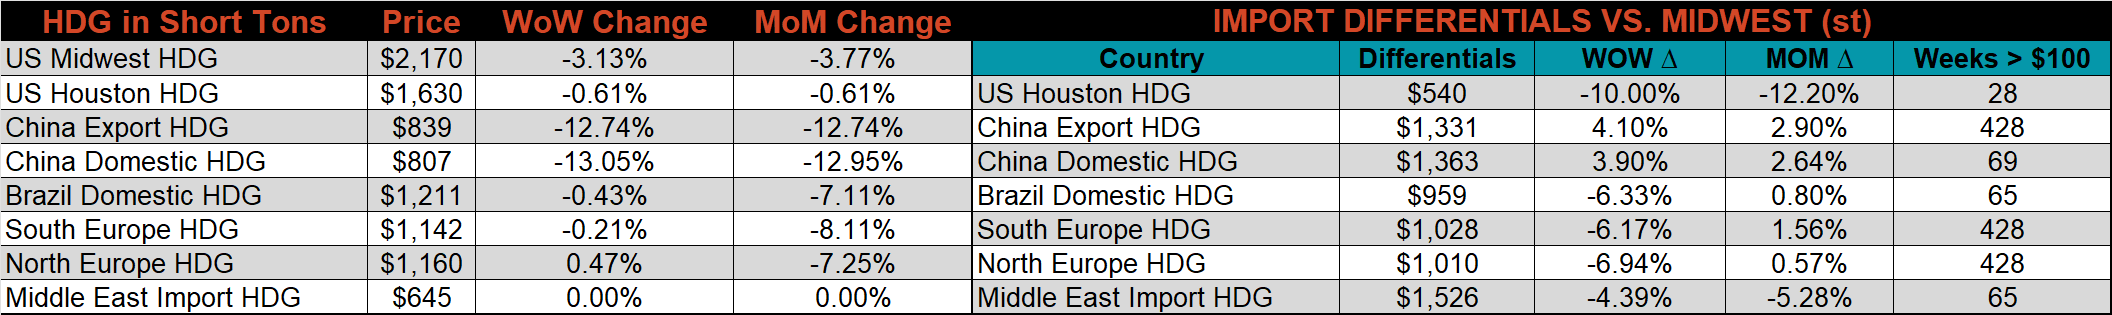
Below is November import license data through November 29th, 2021.
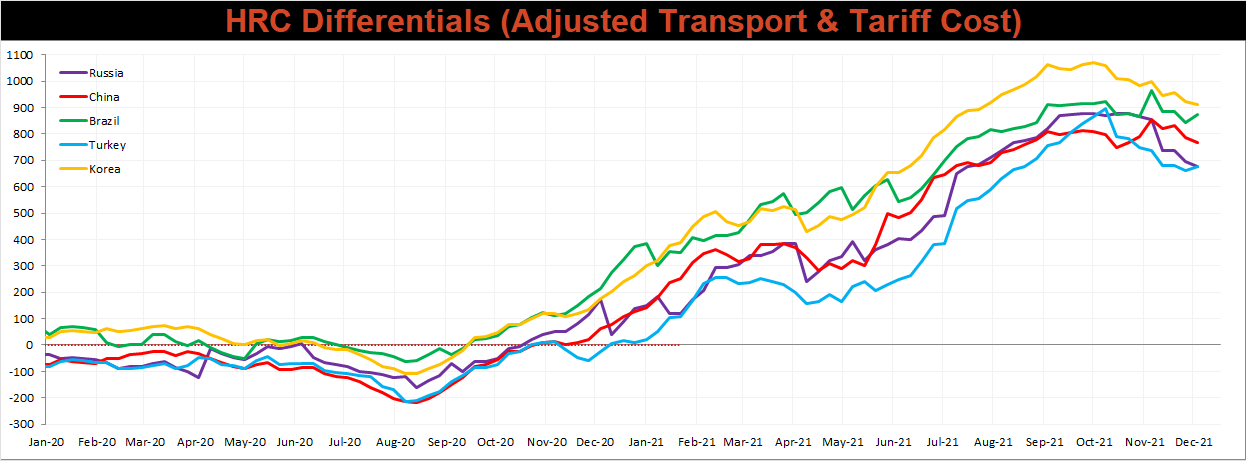
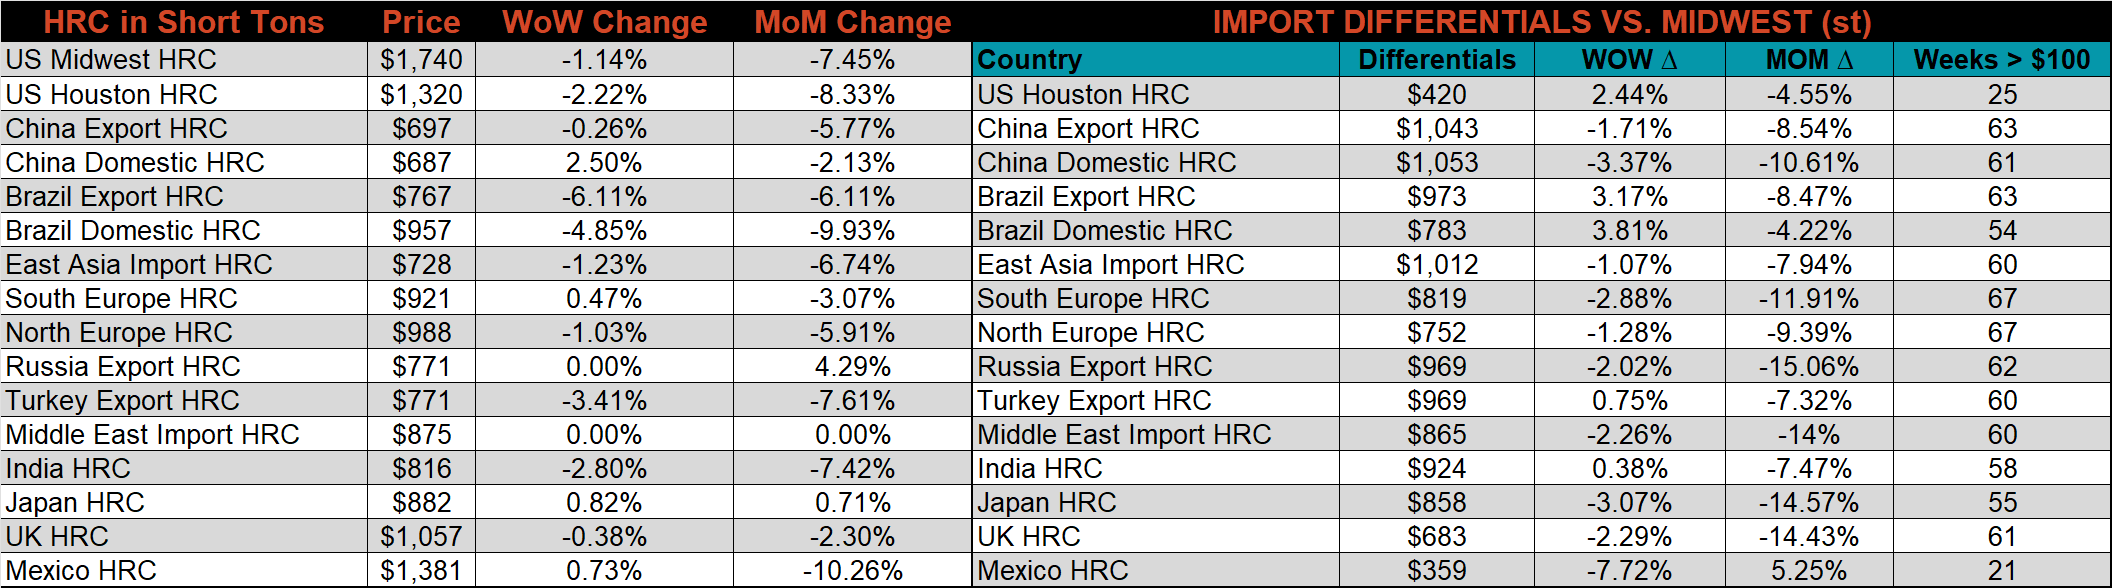
Below is the Midwest HRC price vs. each listed country’s export price using pricing from SBB Platts. We have adjusted each export price to include any tariff or transportation cost to get a comparable delivered price. The Turkish and Brazilian differentials increased this week, with their prices falling further than the U.S. domestic price. The remaining countries (Korea, China & Russia) all saw their price differentials decline.
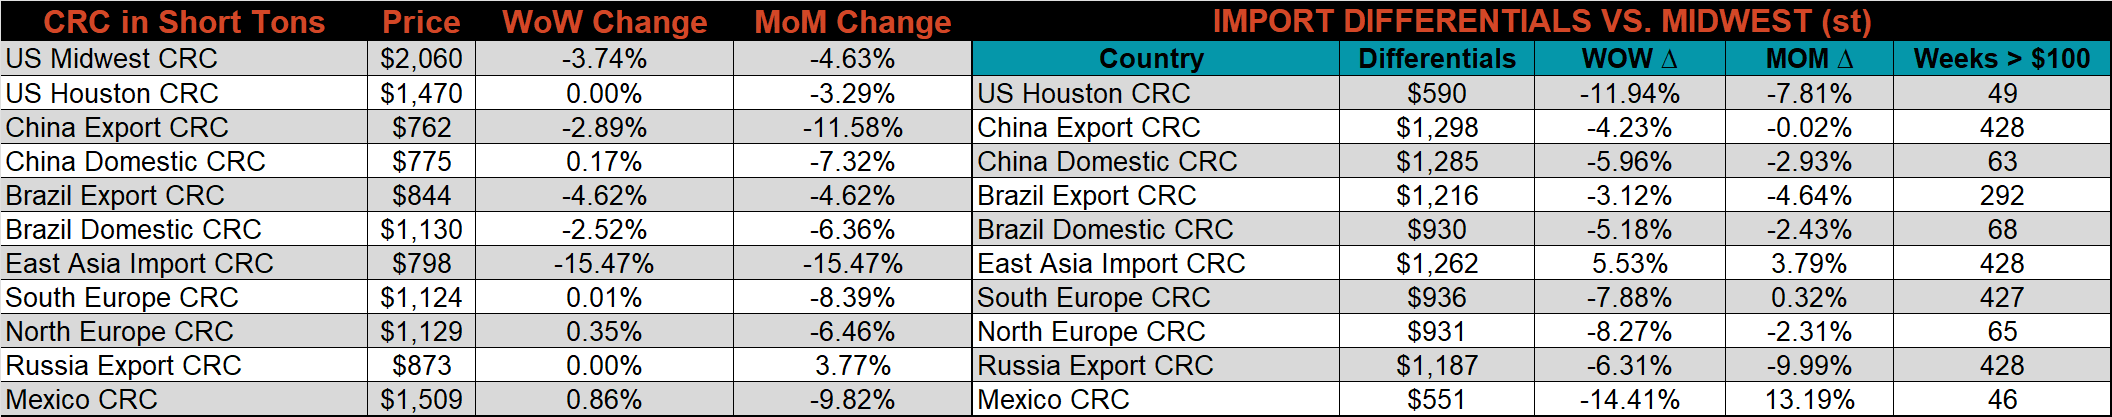
SBB Platt’s HRC, CRC and HDG pricing is below. The Midwest CRC, HDG, and HRC prices were all lower this week, 3.7%, 3.1%, and 1.1%, respectively. Outside of the U.S., the East Asian CRC price was down 15.5%.
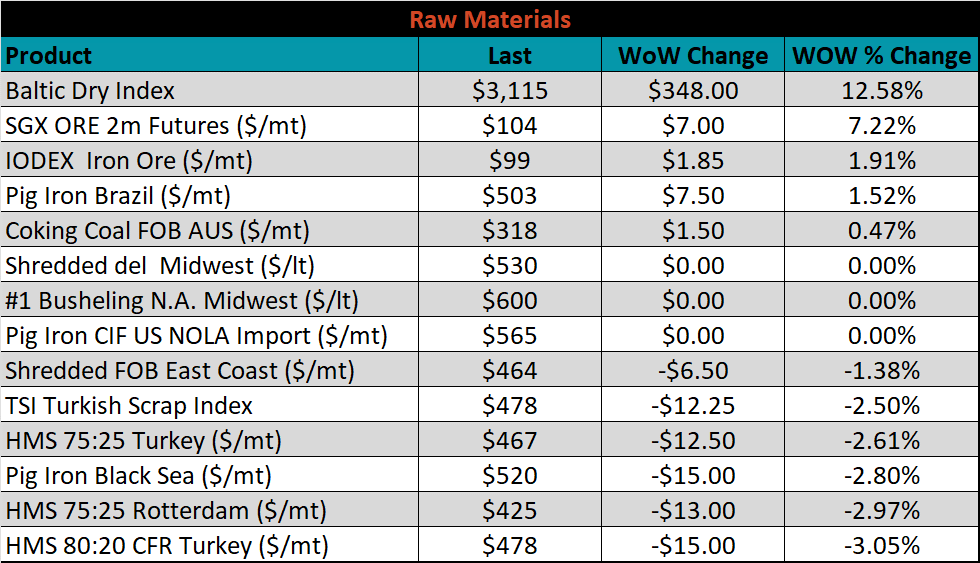
Raw Materials
Raw material prices were mixed. The January iron ore future rose another 7.2%, while Turkish HMS lost 3.1%.
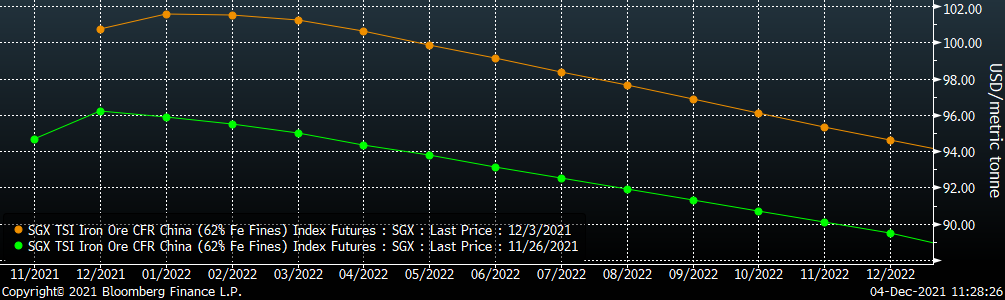
Below is the iron ore future curve with Friday’s settlements in orange, and the prior week’s settlements in green. Last week, the entire curve shifted higher.
SGX Iron Ore Futures Curve
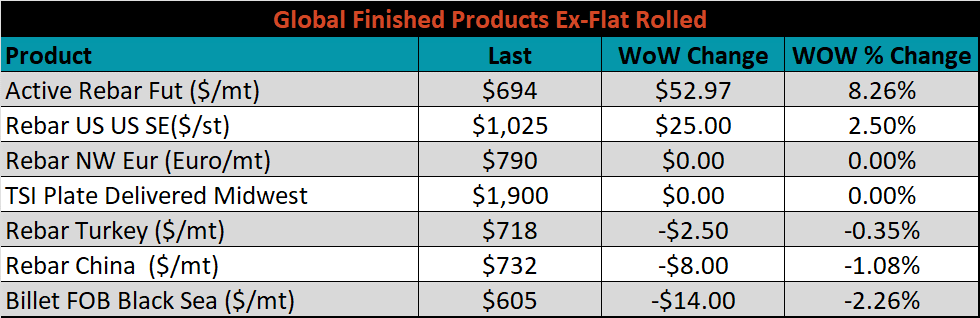
The ex-flat rolled prices are listed below.

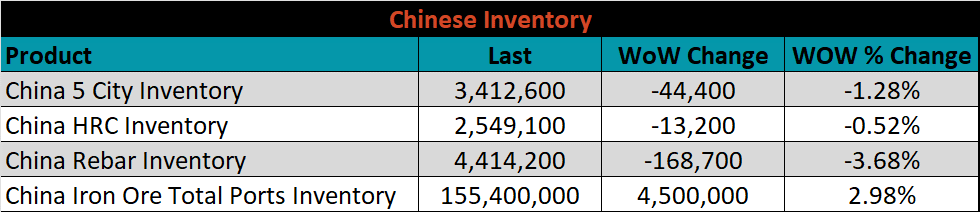
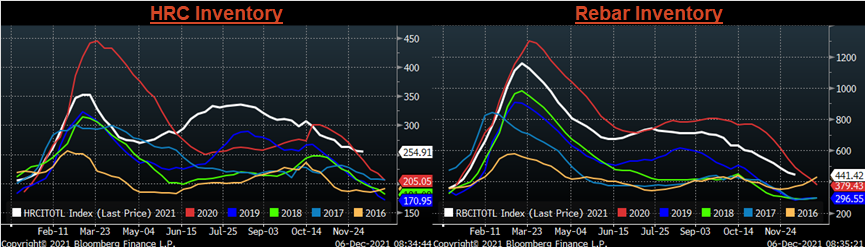
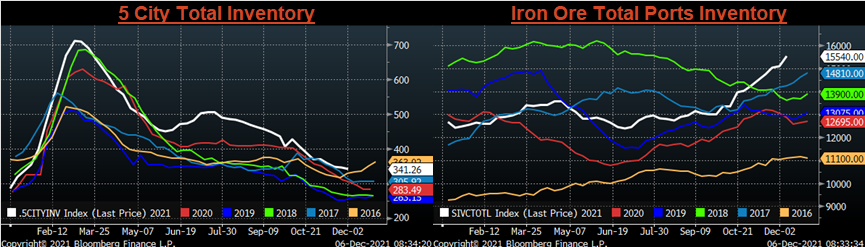
Chinese Inventory
Below are inventory levels for Chinese finished steel products and iron ore. Iron ore inventory levels continued to build and are at their highest seasonal level in the last 6 years. Further, current levels are approaching their recent record high from 2Q18. The HRC, rebar and the 5-city inventories were lower last week, however, they also remain among 6-year seasonal highs.
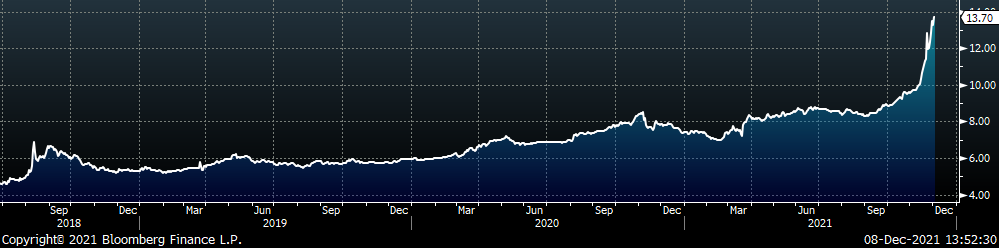
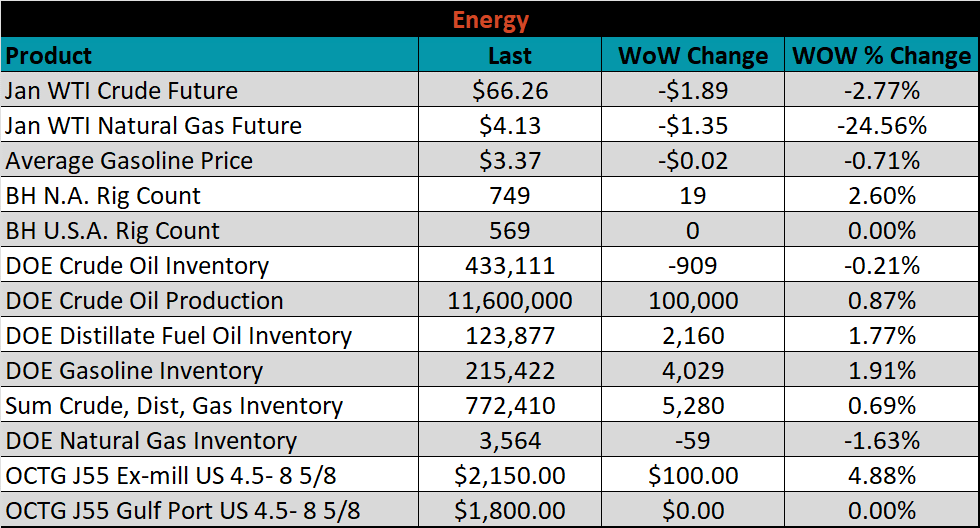
Energy
Last week, the January WTI crude oil future was down another $1.89 or 2.8% to $66.26/bbl. The aggregate inventory level was up 0.7%, while crude oil production increased to 11.6m bbl/day. The Baker Hughes North American rig count was up 19 rigs, while the U.S. rig count was unchanged.
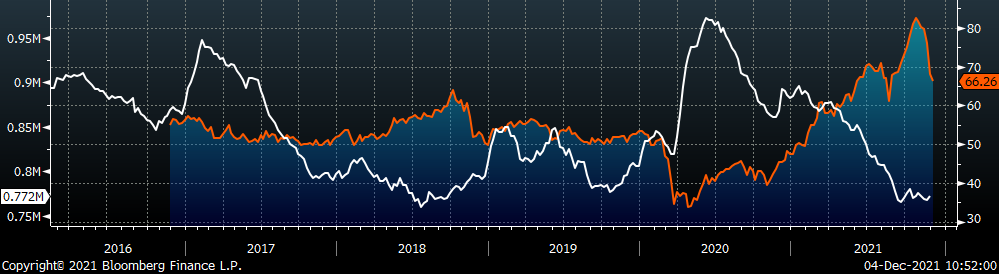
January WTI Crude Oil Futures (orange) vs. Aggregate Energy Inventory (white)
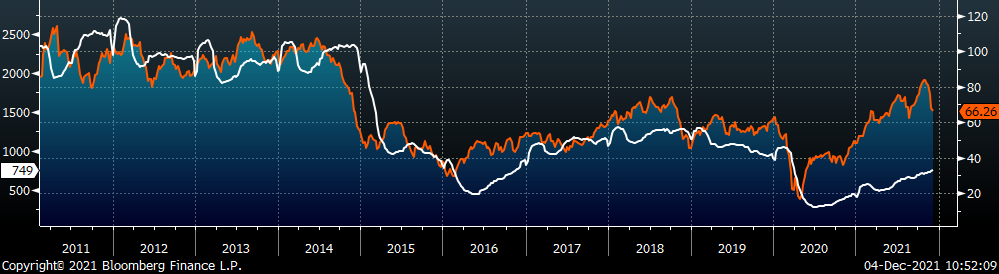
Front Month WTI Crude Oil Future (orange) and Baker Hughes N.A. Rig Count (white)
The list below details some upside and downside risks relevant to the steel industry. The bolded ones are occurring or highly likely.
Upside Risks:
- Inventory at end users and service centers below normal operational levels
- Higher share of discretionary income allocated to goods from steel intensive industries
- Changes in China’s policies regarding ferrous markets, including production cuts and exports
- Unplanned & extended planned outages, including operational issues leaving mills behind
- Energy & construction industry rebound
- Easing labor and supply chain constraints allowing increased manufacturing activity
- Mills extending outages/taking down capacity to keep prices elevated
- Global supply chains and logistics restraints causing regional shortages
- A weakening US Dollar
- Fiscal policy measures including a new stimulus and/or infrastructure package
- Fluctuating auto production, pushing steel demand out into the future
- Low interest rates
- Threat of further protectionist trade policies muting imports
- Unexpected and sustained inflation
Downside Risks:
- Increased domestic production capacity
- Elevated price differentials and hedging opportunities leading to sustained higher imports
- Steel consumers substitute to lower cost alternatives
- Steel buyers and consumers “double ordering” to more than cover steel needs
- Tightening credit markets, as elevated prices push total costs to credit caps
- Supply chain disruptions allowing producers to catch up on orders
- Limited desire to restock at elevated prices, causing a “Buyer’s Strike”
- Economic slowdown caused by the emergence of Coronavirus Variants
- Reduction and/or removal of domestic trade barriers
- Political & geopolitical uncertainty
- Chinese restrictions in property market
- Unexpected sharp China RMB devaluation