Content
-
Weekly Highlights
- Market Commentary
- Upside & Downside Risks


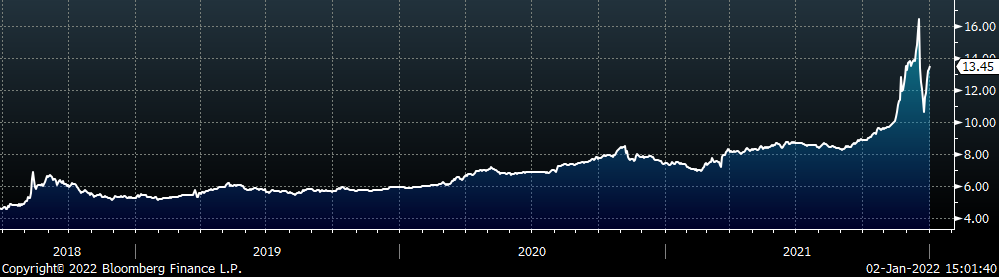
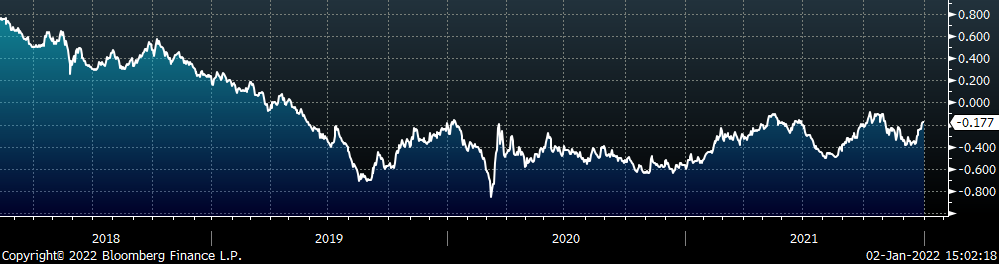
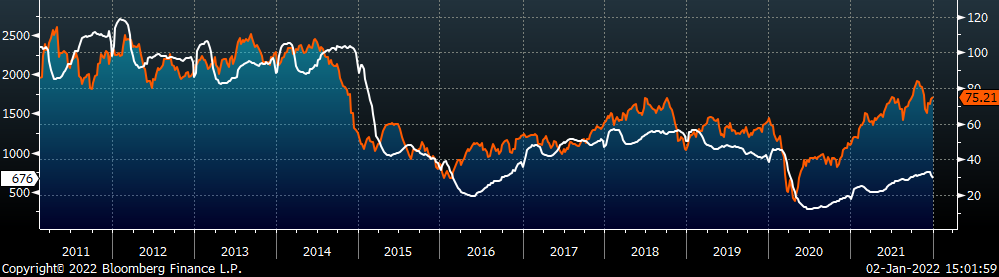
Over the final two weeks of the year, there were no substantial shifts in sentiment or momentum within the physical market and prices remain under significant pressure. While demand remains robust, the recent flood of imports has diminished any urgency to pay assessed spot prices from the mills. Additionally, it is now common knowledge that deals well below those published prices have taken place. In the past, this would not be groundbreaking information, year-end deals happen all the time. However, with an expectation for even higher levels of imports over the next three months, spot index prices are significantly elevated compared to fundamental support levels. As the downtrend continues and steel prices converge with their support levels, we urge you not to be complacent in assuming the price will continue reverting to its historic average. While the steel market is driven by its own supply and demand dynamics, it is not entirely insular and there is growing support for the thesis that the pandemic caused recession and recovery have caused irreversible changes to the U.S. economy and across the commodity complex. The chart below is the 2nd month lumber future.
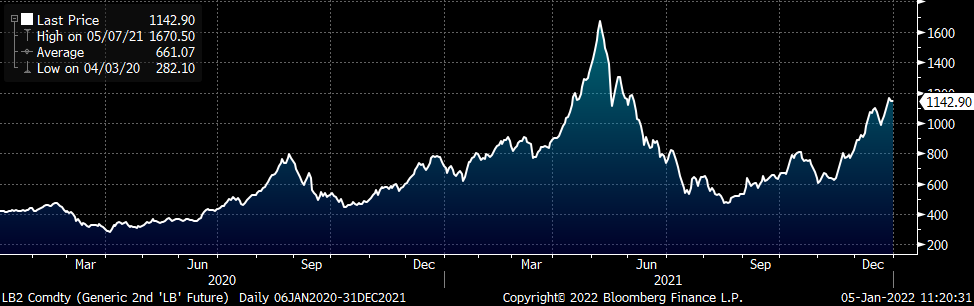
Last year, as the world rebounded from the pandemic caused recession and commodity prices exploded higher, one of the most remarked upon commodities was lumber. The price outpaced most of the remaining complex and more than tripled in six months. Peaking in early May of last year, it was the perfect anecdote for supply chain disruption and the economic recovery. Following that, buyers within the steel industry pointed at its 70% collapse over the following three months as an eventual road map for steel prices and closed the book. If that applies to you, this next part is very important: in the four and a half months since then, lumber has more than doubled. The point here, is that the U.S. economy and demand for goods remains robust. If you are still waiting for steel prices to go back to their pre-pandemic levels before you begin planning long-term, it may seem savvy right now, but we believe you will be burned again.
Below are the most pertinent upside and downside price risks:
Upside Risks:
Downside Risks:
The Platts TSI Daily Midwest HRC Index decreased by another $60 to $1,500.
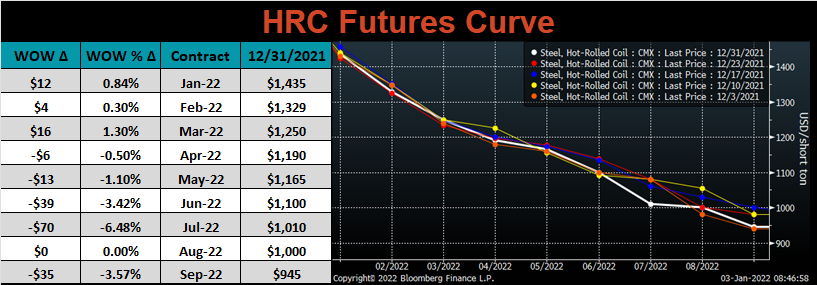
The CME Midwest HRC futures curve is below with last Friday’s settlements in white. Last week, the curve was higher in the front and lower in the back on a light volume of trades.
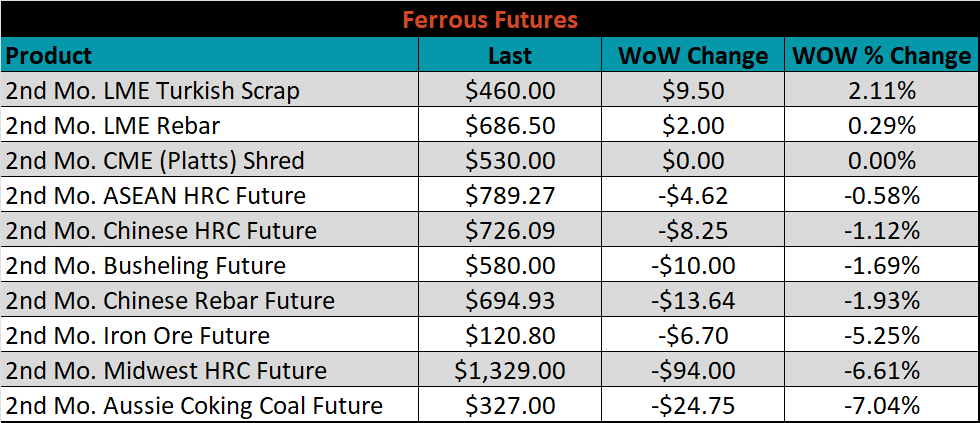
February ferrous futures were mostly lower, with Aussie coking coal down the most, losing 7%.
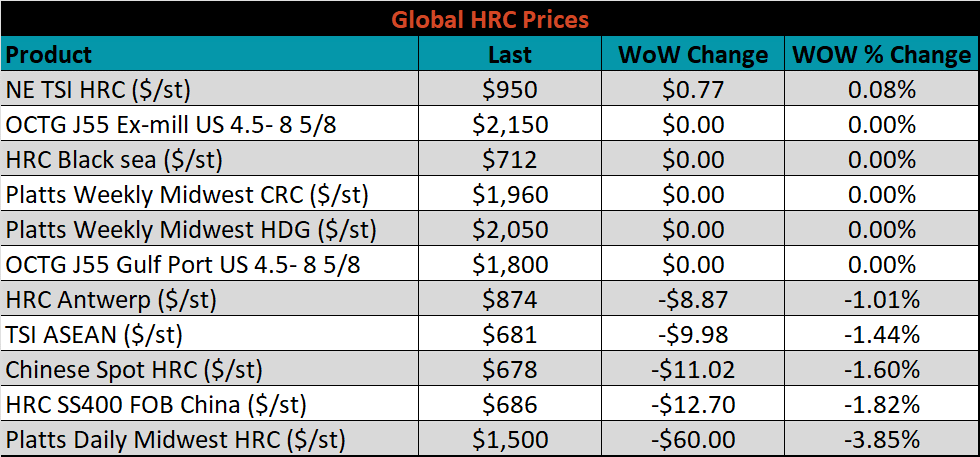
Global flat rolled indexes were mostly lower again this week, led by TSI Platts Midwest HRC, down 3.9%.
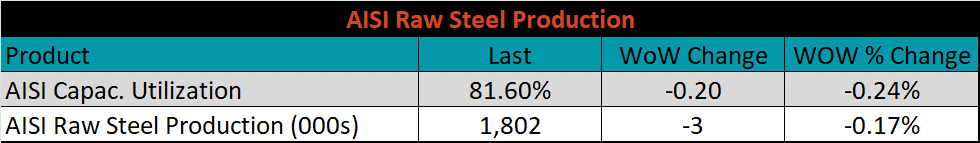
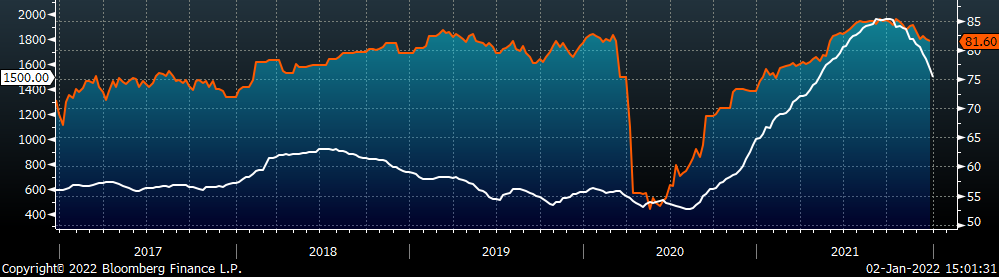
The AISI Capacity Utilization fell 0.2% to 81.6%.
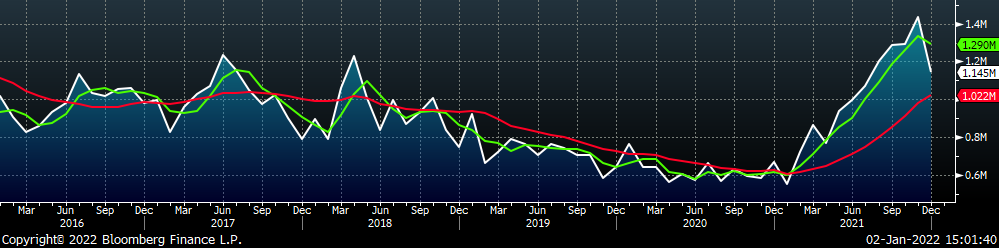
December flat rolled import license data is forecasting a decrease of 290k to 1.15M MoM.
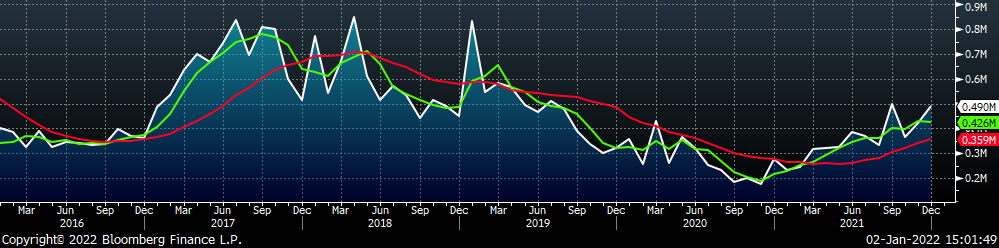
Tube imports license data is forecasting an increase of 69k to 490k in December.
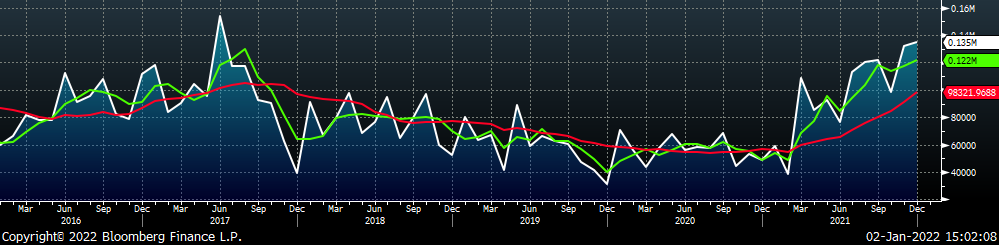
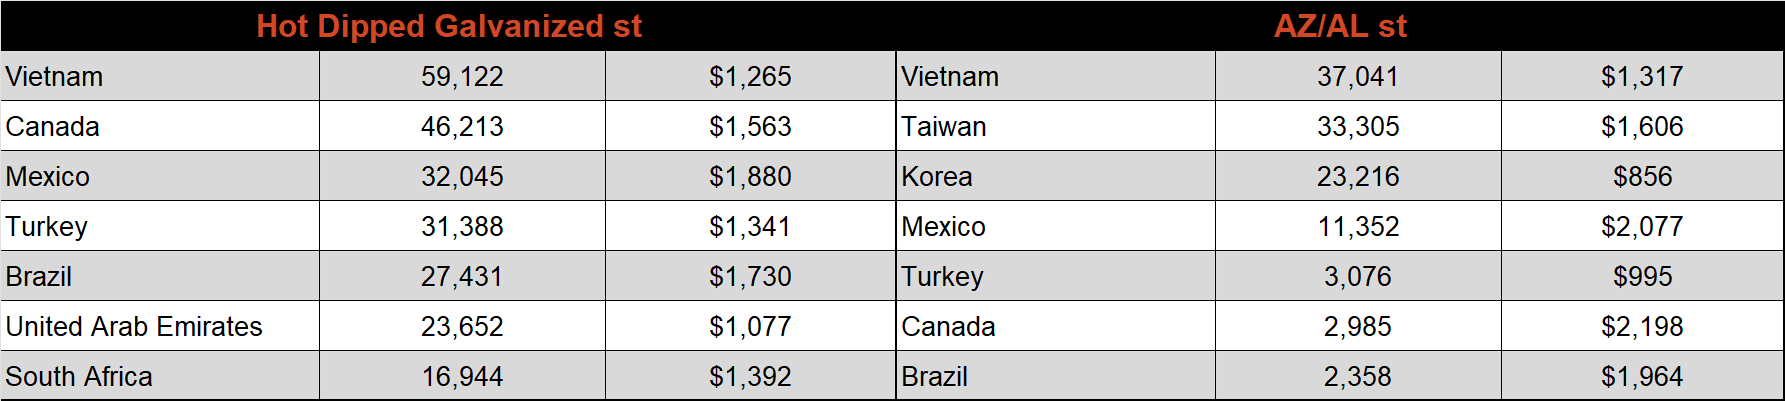
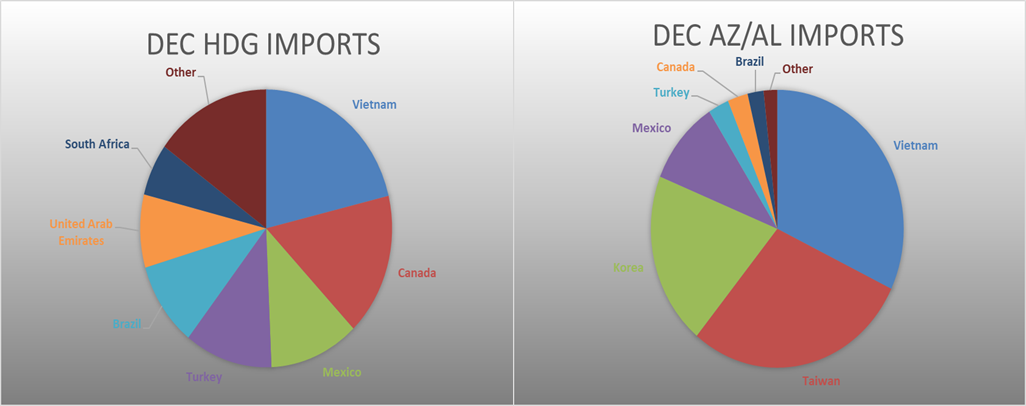
December AZ/AL import license data is forecasting an increase of 3k to 135k.
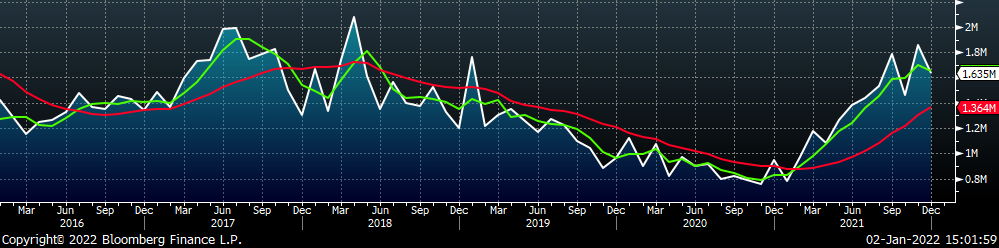
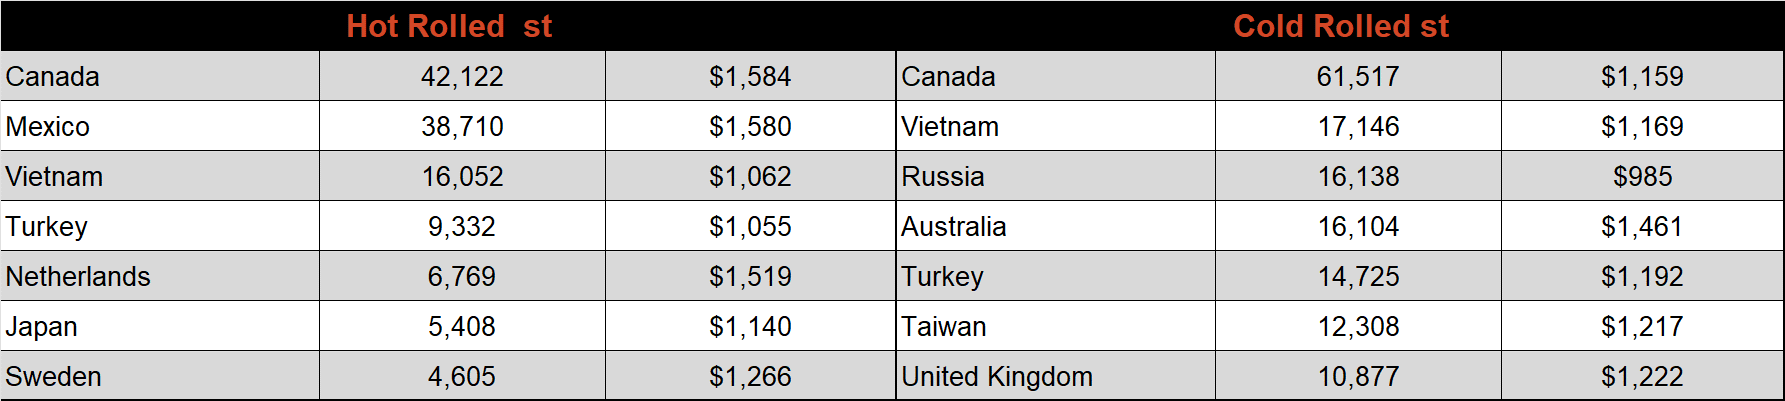
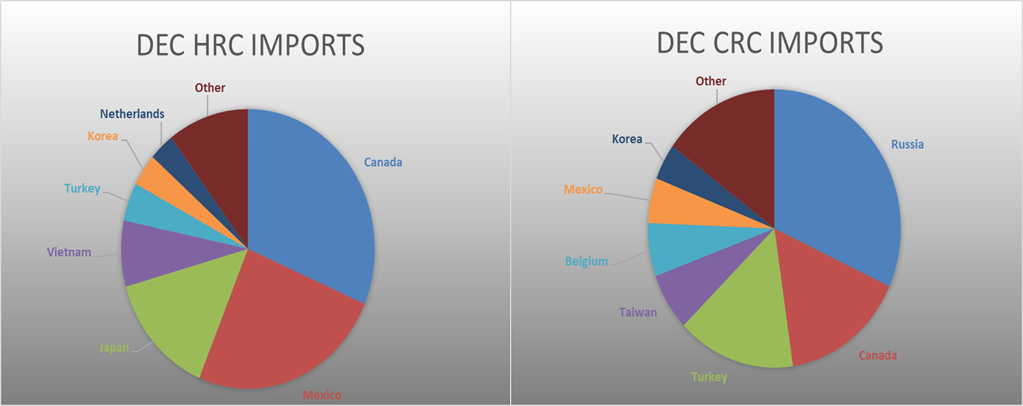
Below is December import license data through December 27th, 2021.
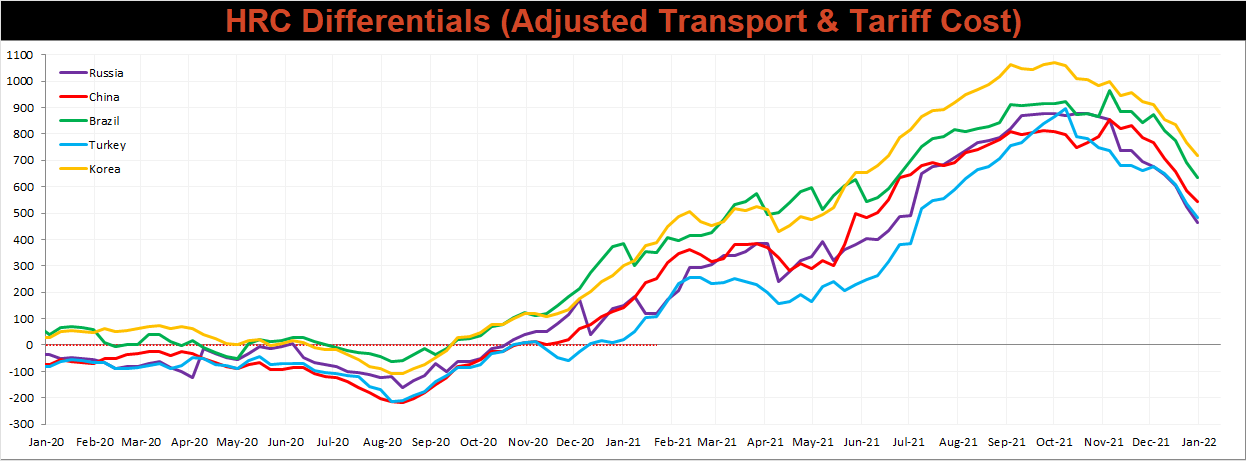
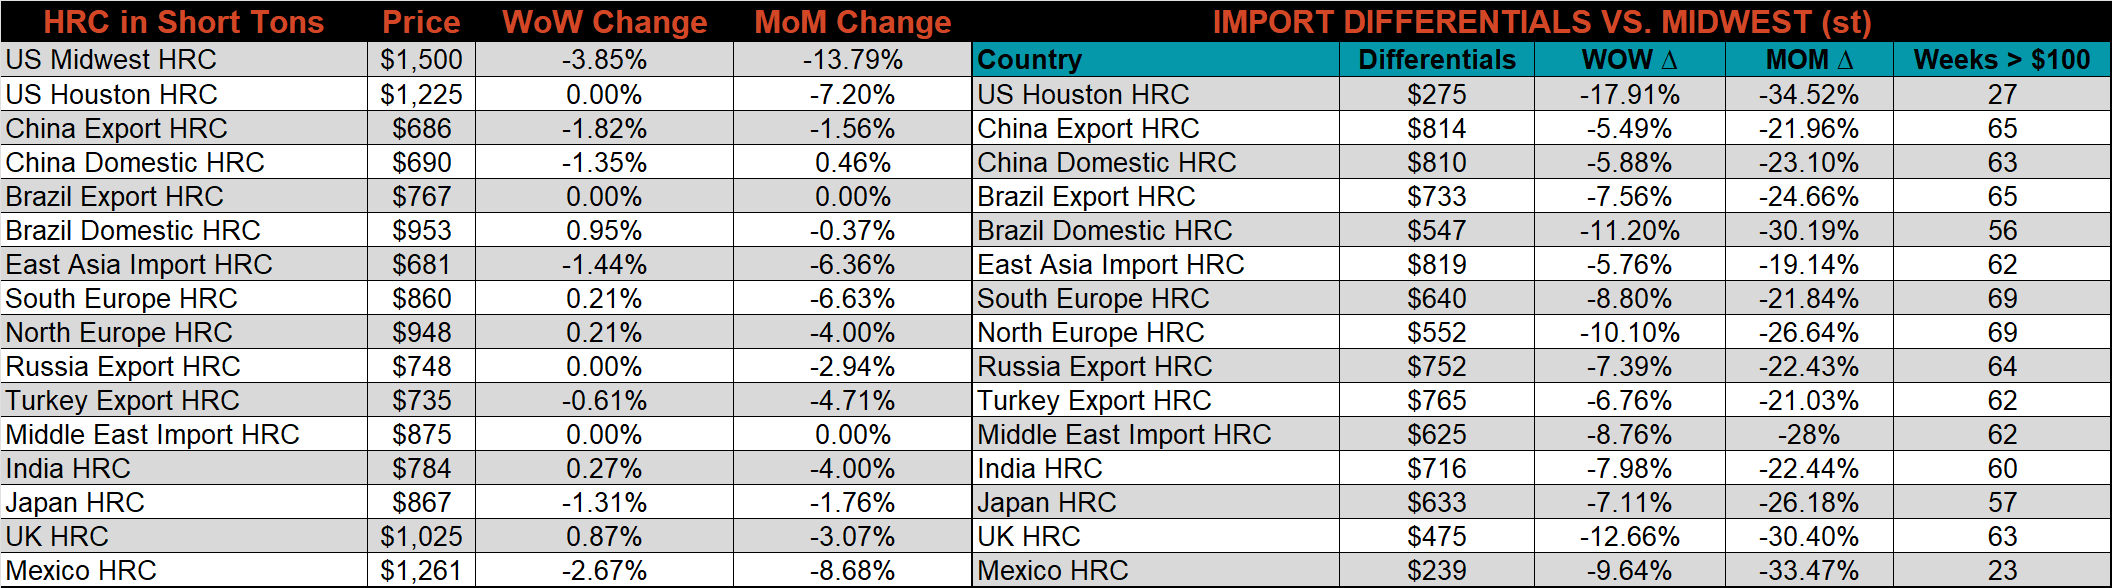
Below is the Midwest HRC price vs. each listed country’s export price using pricing from SBB Platts. We have adjusted each export price to include any tariff or transportation cost to get a comparable delivered price. All the watched countries differentials decreased for the 4th week in a row, as the U.S. price continues to fall at a more rapid pace than other global prices.
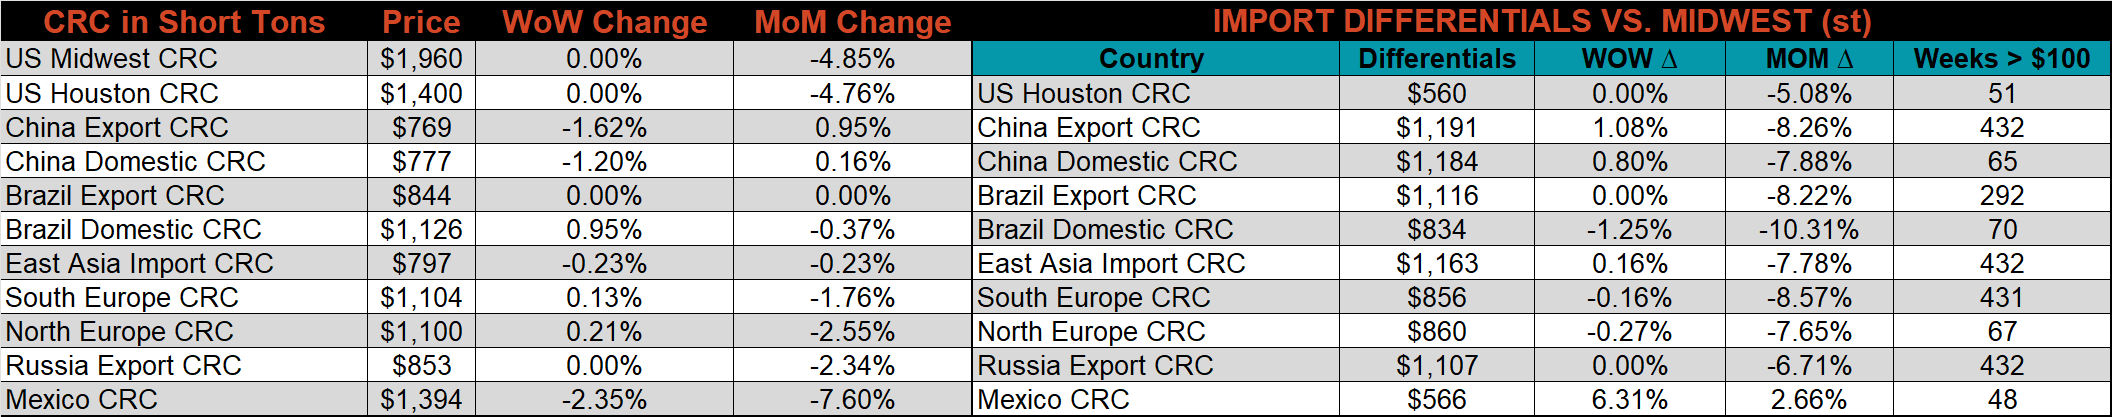
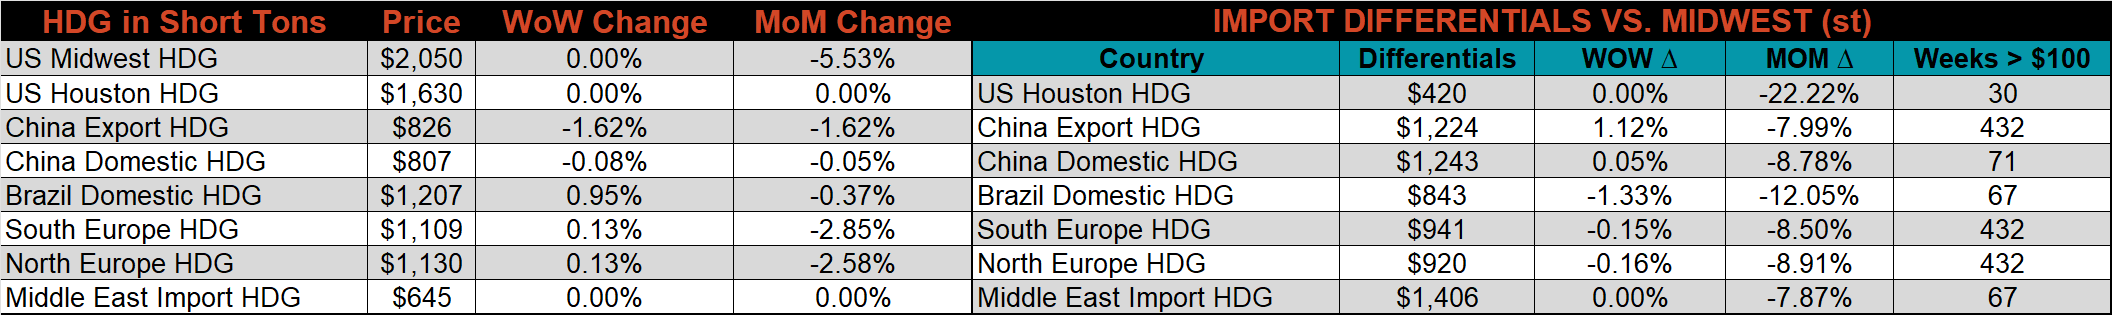
SBB Platt’s HRC, CRC and HDG pricing is below. The Midwest HRC price was lower this week, down 3.9%, while the CRC & HDG prices were unchanged. Outside of the U.S., the Mexico HRC price was down 2.7%.
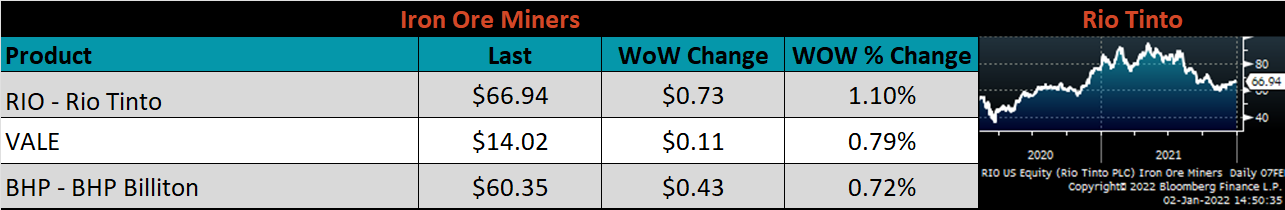
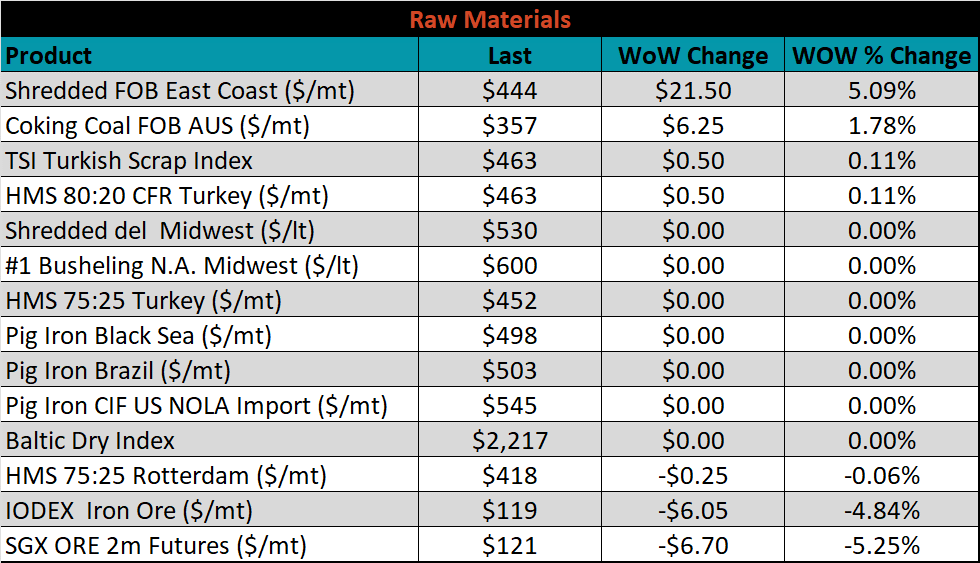
Raw material prices were mixed. East Coast shredded scrap rose 5.1%, while iron ore futures lost 5.3%.
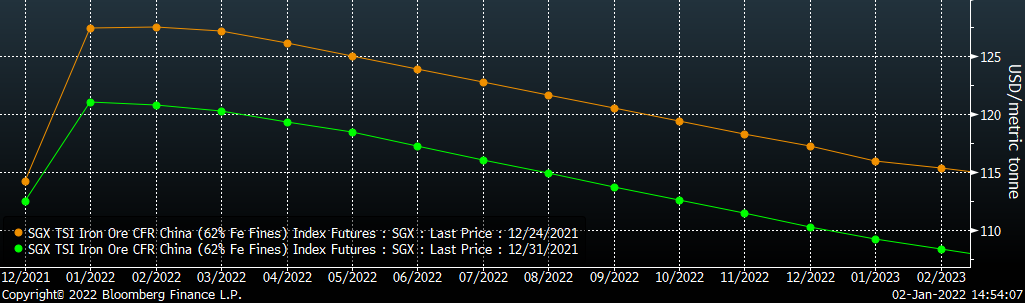
Below is the iron ore future curve with Friday’s settlements in green, and the prior week’s settlements in orange. Last week, the entire curve shifted lower at all expirations.
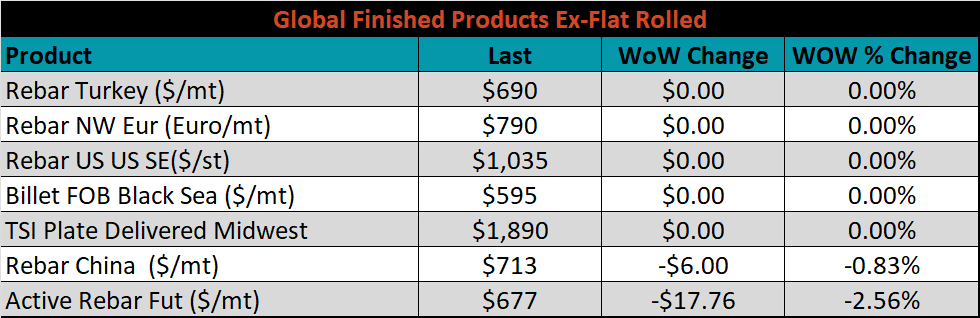
The ex-flat rolled prices are listed below.

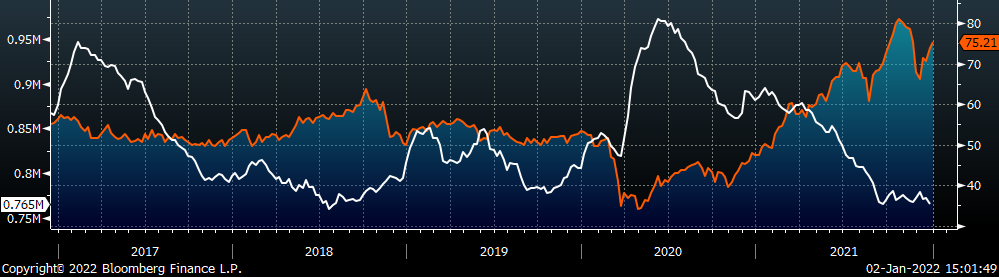
Last week, the February WTI crude oil future gained $1.42 or 1.9% to $75.21/bbl. The aggregate inventory level was down 0.9%, while crude oil production rose to 11.8m bbl/day. The Baker Hughes North American rig count was down 43 rigs, while the U.S. rig count was unchanged.

The list below details some upside and downside risks relevant to the steel industry. The bolded ones are occurring or highly likely.
Upside Risks:
Downside Risks: