Content
-
Weekly Highlights
- Market Commentary
- Risks


The market acceleration continued last week with indexes moving into the mid $800/st range for HRC. This continued into this week as mills have started asking for $900+ for February availability. These are unprecedented price moves, and with the market still in a structural shortage, getting worse by the day, mills appear to have unlimited control increasing prices. We have heard many in the market describe the current rally with the following phrases, with which we would generally agree: “This cannot last forever”, “Beware of the other side”, and “This is unsustainable”. However, this same price rally has also been described as “euphoric”, “a mania”, and “a speculative bubble”. To these, we take exception, and this week we will dig into the dangers of accepting this narrative instead of understanding the fundamentals driving the price higher.
In both commodity and financial market history, there have been numerous occasions where prices have moved to unsustainable levels, driven by multiple factors, including psychology and emotions, which are being studied by behavioral economists. Rather than getting into the obscure details of behavioral science, let us look at a recent real world example of speculation: Negative oil prices. Pandemic related shutdowns, a Saudi led price war, and an oversupplied market drove domestic and global oil prices to the lowest levels since 2015 in the spring. However, these fundamental factors were not the cause of prices collapsing into negative territory on April 20th. Rather, negative prices came about when speculators bought and held futures with no intention of purchasing the contractually obligated barrels of physical oil. They were only hoping to sell the futures at a higher price. The market discovered this and made the speculators pay a significant price to unload the contracts days before they were required to take delivery of physical oil. Once this speculative position was closed, the market price normalized and moved back above $20/barrel within days.
Let’s turn to the HRC futures market. Any entity taking positions in the exchange traded HRC futures contracts must be designated as either a speculative or commercial position, which are aggregated and reported. Speculative entities are broadly labeled banks or funds, while commercial entities are mills, service centers or end users all engaged in hedging physical material. The below chart shows the weekly changes in the aggregate speculative positions.
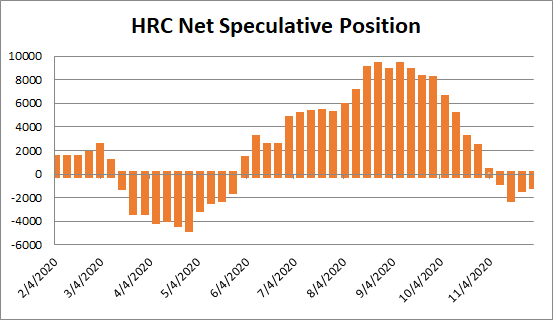
Speculators – those taking positions with the sole purpose of predicting where the price will go – are currently flat. They are not betting that the price will go either direction. Why does the distinction between fundamental market factors (in the report below) and speculative positioning matter? Because speculation and “bubbles” can end suddenly. However, major changes in supply and demand will take time. In a market that is experiencing a structural steel shortage, driven by increasing demand during the economic recovery and constrained supply, it will take multiple months for these dynamics to rectify. Last year’s prices are not anywhere in the near future.

The chart below shows the relationship between the Platts Midwest HRC index and the ISM Manufacturing PMI over the past 10 years.

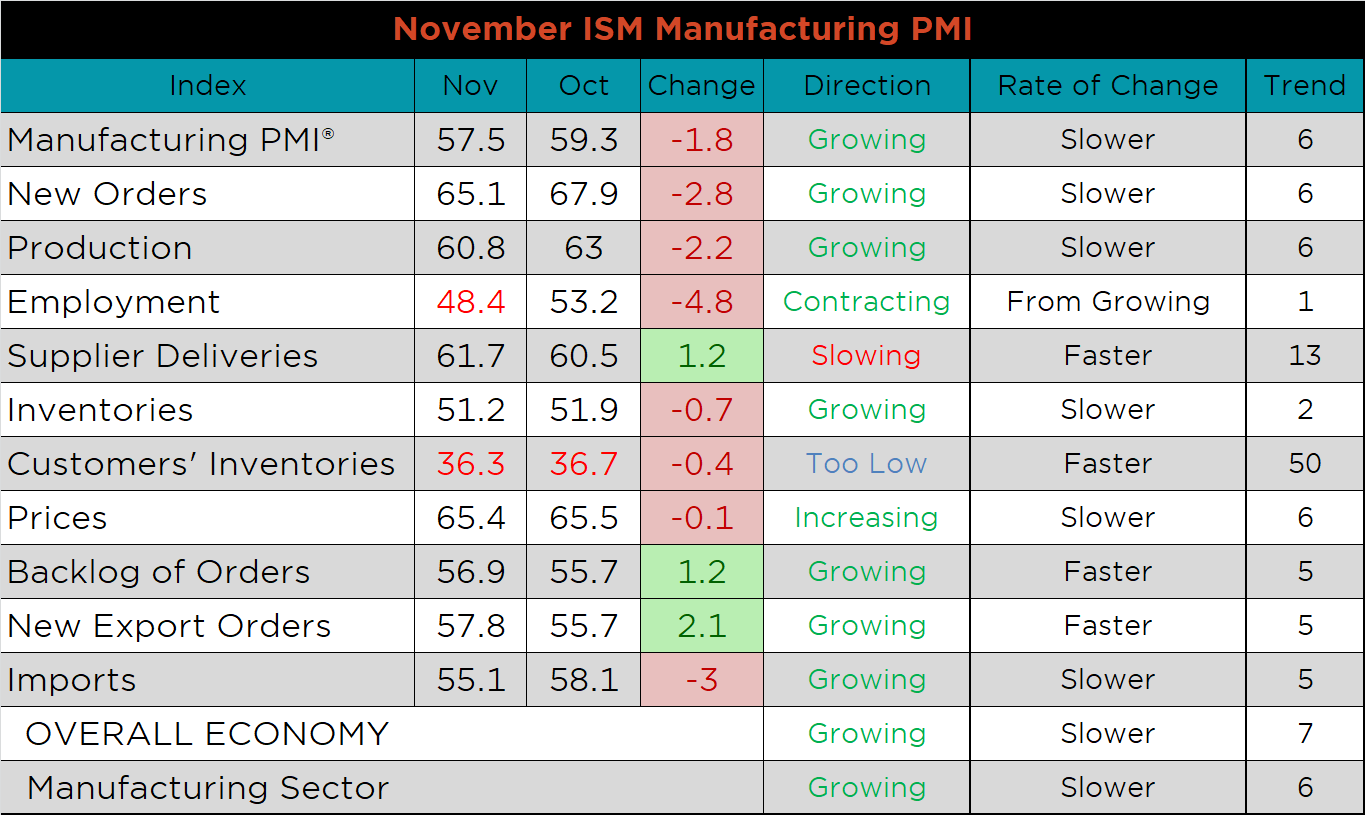
The November ISM Manufacturing PMI and subindexes are below. The topline PMI number dipped 1.8 points to 57.5, but remains well in expansion territory.
The chart below compares the ISM prices subindex with the ISM customer inventories subindex. The customer’s inventory subindex fell further and the prices subindex was down just slightly. Prices, essentially unchanged at such an elevated level suggest restocking inventory is currently too costly. The second chart shows the strength in both the new orders plus backlog subindexes. This suggests that there is in fact significant demand for manufactured goods at these elevated prices. Another interesting factor to note is the new export orders subindex increasing, which could be the result of recent dollar weakness. The final chart expands on this dynamic of short-term tightness and shows the supplier delivery subindex increasing further.


PMI subindexes were mostly lower MoM, but significantly higher than last year’s levels. Employment dipped back into contraction territory, joining customers’ inventories, but all other subindexes are expanding.


November global PMI printings were mixed; however, 19 of the 25 watched countries’ PMIs remain in expansion. PMIs in the US, Germany and the Eurozone decreased, while China (Caixan), China (Official) and Japan all increased. Japan remains the largest economy still in contraction, printing at 49.
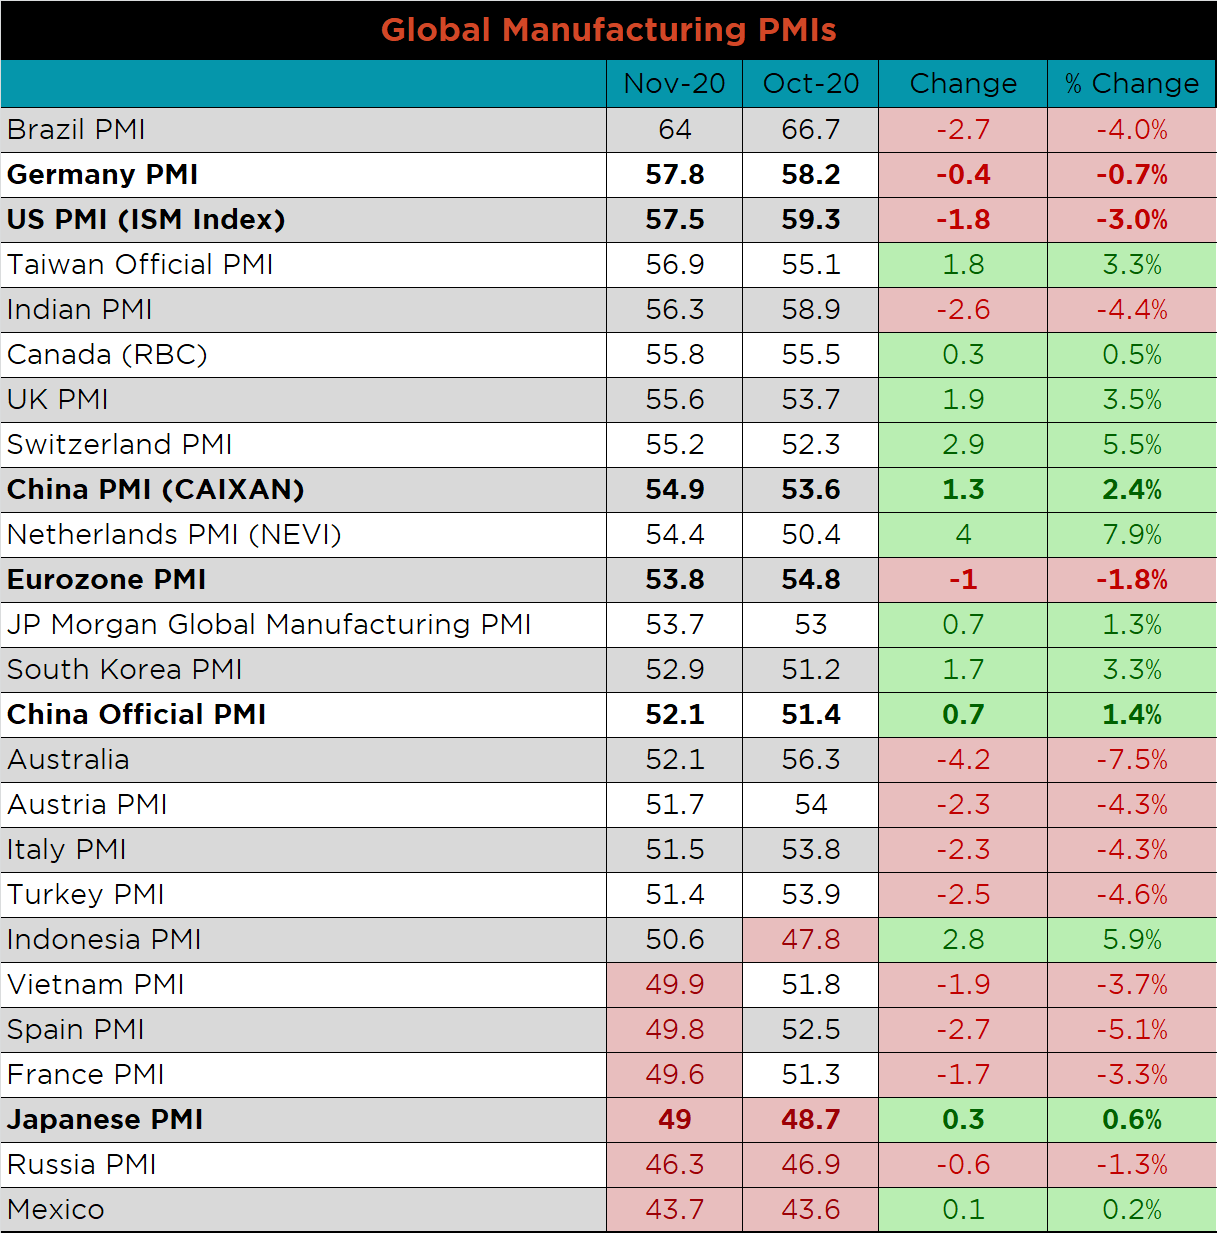


Both China’s official manufacturing PMI and the Caixan PMI increased, and remain in expansion.

The table below breaks down China’s official manufacturing PMI subindexes, which shows overall MoM and YoY strength. The backlog and supplier delivery times decreased compared to October’s readings. The employment, stock of finished goods, inventory of raw materials and backlog remain in contraction, while all other readings show growth.


October seasonally adjusted U.S. construction spending was up 1.3% compared to September, and 3.7% higher than a year ago.

The white line in the chart below represents not seasonally adjusted construction spending in 2020 and compares it to the spending of the previous 4 years. Spending in October was down compared to September, but remains above last year’s levels. The last two charts show the YoY changes in construction spending. Private non-residential spending decreased further in October, the seventh month in a row, while residential spending continues to show remarkable strength.


November U.S. light vehicle sales decreased further to a 15.5m seasonally adjusted annualized rate (S.A.A.R), and moved below their 10yr average. The second chart shows the relationship between the unemployment rate and auto sales. The unemployment rate is inverted to show that declining unemployment typically leads to increasing auto sales. As mentioned, auto sales were down, while employment continues to improve, albeit at a slightly slower pace.


Below are the most pertinent upside and downside price risks:
Upside Risks:
Downside Risks:

The Platts TSI Daily Midwest HRC Index increased by $56 to $840.

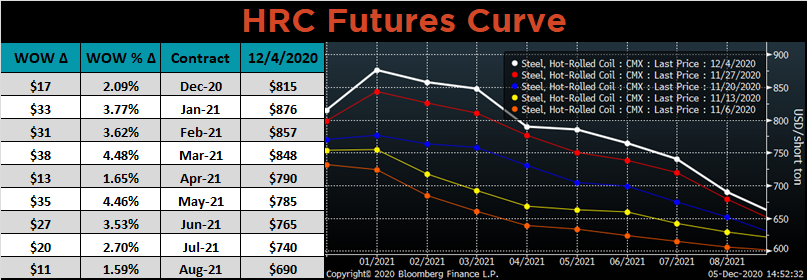
The CME Midwest HRC futures curve is below with last Friday’s settlements in white. Last week, the entire curve shifted higher, with prices in the middle of next year quickly approaching $800.
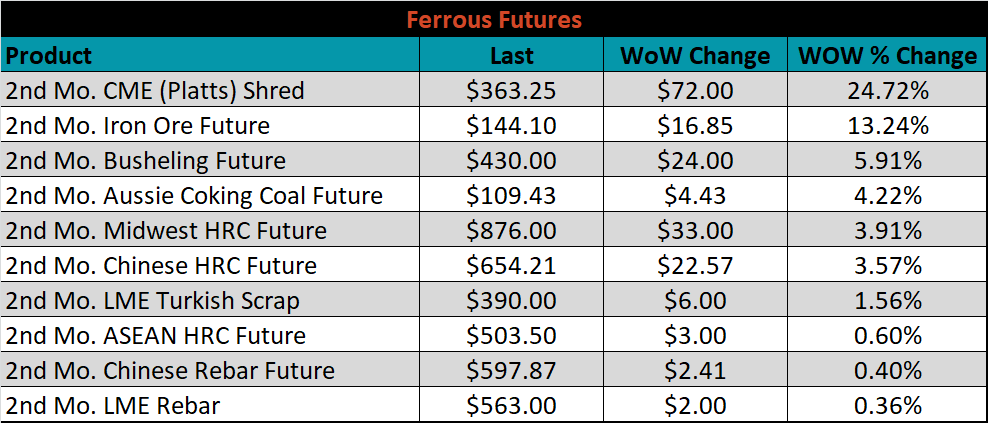
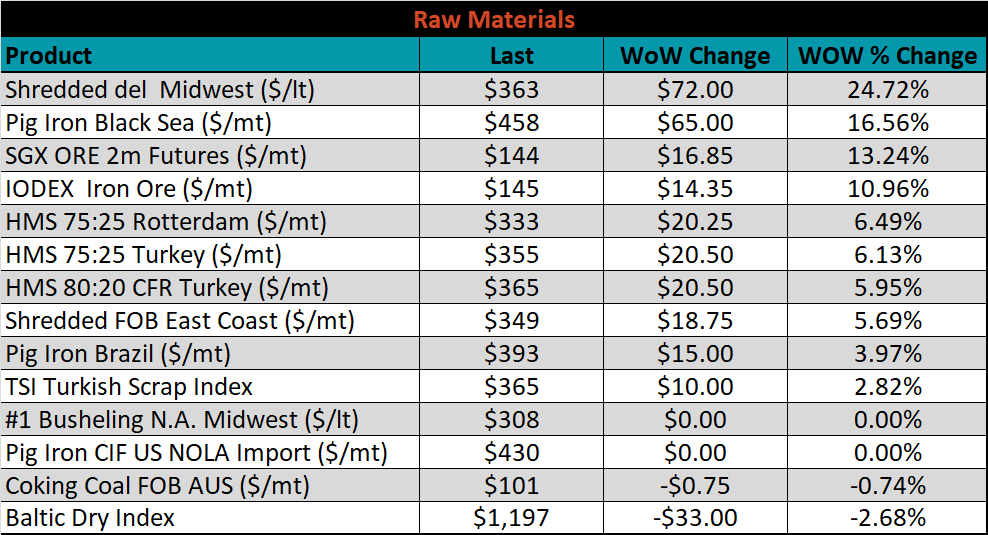
December ferrous futures were all higher, led by Midwest shredded, up 24.7%.
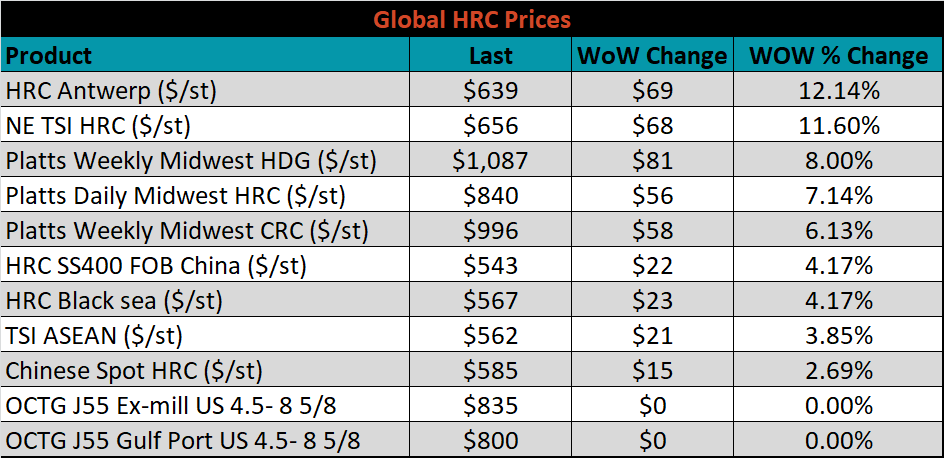
The global flat rolled indexes were all higher, led by Antwerp HRC, up 12.1%.
The AISI Capacity Utilization rate decreased 0.9% to 70.6%.


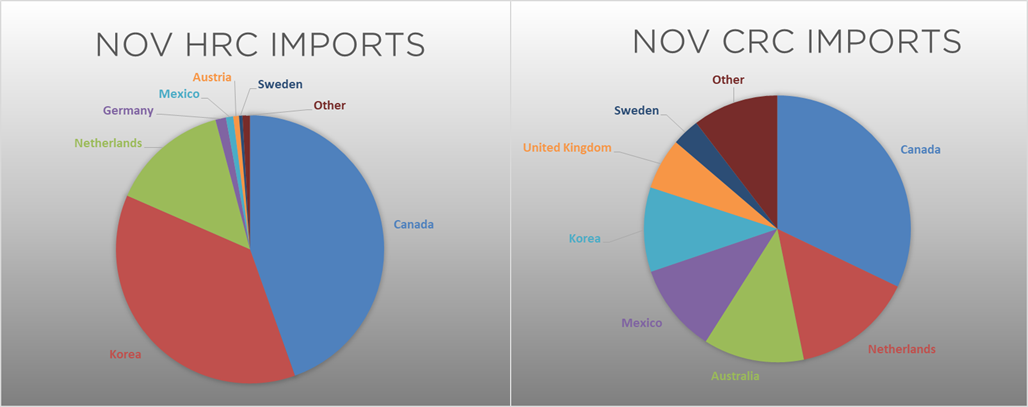
November flat rolled import license data is forecasting an increase of 30k to 623k MoM.

Tube imports license data is forecasting a decrease of 30k to 169k in November.


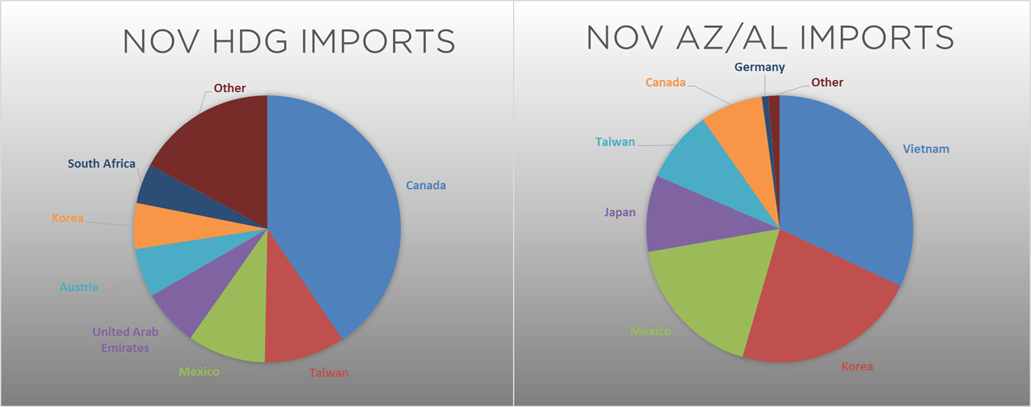
November AZ/AL import license data is forecasting a 9k increase to 53k.

Below is November import license data through December 1, 2020.


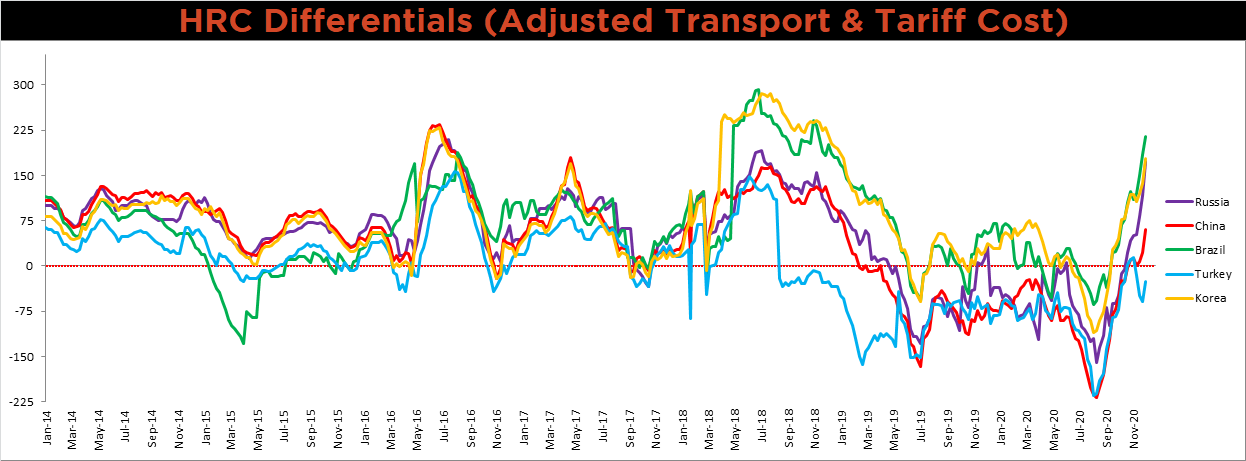
Below is the Midwest HRC price vs. each listed country’s export price using pricing from SBB Platts. We have adjusted each export price to include any tariff or transportation cost to get a comparable delivered price. All the watched differentials moved significantly higher. As global prices have rallied over the past 17 weeks, the U.S. domestic price has increased by approximately $275 dollars more than global prices, with this expanded differential leaving the domestic market susceptible to cheaper imports.
SBB Platt’s HRC, CRC and HDG pricing is below. The Midwest HDG, HRC and CRC prices were up 8%, 7.1% and 6.1%, respectively. Globally, the Southern and Northern European HRC prices were up, 14.1% and 11.2%, respectively.


Raw material prices mostly higher, led by Midwest shredded, up 24.7%, while Aussie coking coal was down 0.7%.
Below is the iron ore future curve with Friday’s settlements in orange, and the prior week’s settlements in green. Last week, the curve jumped significantly higher across all expirations.

The ex-flat rolled prices are listed below.


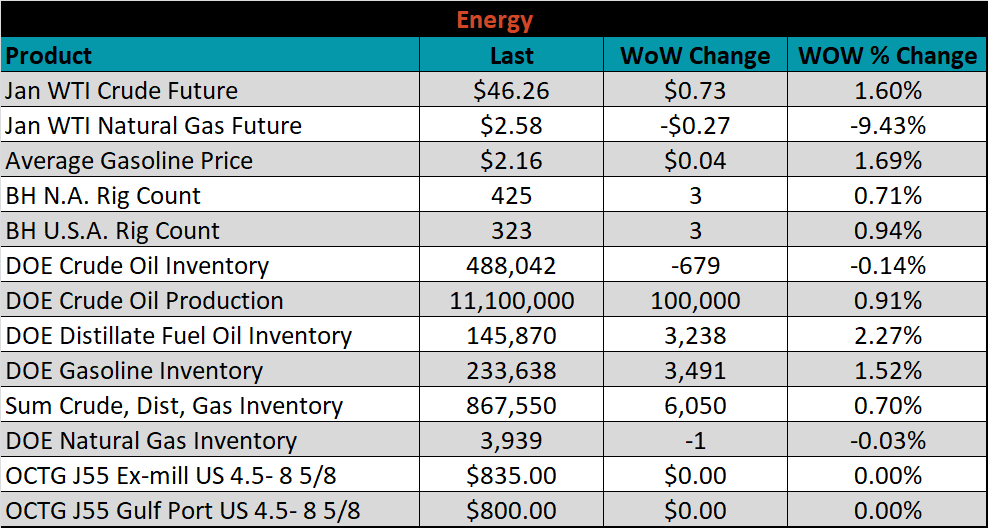
Last week, the January WTI crude oil future gained another $0.73 or 1.6% to $45.53/bbl. The aggregate inventory level was up 0.7% and crude oil production increased to 11.1m bbl/day. The Baker Hughes North American and U.S. rig counts were up 3 rigs.


The list below details some upside and downside risks relevant to the steel industry. The orange ones are occurring or look to be highly likely. The upside risks look to be in control.
Upside Risks:
Downside Risks: