Content
-
Weekly Highlights
- Market Commentary
- ISM PMI
- Global PMI
- Construction Spending
- Auto Sales
- Risks


Last week this report focused on some of the drivers of the current HRC price rally, namely raw material and global ferrous price strength. Over the last week, this trend has continued, with the Midwest HRC price grinding higher and the December scrap buy moving up $30 to $40 with further increases expected in January. Additionally, the China export price continues to strengthen as demand outlook improves, construction spending strengthens and the government in Beijing signaled it would increase stimulus measures. With the evolving global price rally, we will focus this week on price differentials, specifically the China export price differential, and how they affect trade, imports and domestic supply.
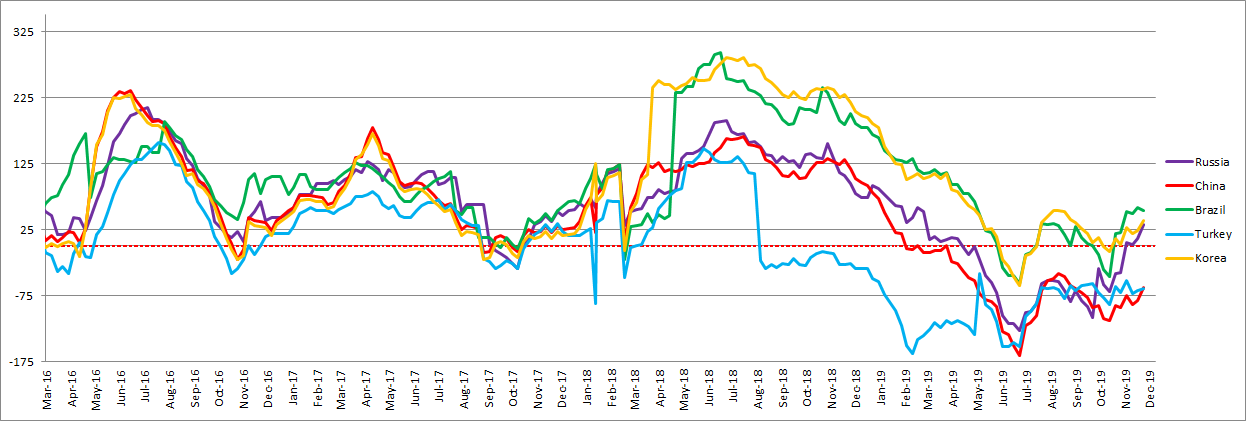
The below graph has consistently appeared in this report, and receives constant attention here at Flack as the China export price drives global pricing. As a reminder, this graph shows the difference between the Midwest HRC price and the China export price, including transportation costs.
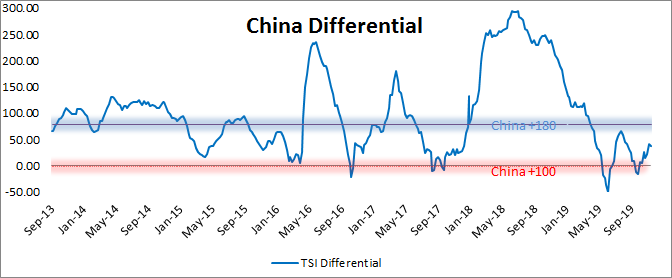
As the China price rallies, the zero line in the graph, the horizontal red line, also moves higher. The horizontal zero line reflects a pricing environment where it is unattractive for domestic companies to import material. The increasing price differential over the last two months signals that the domestic price has increased faster than the China export price and import prices appear more attractive than they were in October. However, the current differential is still below its historical average (blue horizontal line), signaling that domestic prices must increase further to spur a significant level of imported material.
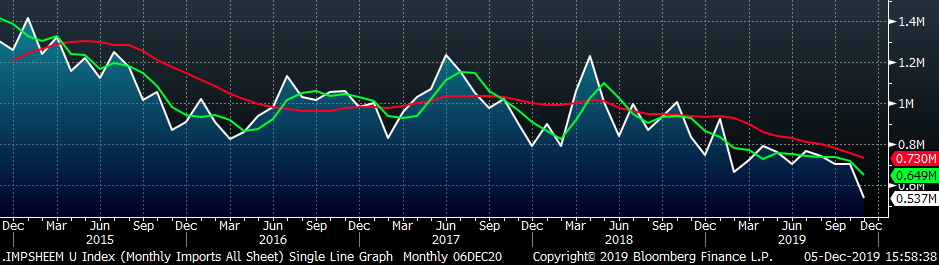
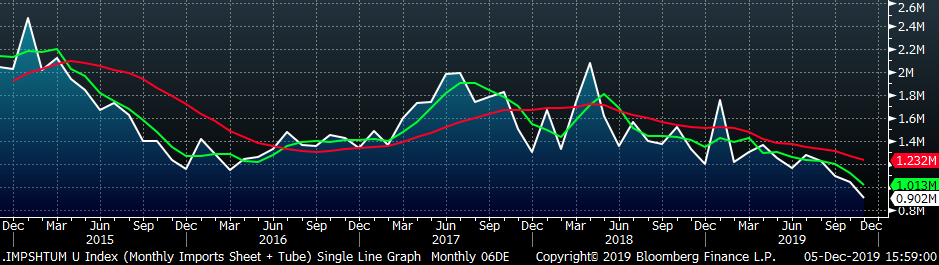
Current import levels are extremely low and appear likely to remain at these levels. The below chart shows how Net Sheet Imports (imports minus exports) have declined over the last two years.
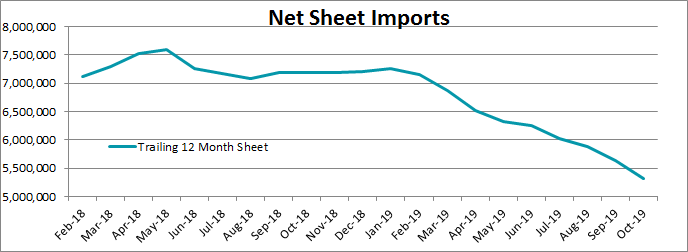
Due to longer import lead-times, there is a lag in the timing of pricing effects on actual imports. This lag, along with the uncertainty inherent in importing material, makes managing inventory levels challenging. Across the domestic supply chain, companies are increasing their focus on inventory management after the challenging past year for those holding material. Low imports and inventory levels divert spot buyers to domestic mills. Therefore, we expect these low import levels, along with the global price rally, to remain supportive of the domestic price through the end of the year.
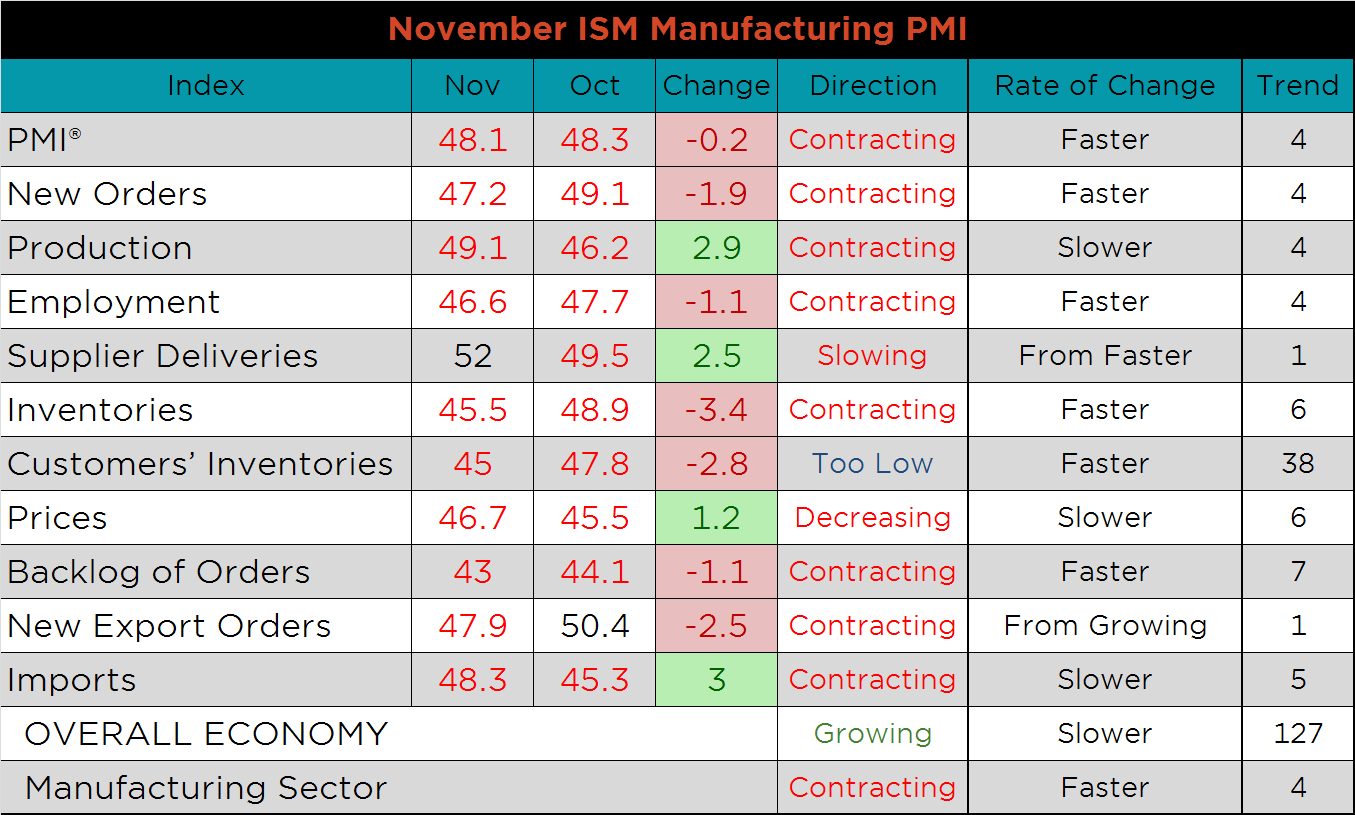
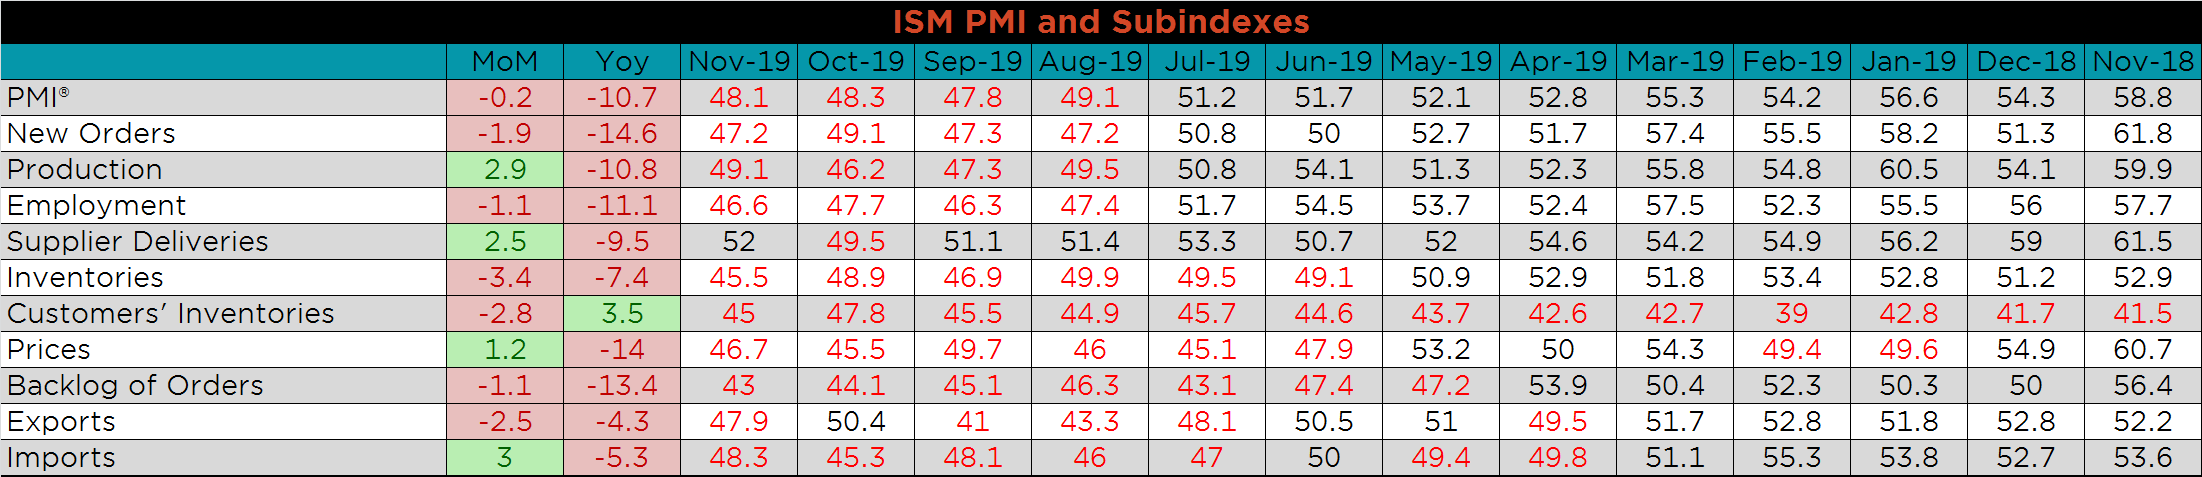
The November ISM Manufacturing PMI and subindexes are below. The topline PMI Manufacturing number dipped slightly to 48.1; it has been in contraction since August.
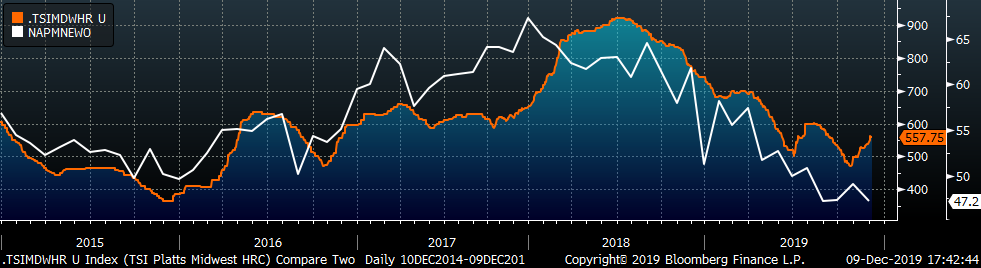
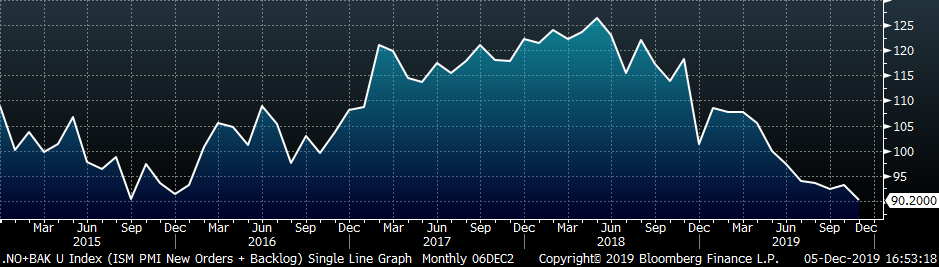
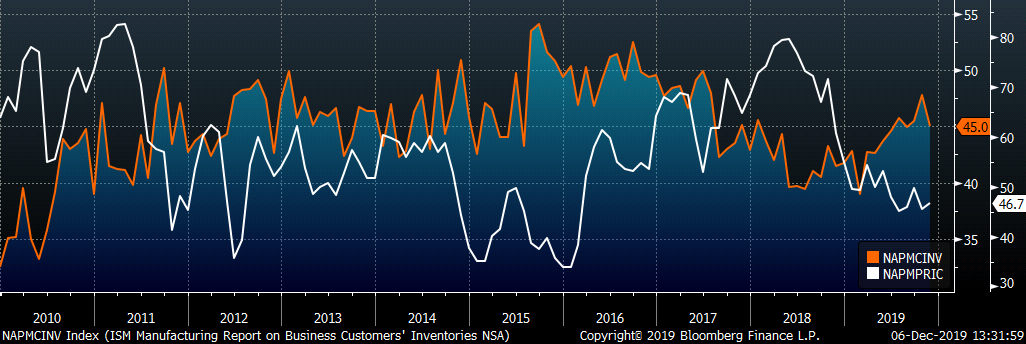
The chart below compares the ISM new orders subindex with the Platts TSI Daily Midwest HRC Index. While the HRC price steadily increased through November, the new orders subindex did not. The second chart adds the new orders and backlog subindexes together, the lower print in November by both subindexes shows declining overall demand than in October. Finally, the third chart shows the prices index and the customers’ inventory subindex, with historically high customer inventory levels among low prices. With weak demand signals, this indicates that increases in price will be met with destocking, tempering any upside to prices.
The supplier deliveries subindex rose 2.5 point to 52 and is now the only subindex in expansion. Imports, production and prices were all higher than their October readings, but they remain in a contractionary territory. Inventories, customer inventories and new export orders were down the most, 3.4, 2.8 and 2.5 points lower, respectively. This destocking and weak demand is likely to continue through the end of the year based on seasonal factors.
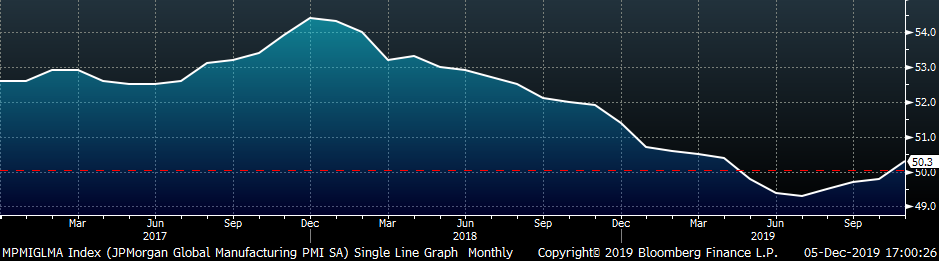
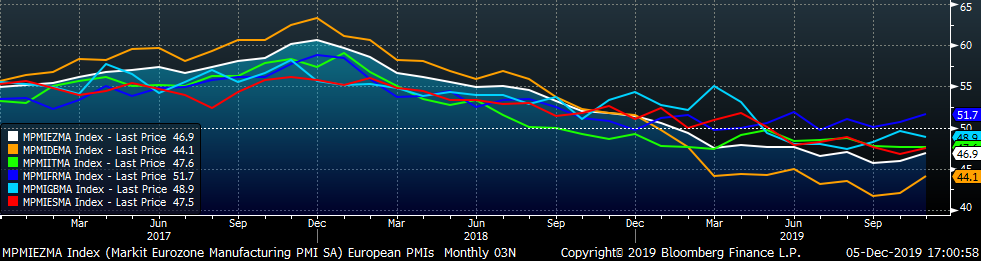
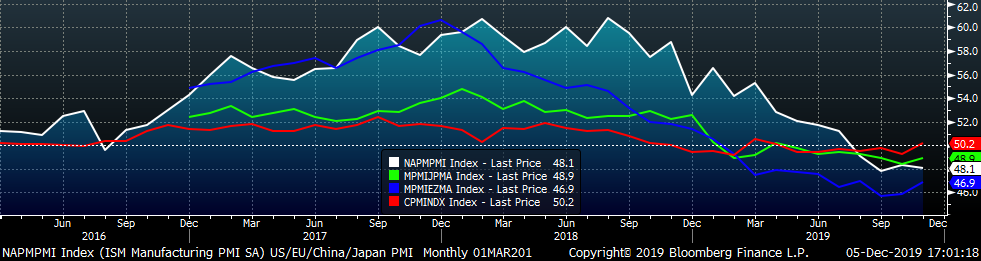
This month’s global PMI printings show overall weakness in many major manufacturing countries. The Chinese Official PMI printed 0.9 points higher and into expansionary territory for the first time since April. The German and Eurozone PMI’s both printed 2 points and 1 point higher, respectively but remain in contraction, along with the U.S., which printed slightly lower.
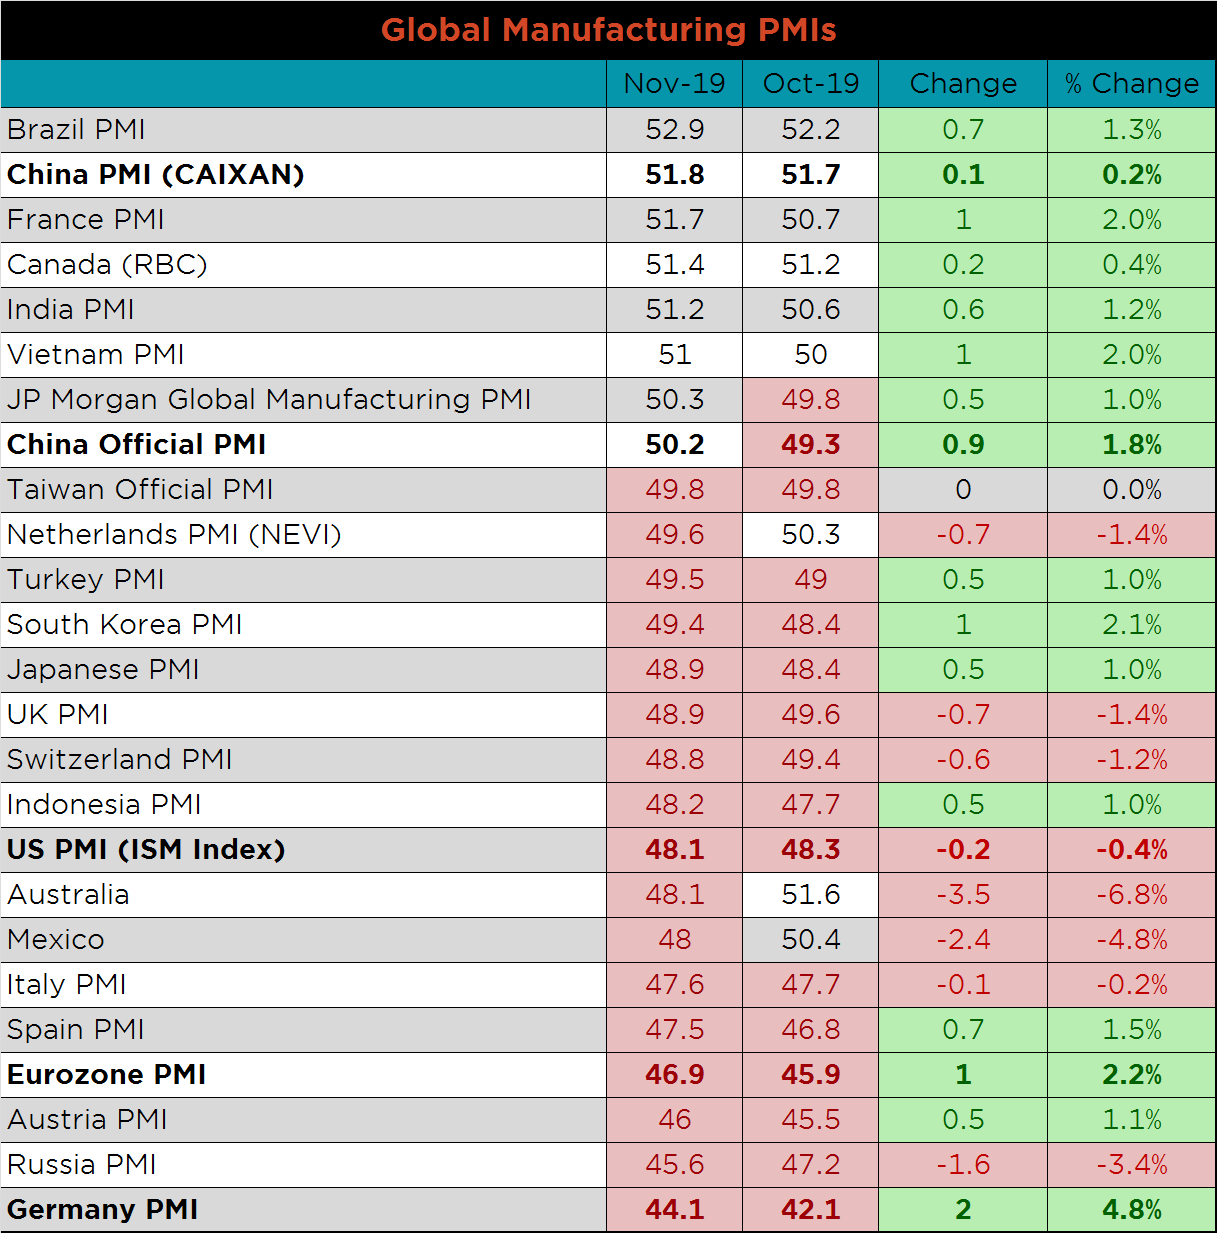
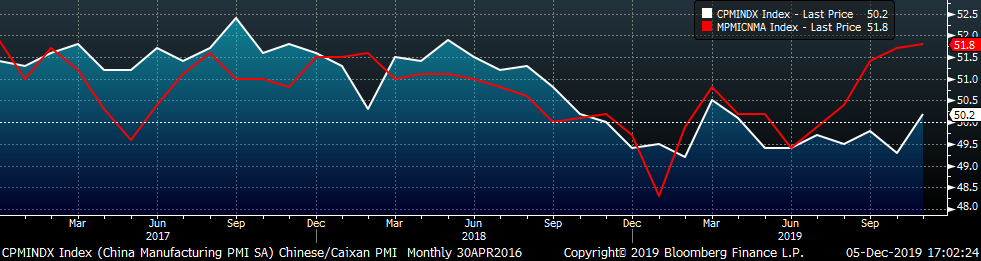
China’s official PMI printed up 0.9 points to 50.2. The Caixan Manufacturing PMI continued to trend higher as well, printing up to 51.8. The Chinese central government releases the official PMI, while Markit, a London-based global data provider, releases the Caixan PMI.
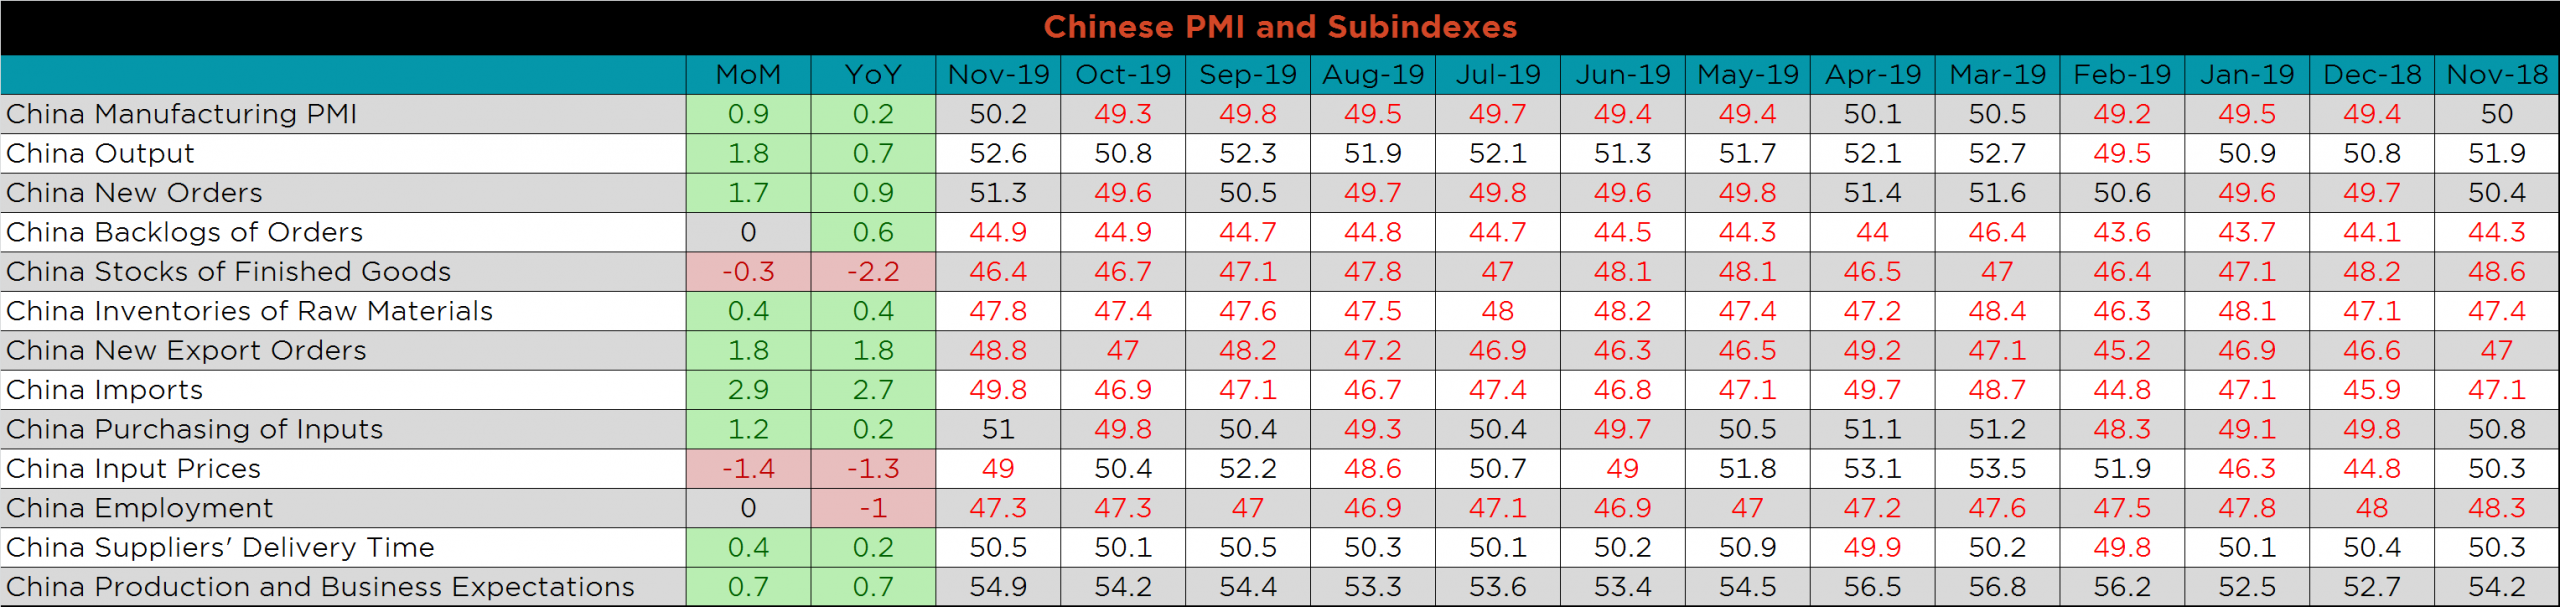
The table below breaks down China’s official manufacturing PMI subindexes. The higher headline reading shows strength across the board, as decreasing input prices and lower stock of finished goods are the only negative MoM changes. These two changes should be supportive for additional expansion, along with increasing demand, shown by expanding new orders and purchasing of inputs.
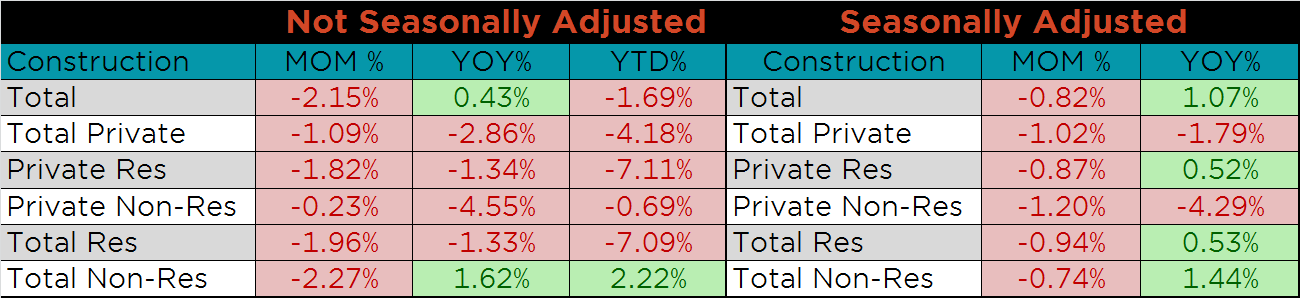
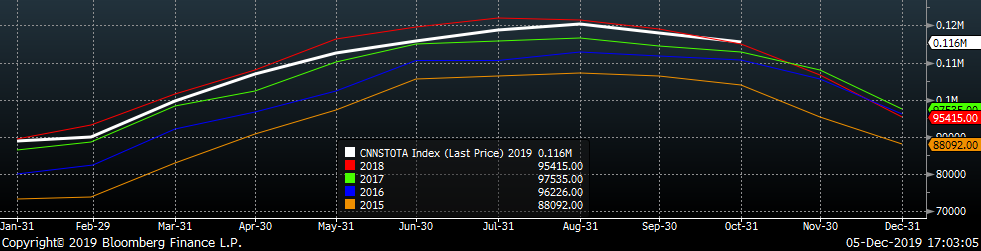
October’s seasonally adjusted U.S. construction spending was down 0.8% MoM, but up 1.1% YoY. Not seasonally adjusted spending was lower across the board MoM, while total construction spending is up slightly YoY, primarily due to total non-residential spending increasing 1.6%. Year-to-date, total non-residential spending remains strong, 2.2% above 2018 levels.
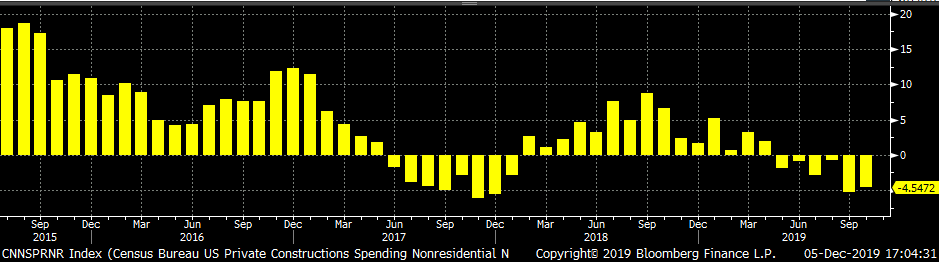
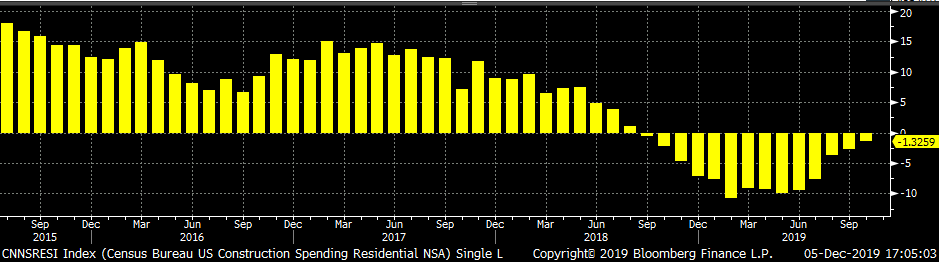
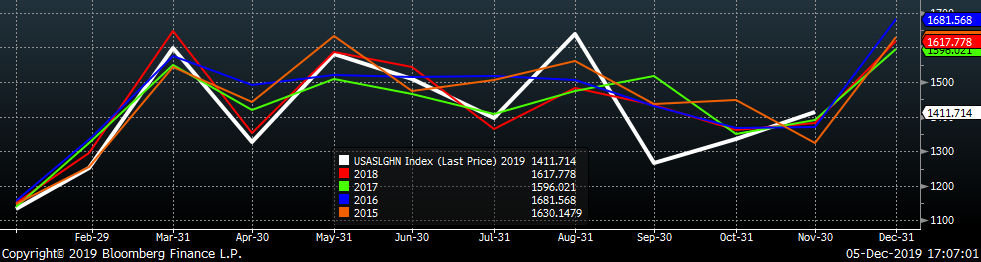
The white line in the chart below represents construction spending in each month of 2019 and compares it to the spending of the previous 4 years. Spending levels rose above the prior years’ spending levels for the first time 11 months. The last two charts show YoY changes in spending. Private non-residential spending improved slightly but remains weak, while residential spending continues to improve; low mortgage rates should continue to fuel this trend.
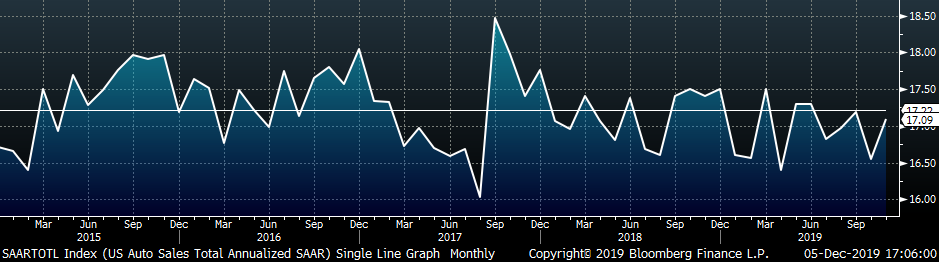
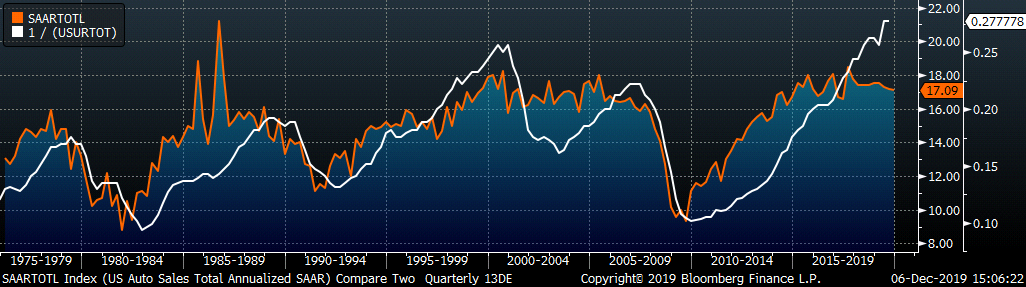
November U.S. light vehicle sales increased to a 17.09m seasonally adjusted annualized rate (S.A.A.R). The white line in the second chart below compares monthly light auto sales with previous years’ levels. After two months of sales at the lowest levels of the previous 4 years, November came in the highest over the same period. The third and final chart depicts the relationship between the unemployment rate and auto sales. We have inverted unemployment rate to show how declining unemployment typically leads to increasing auto sales. Annualized auto sales appear to have peaked for the cycle, while the employment continues to improve.
Below are the most pertinent upside and downside price risks:
Upside Risks:
Downside Risks:
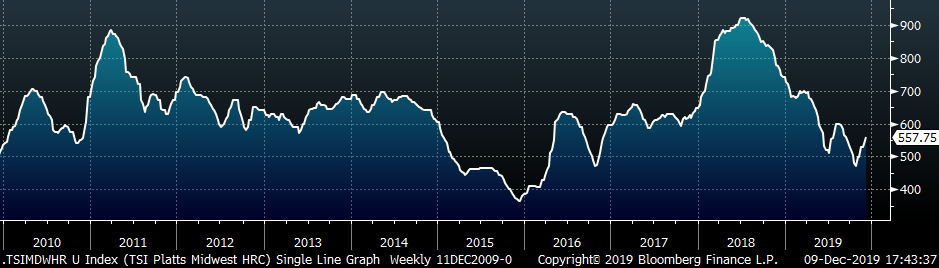
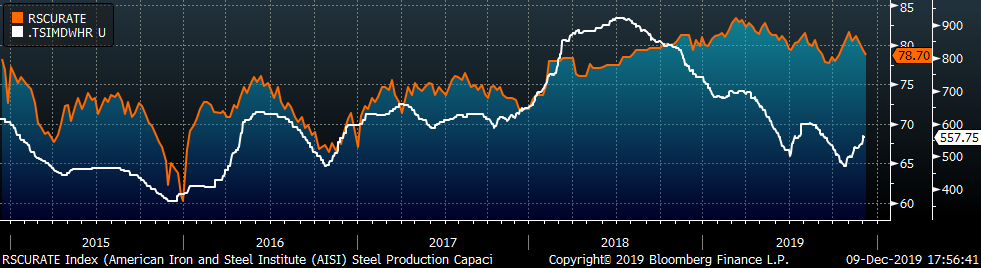
The Platts TSI Daily Midwest HRC Index was up $21 to $557.75.
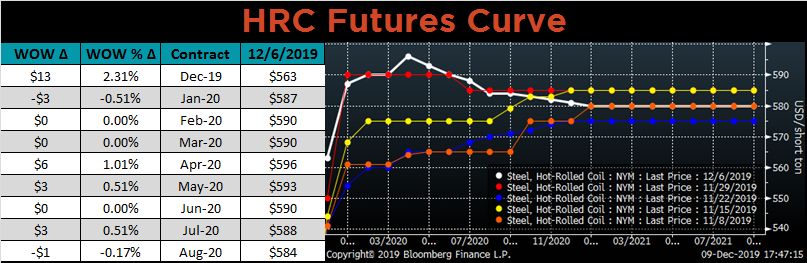
The CME Midwest HRC futures curve is below with last Friday’s settlements in white. The curve moved slightly higher in the front, but shifted lower in the back.
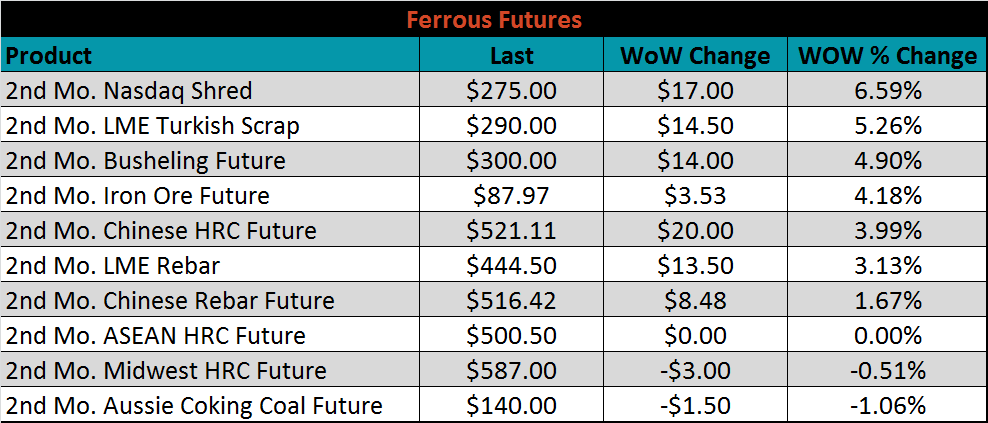
January ferrous futures were mixed. The Nasdaq shred future gained 6.6%, while the Aussie coking coal future lost 1.1%.
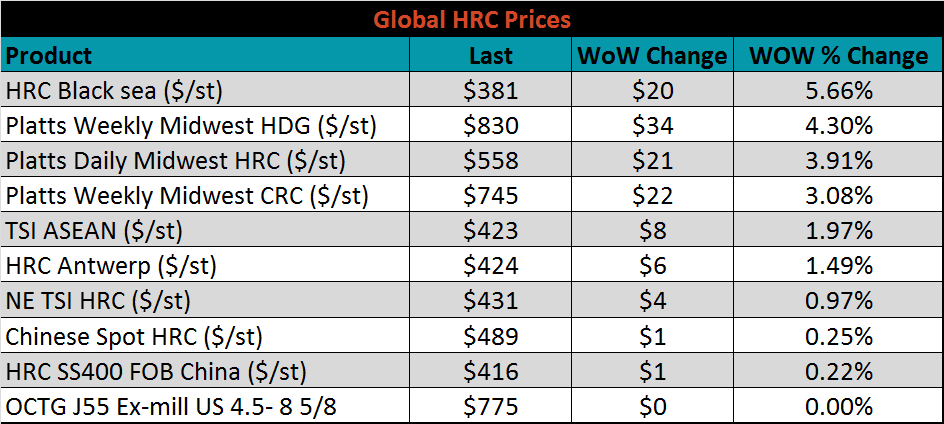
The global flat rolled indexes were all higher, led by Black Sea HRC and TSI Midwest HDG, up 5.7% and 4.3%, respectively.
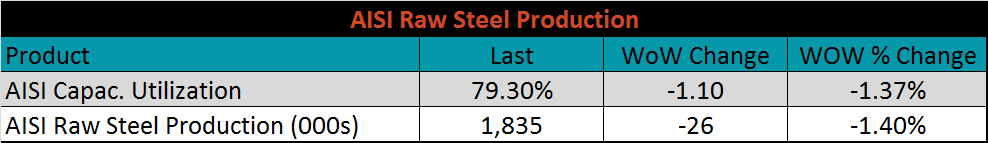
The AISI Capacity Utilization Rate was down 1.1% to 79.3%. On a year-to-date basis, the 80% goal set by the Trump administration continues to hold. However, declining production into year-end may challenge this.
November flat rolled import license data is forecasting a decrease of 167k to 537k MoM.
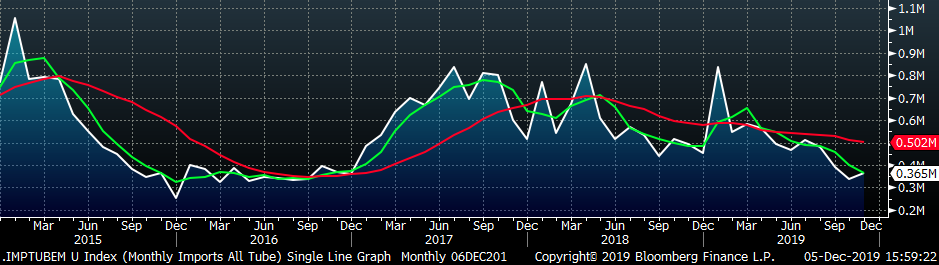
Tube imports license data is forecasting a MoM increase of 29k to 365k tons in November.
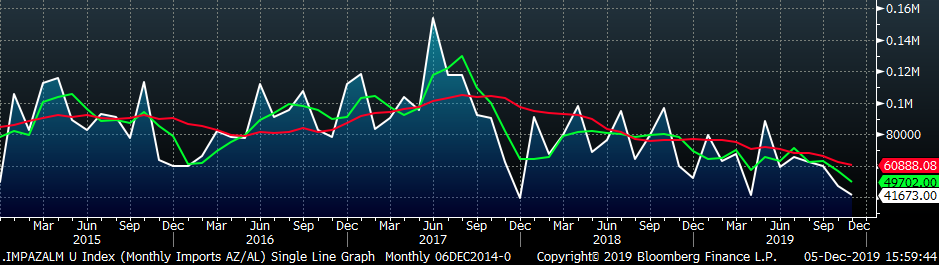
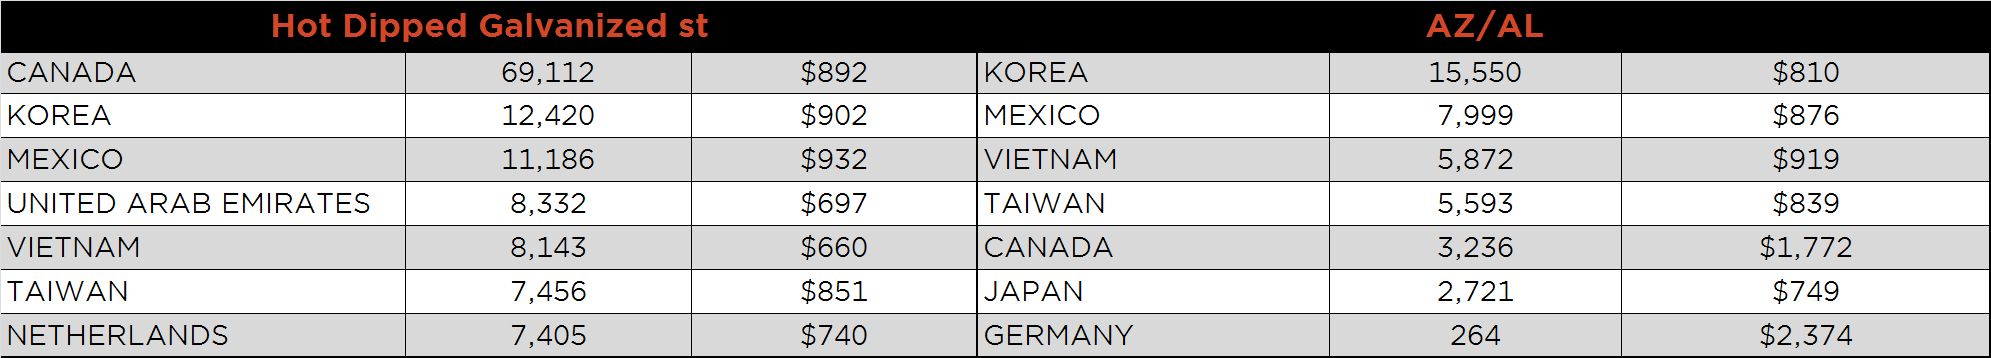
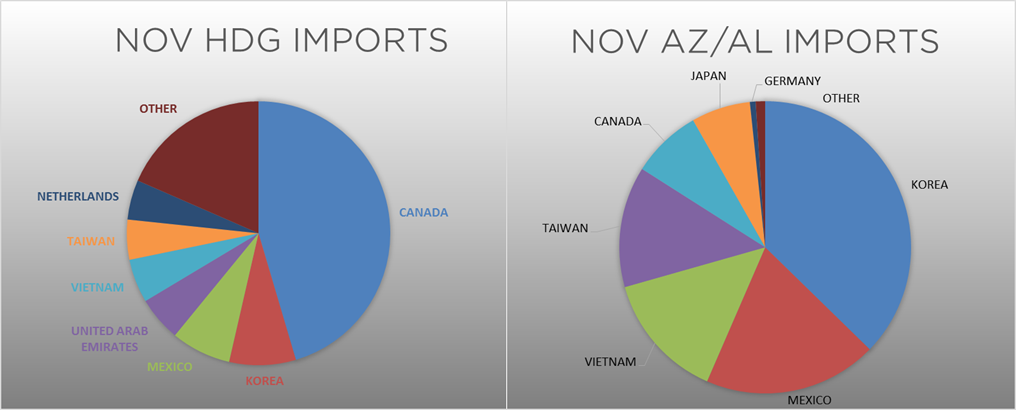
AZ/AL import license data is forecasting a decrease of 6k in November to 42k.
Below is November import license data through December 3, 2019.
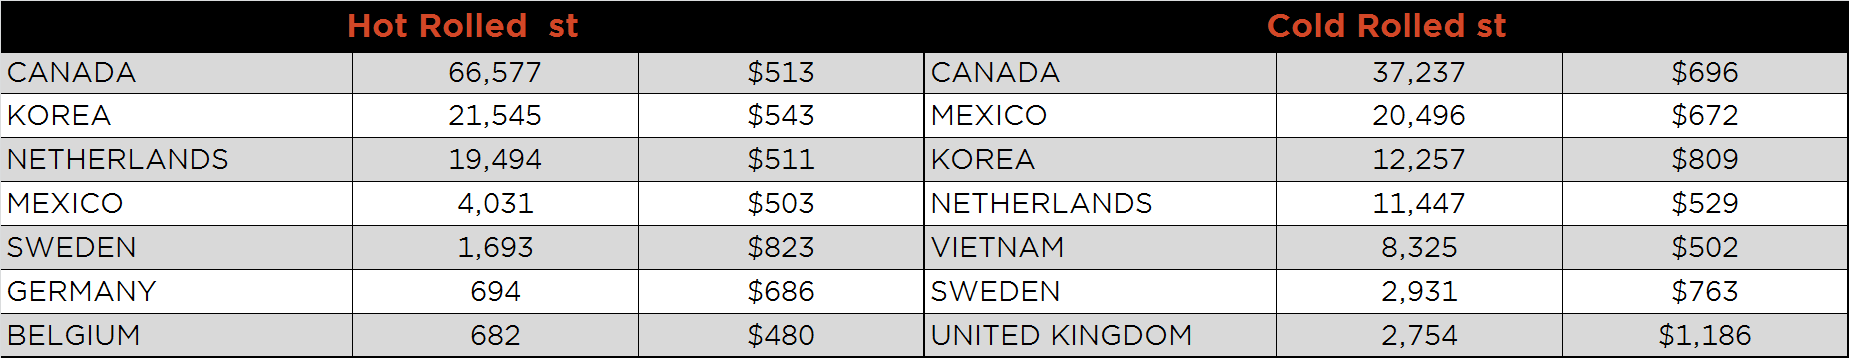
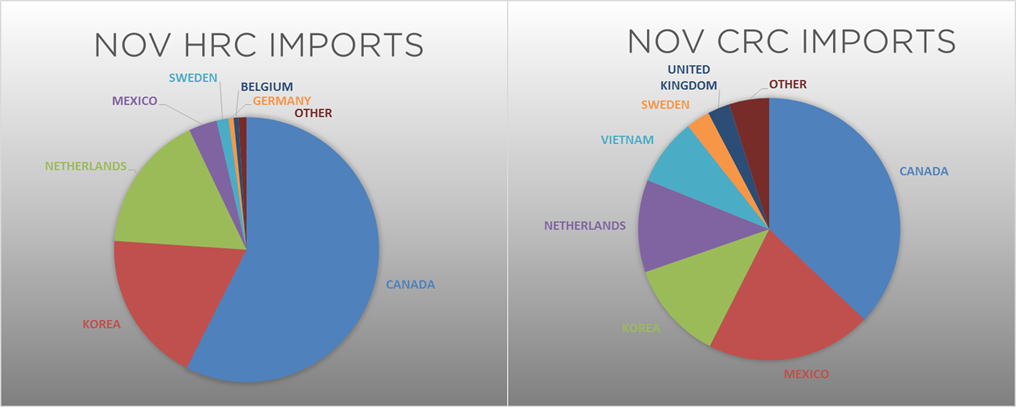
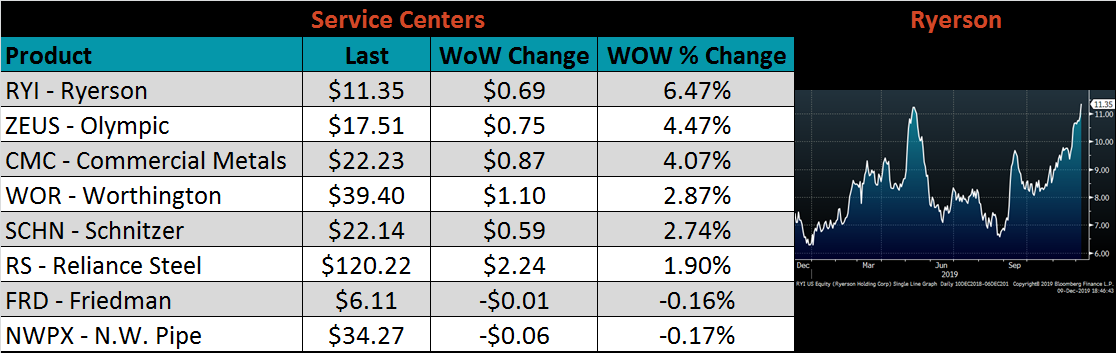
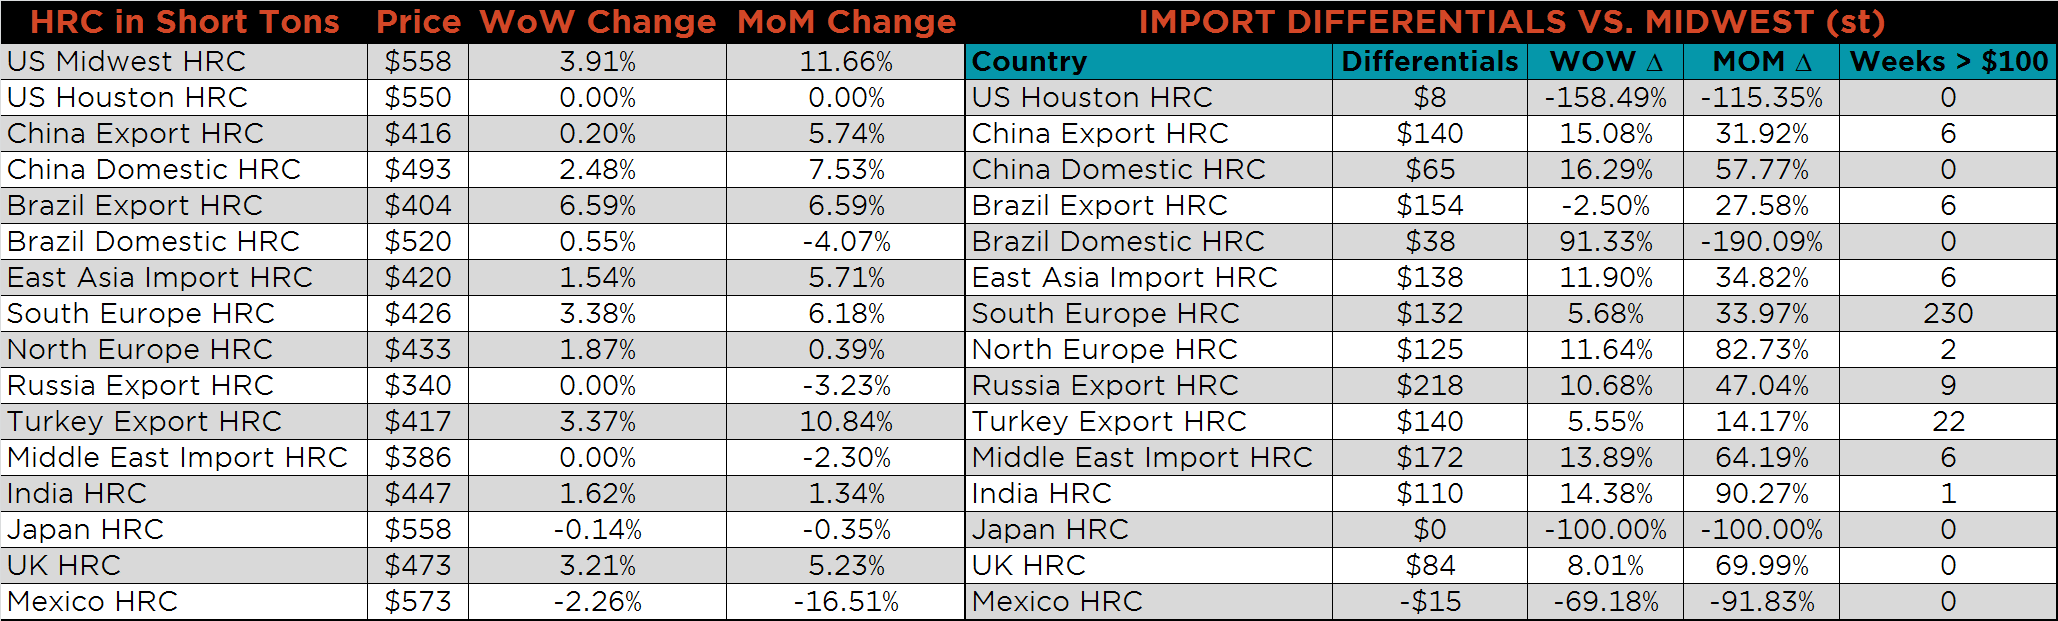
Below is the Midwest HRC price vs. each listed country’s export price using pricing from SBB Platts. We have adjusted each export price to include any tariff or transportation cost to get a comparable delivered price. The Midwest HRC price was up significantly and increased the differential with Russian, China, Turkey and Korean prices, while the Brazilian differential was slightly lower.
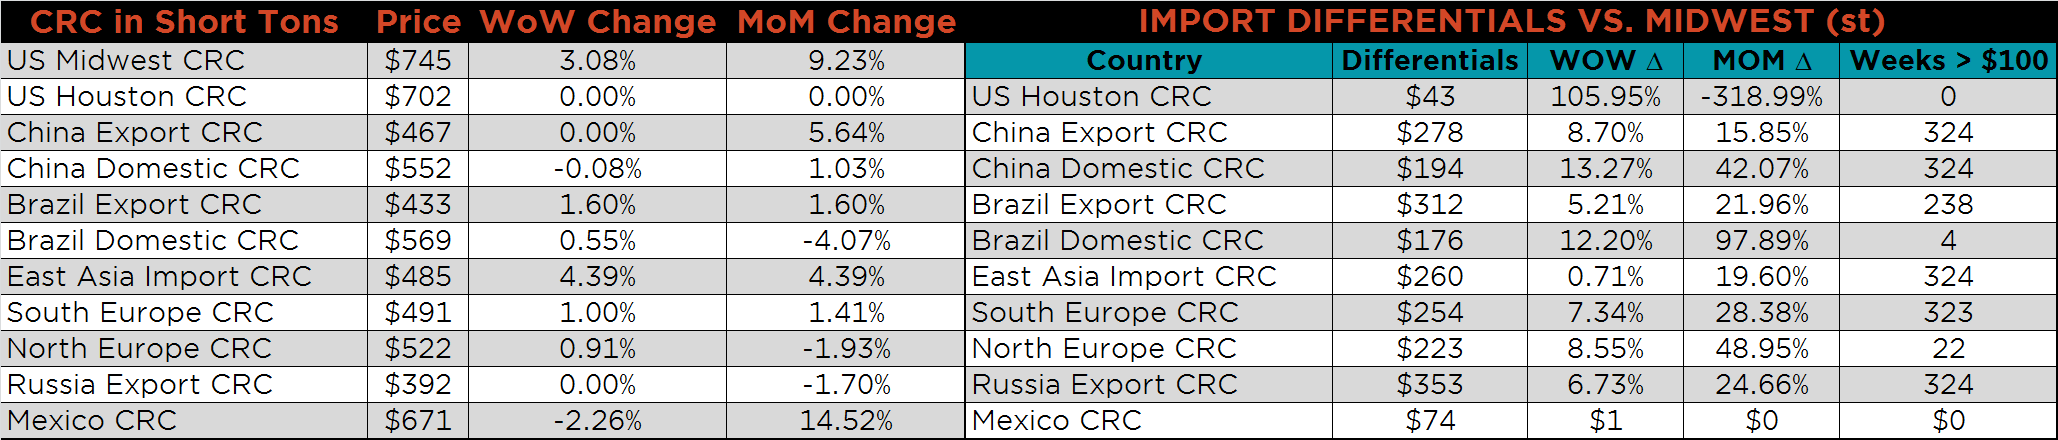
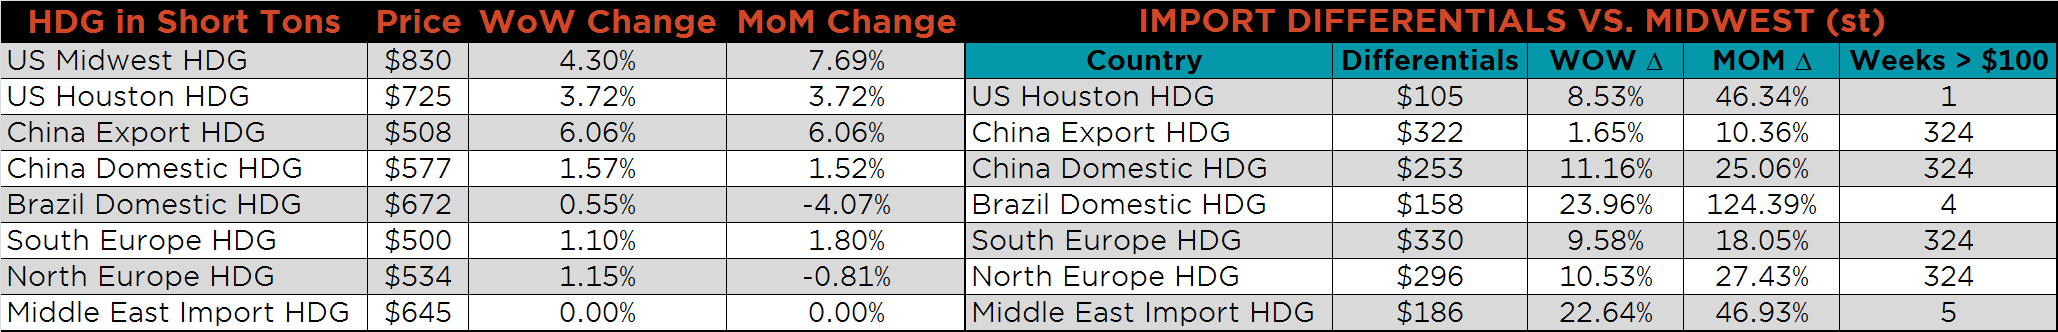
SBB Platt’s HRC, CRC and HDG pricing is below. The Midwest HDG, HRC and CRC prices were all up significantly, 4.3%, 3.9% and 3.1% higher, respectively. Globally, the Brazilian HRC and Chinese HDG export prices were up, 6.6% and 6.1%, respectively.
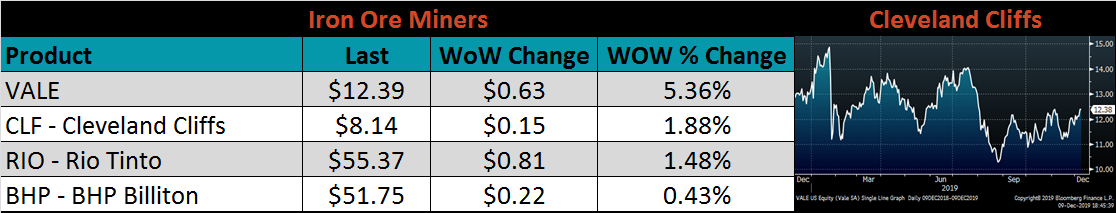
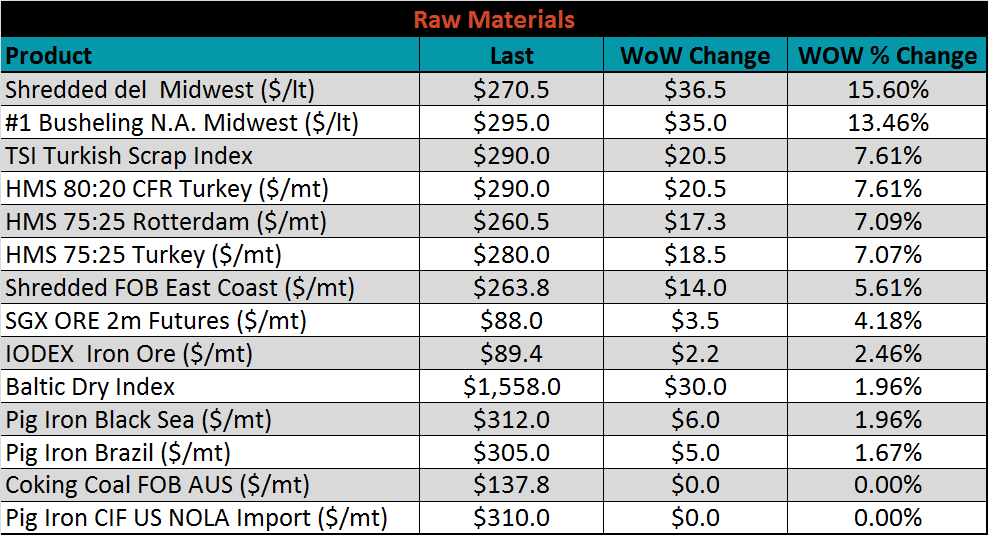
Raw material prices were mostly higher. Midwest shredded was up 15.6% while Midwest busheling #1 was up 13.5%.
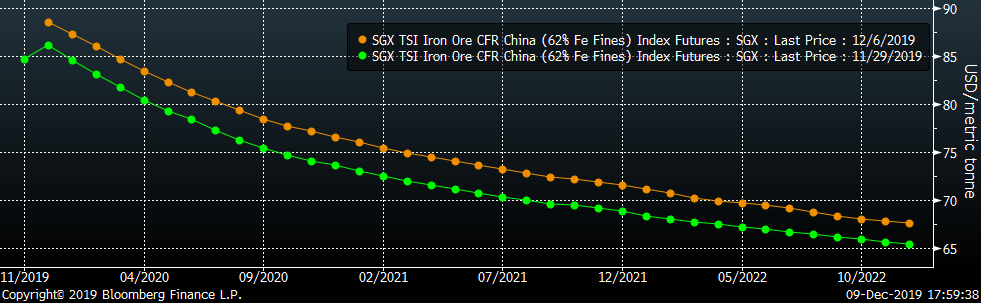
Below is the iron ore future curve with Friday’s settlments in orange, and the prior week’s settlements in green. The curve shifted slightly higher.
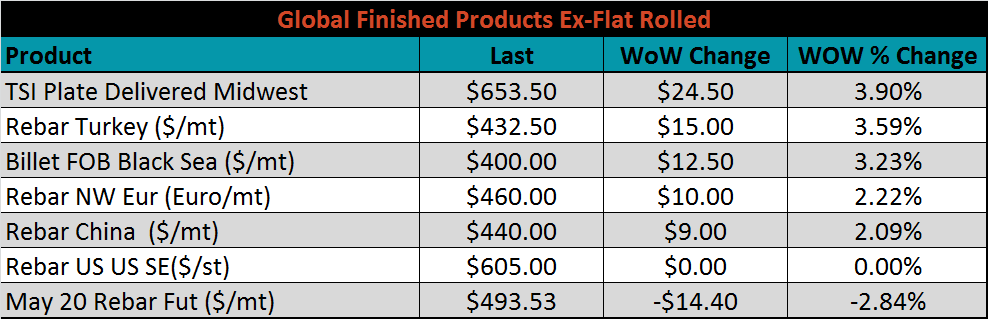
The ex-flat rolled prices are listed below.

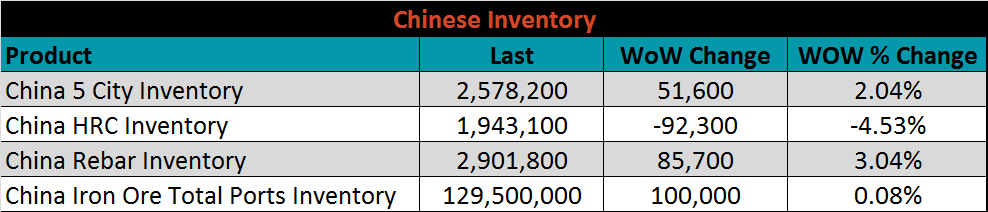
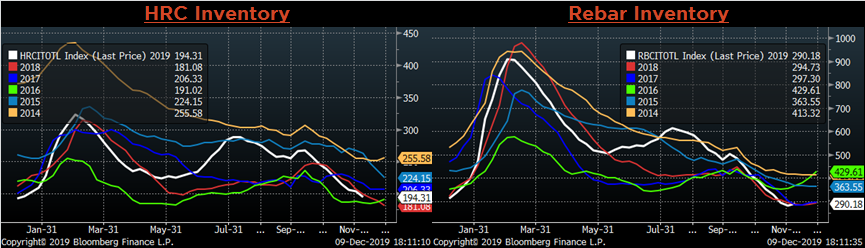
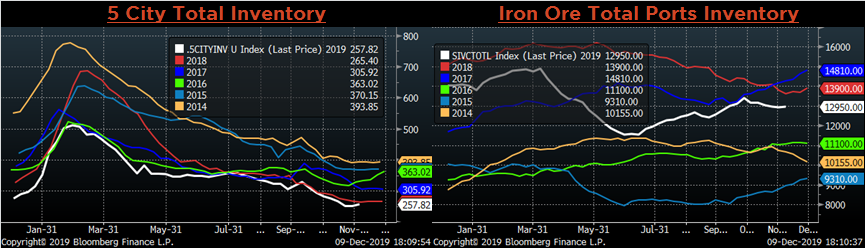
Below are inventory levels for Chinese finished steel products and iron ore. Rebar, iron ore and 5-city inventory increased, while HRC inventory continued to decline. Even with the increases, HRC, Rebar and 5-city inventory levels remain among the lowest in the last five years at this point in the year.
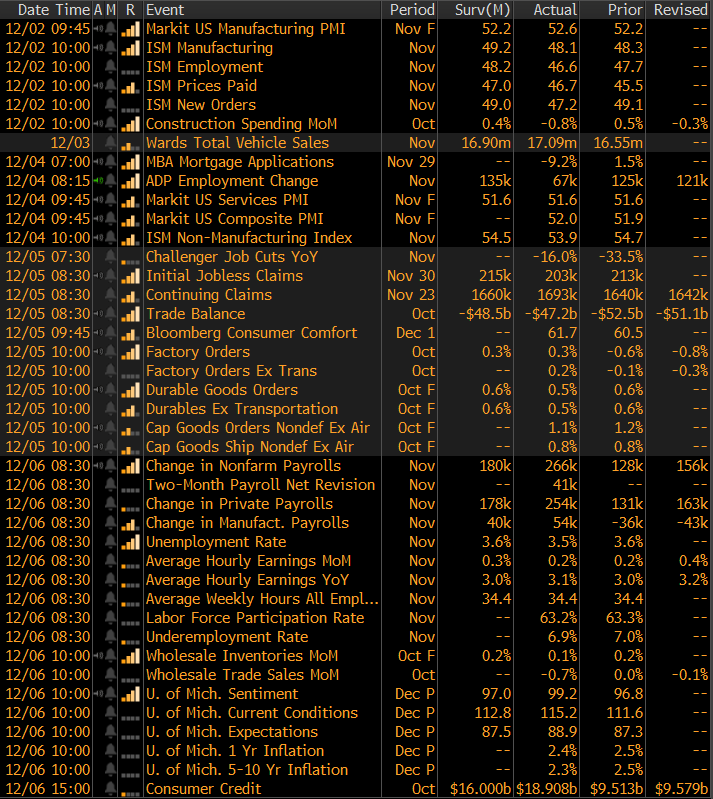
The remaining significant economic data is to the right. The December preliminary numbers for the University of Michigan survey printed above expectations. Sentiment printed at 99.2, above the expected 97.0, current conditions printed 115.2, above the expected 12.8, and future expectations printed 88.9, above 87.5. This shows the divergence between weak manufacturing and construction industries and the resilient US consumer.
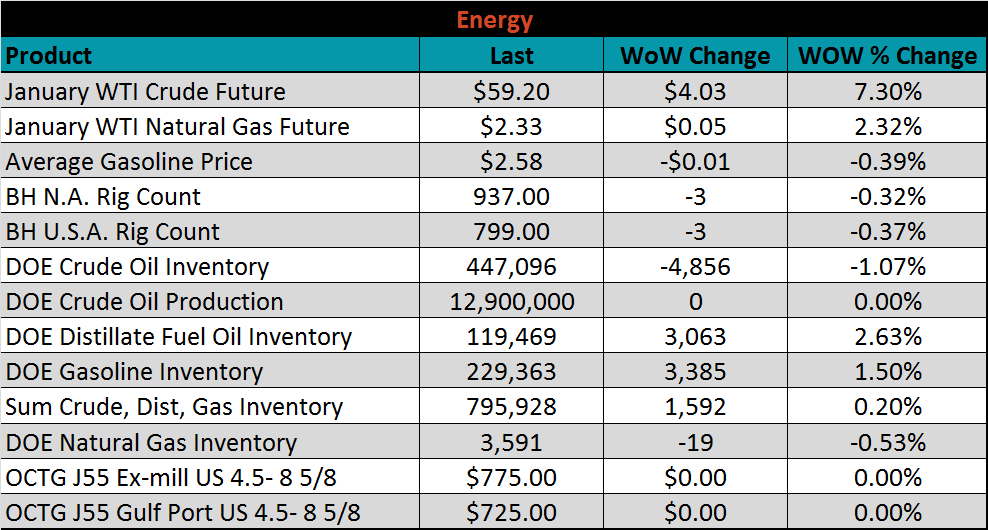
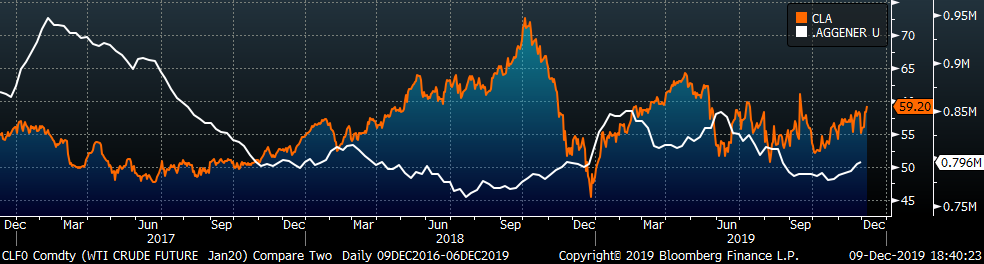
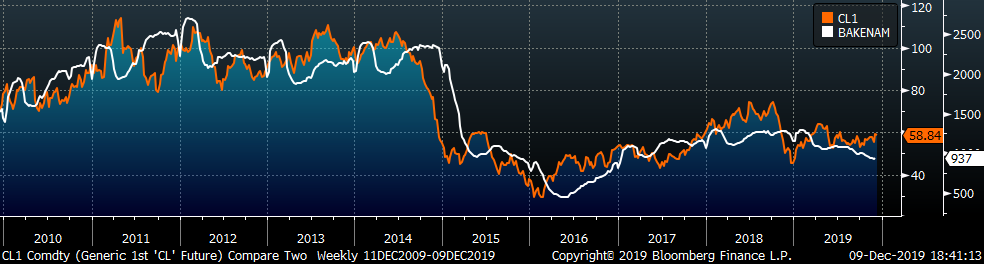
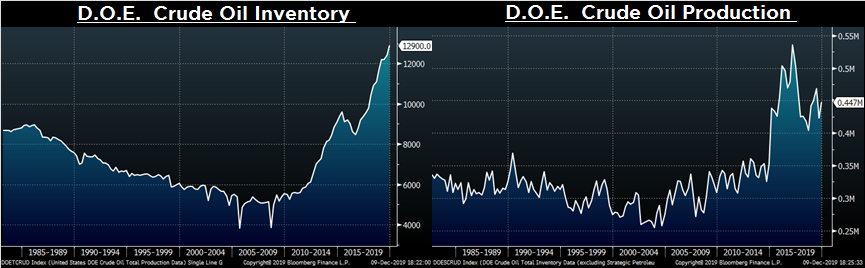
Last week, the January WTI crude oil future gained $4.03 or 7.3% to $59.20/bbl. The aggregate inventory level was up 0.2% and crude oil production held at 12.9m bbl/day. The Baker Hughes North American rig count and U.S. rig count were each down three rigs.
The list below details some upside and downside risks relevant to the steel industry. The orange ones are occurring or look to be highly likely. The upside risks look to be in control.
Upside Risks:
Downside Risks: