Content
-
Weekly Highlights
- Market Commentary
- Upside & Downside Risks


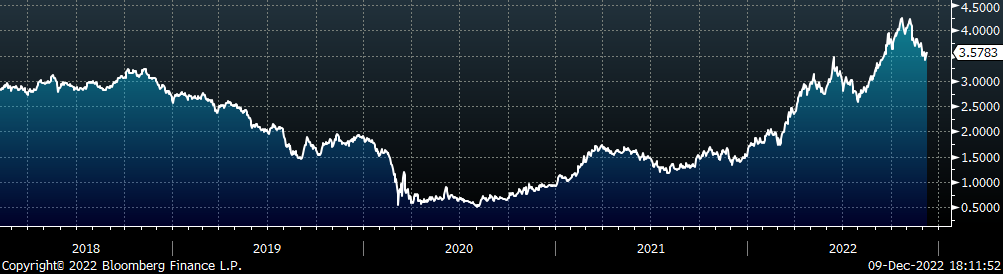
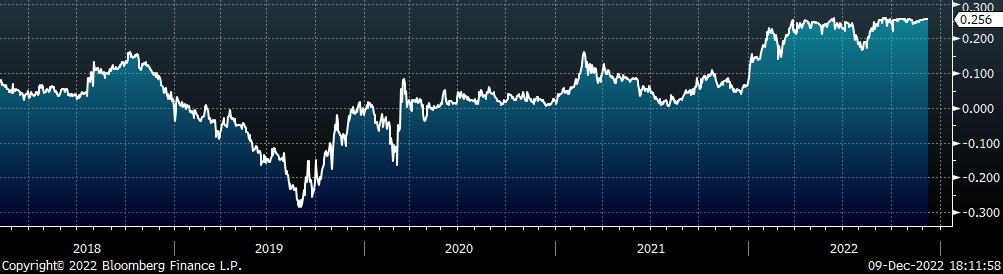
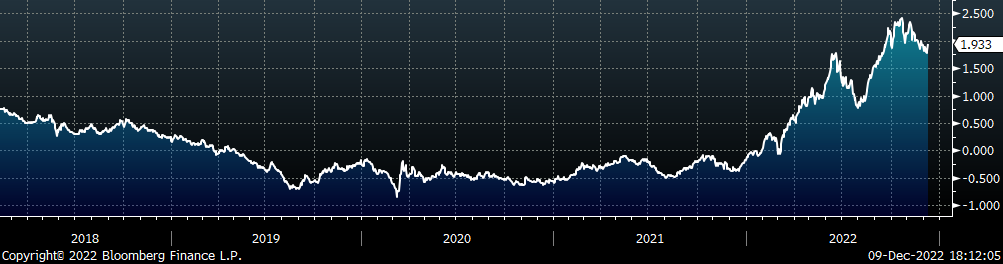
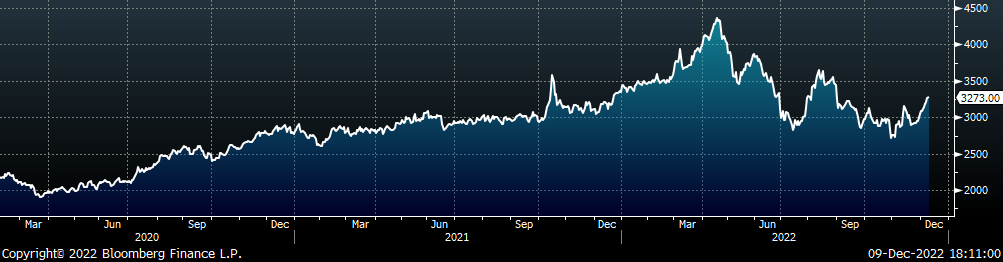
Prior to the recent price increase announcements from the mills, some of our closely watched fundamental signals started to suggest that the floor was already in. Lead times stabilized and started to push out and global prices, led by China, were trending higher since mid-November. One of the final holdouts was flatlined input costs. The chart below shows a basket of raw material inputs for both EAF and BOF mills going back to the beginning of 2019.
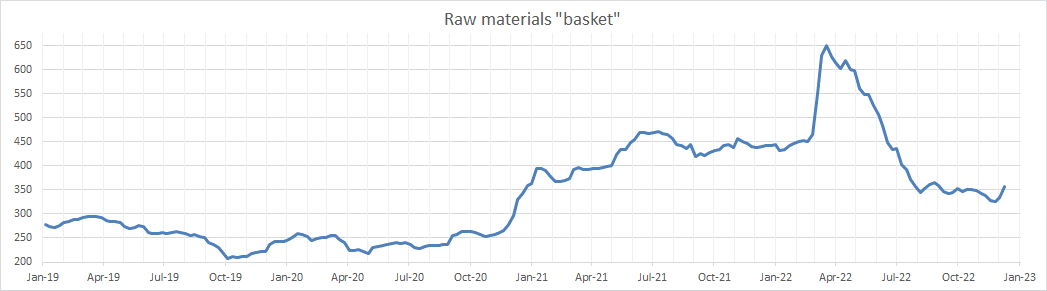
Taking a step back, the primary takeaway here is that raw materials found a fundamental floor well above their pre-pandemic levels in a shaky demand environment. More than anything else, we view this as a significant bullish signal over the longer-term for steel prices. Turning to the immediate outlook, the recent increase in raw materials is significant. While three weeks is not long enough to classify this move as a full-on rally, the current trough to peak increase of 9.1% is the largest short-term move since May 2021 (excluding the Russian invasion caused rally). Furthermore, there is additional upside risk to prices from a traditional seasonal perspective. Historical data shows that scrap prices have settled higher in January than in December, 8 of the last 10 years.
Upside Risks:
Downside Risks:
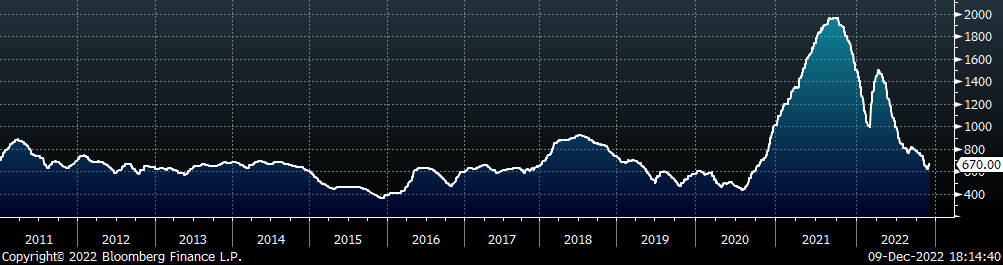
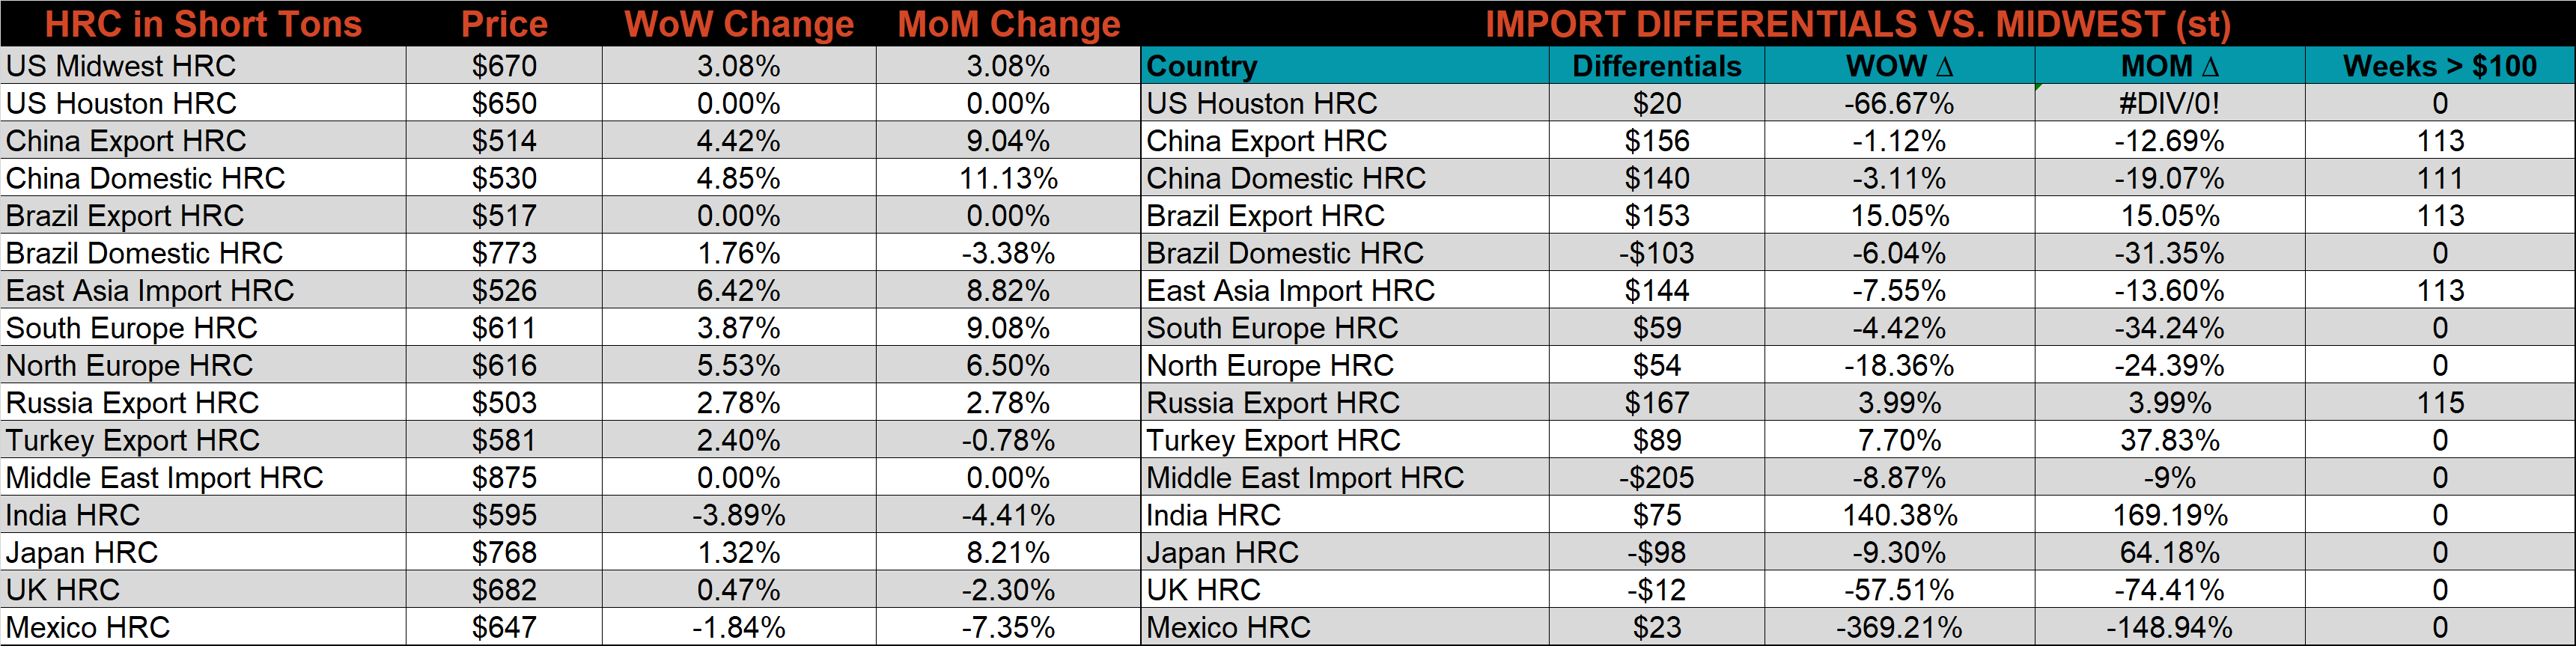
The Platts TSI Daily Midwest HRC Index was up another $20 this week, ending at $670.
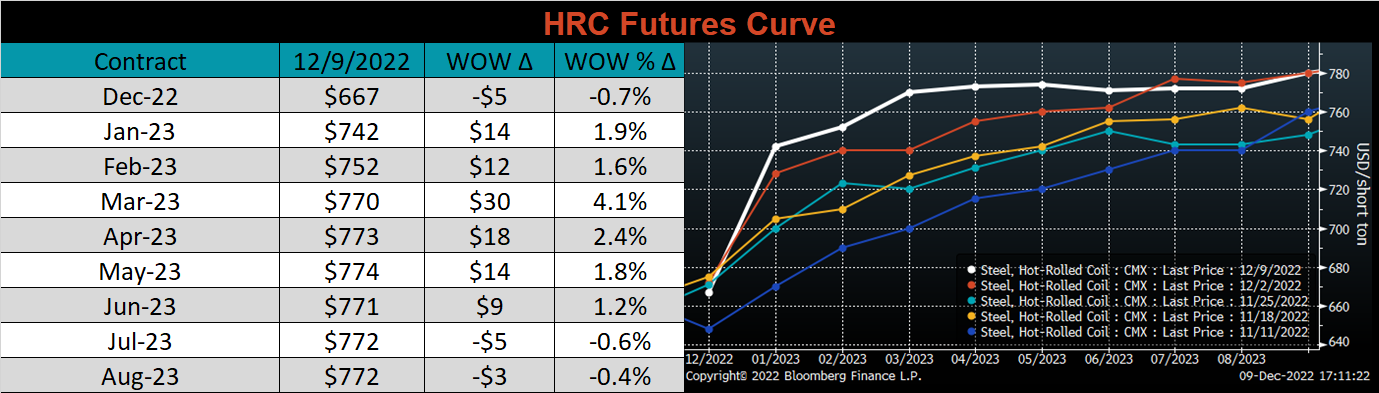
The CME Midwest HRC futures curve is below, with last Friday’s settlements in white. The front of the curve was higher this week, while 2Q23 and beyond are flat around $770.
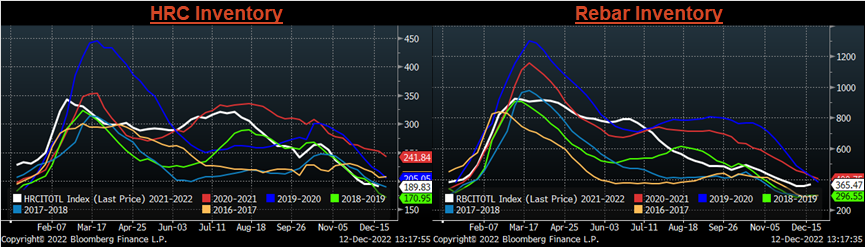
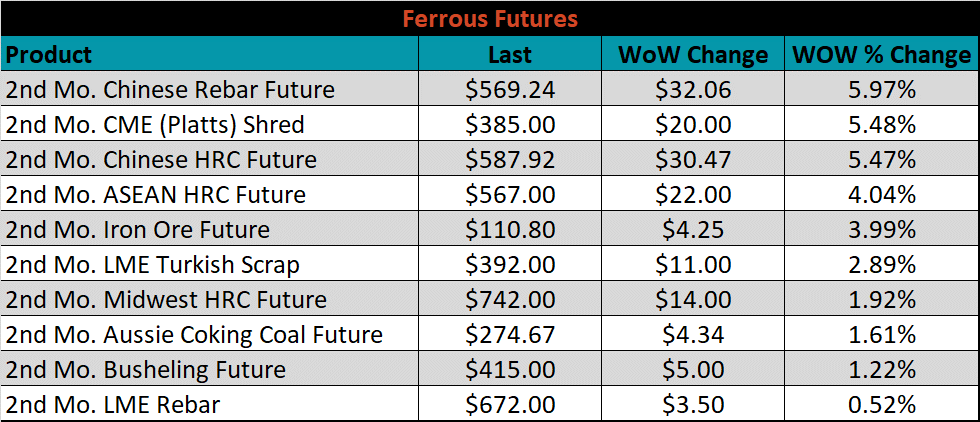
The 2nd month ferrous futures ended the week higher, led by Chinese rebar, up 6%.
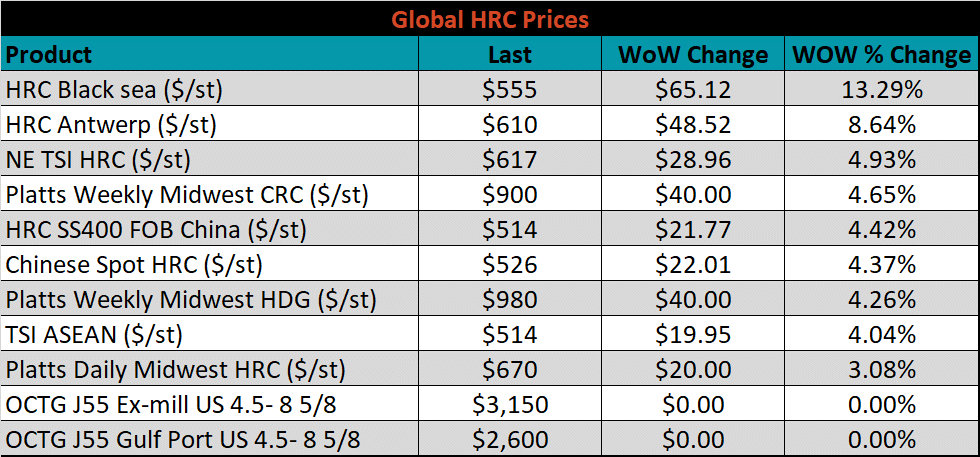
Global flat rolled indexes were all higher this week, led by Black Sea HRC up 13.3%.
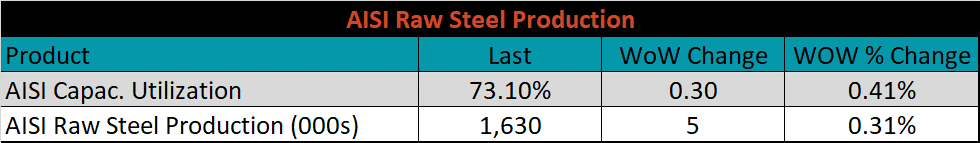
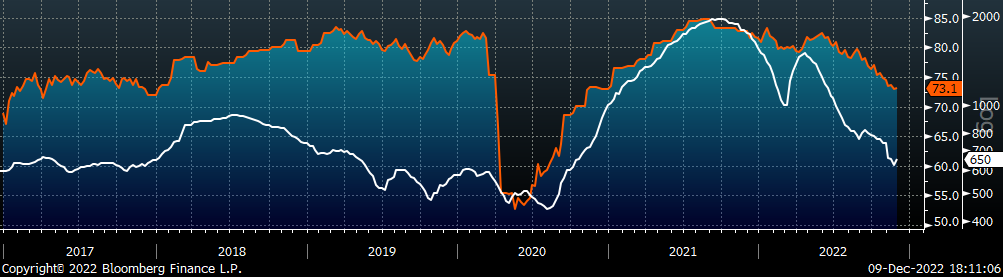
The AISI Capacity Utilization was up 0.3% to 73.1%.
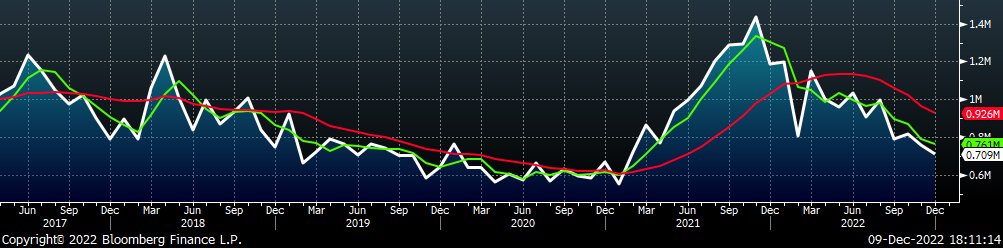
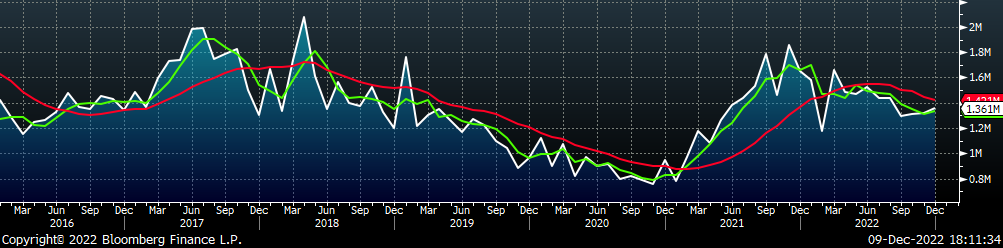
December flat rolled import license data is forecasting a decrease of 50k to 709k MoM.
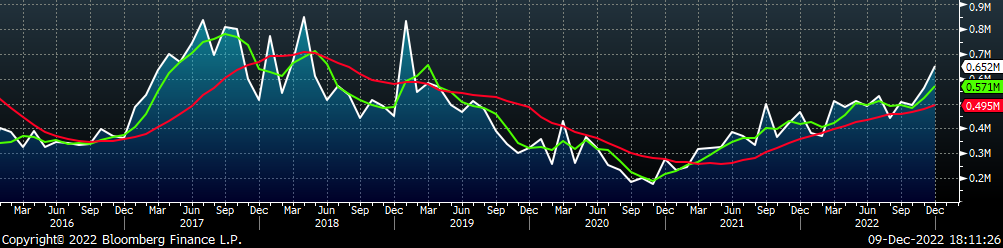
Tube imports license data is forecasting an increase of 88k to 652k in December.
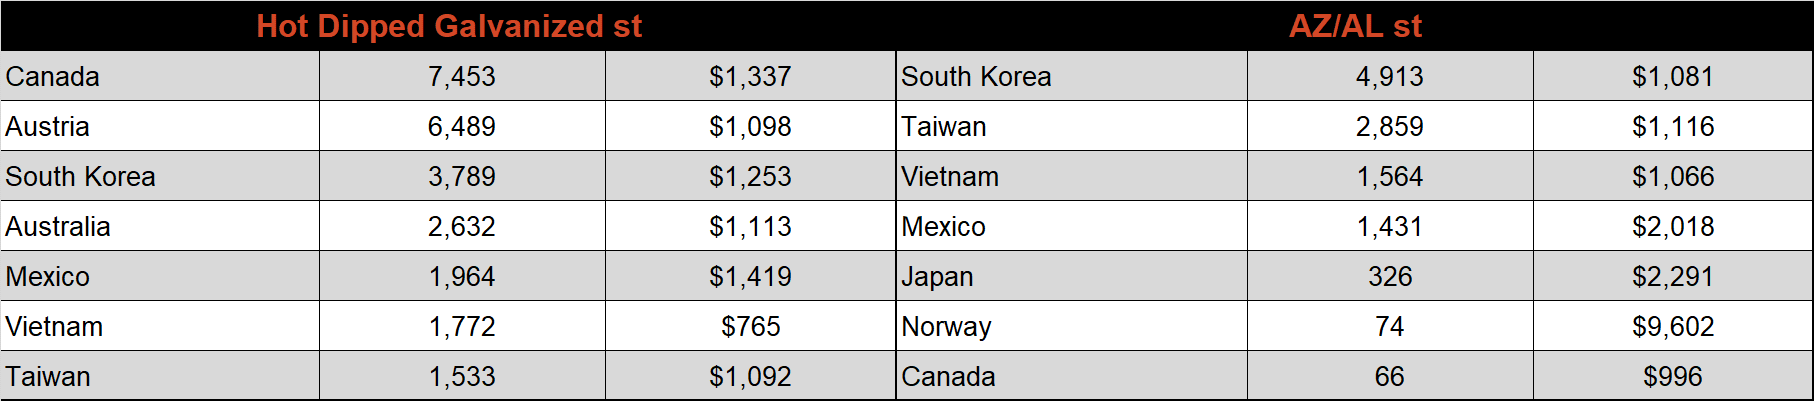
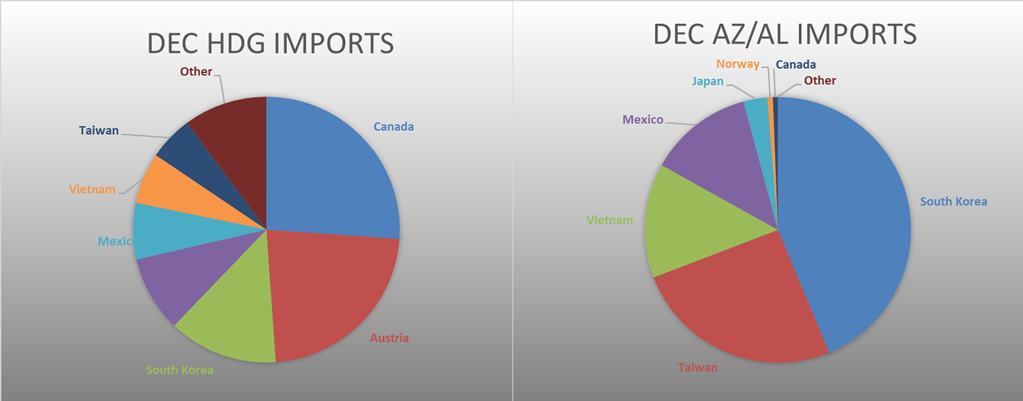
December AZ/AL import license data is forecasting a decrease of 13k to 42k.
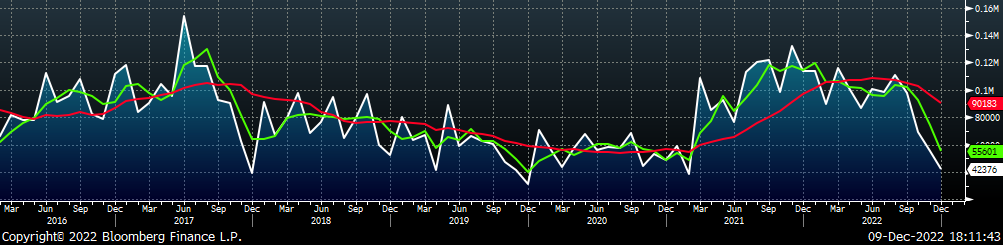
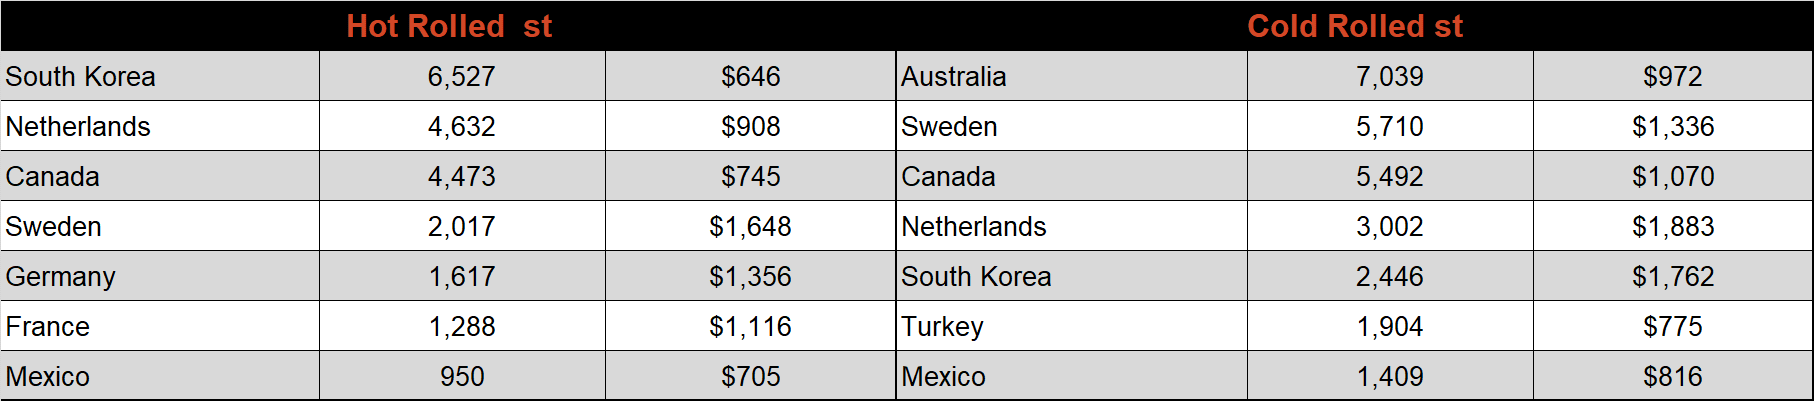
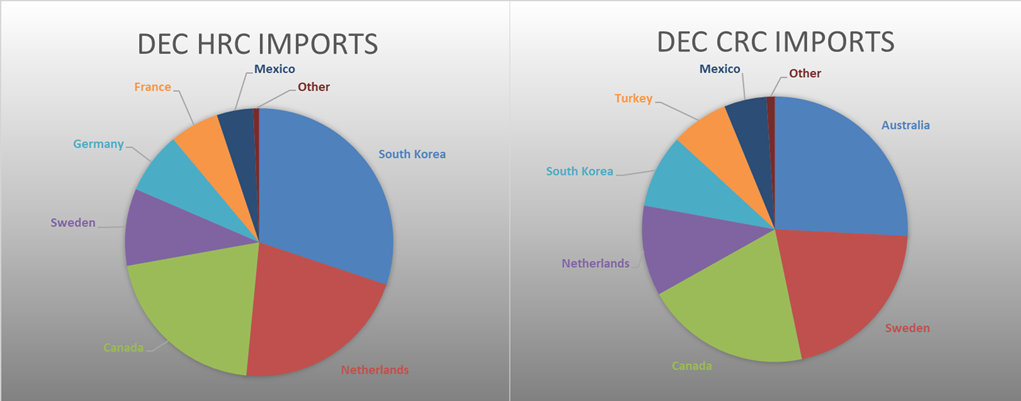
Below is November import license data through December 5th, 2022.
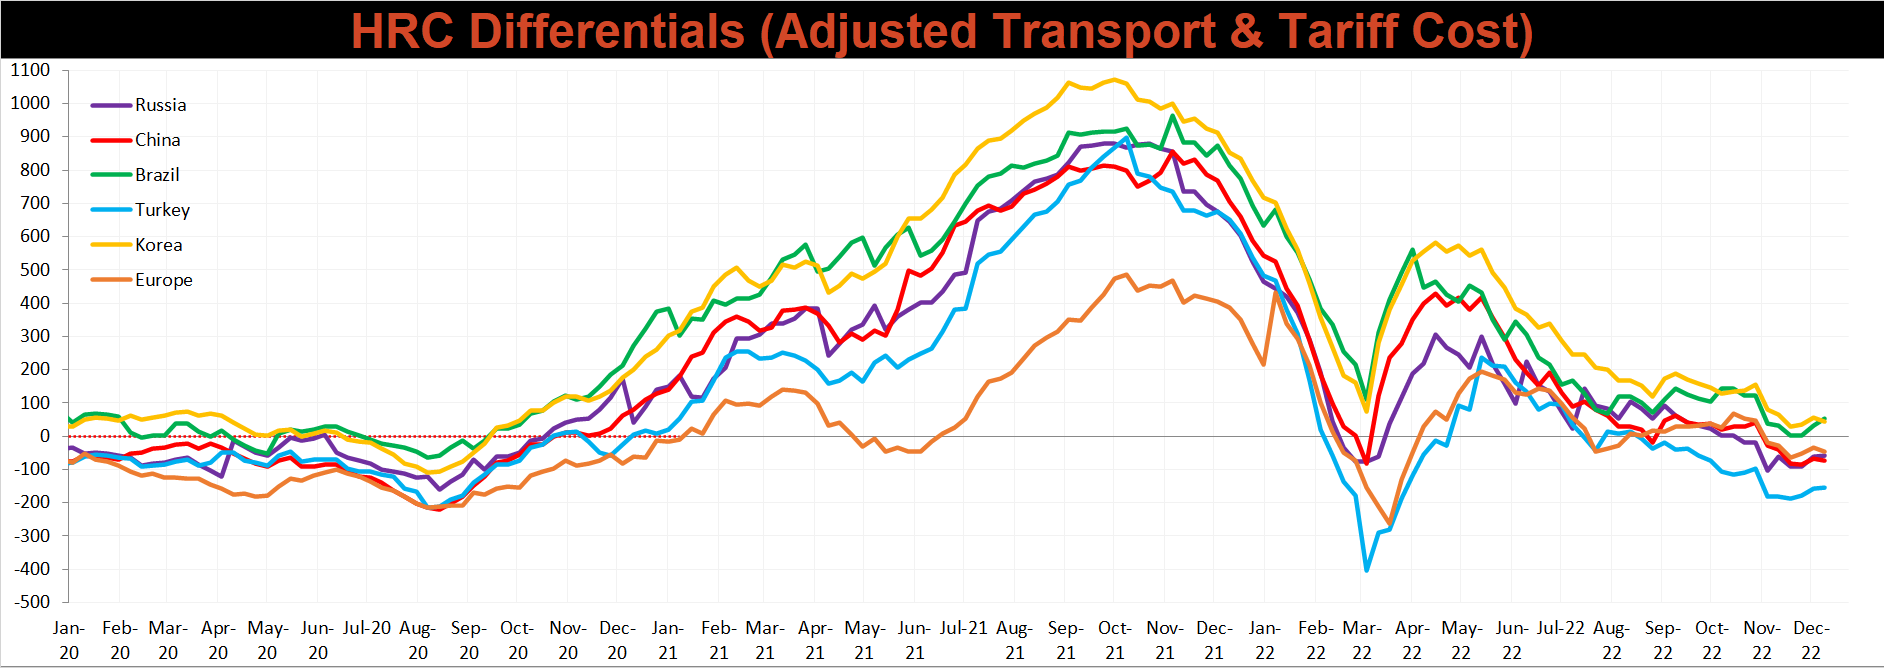
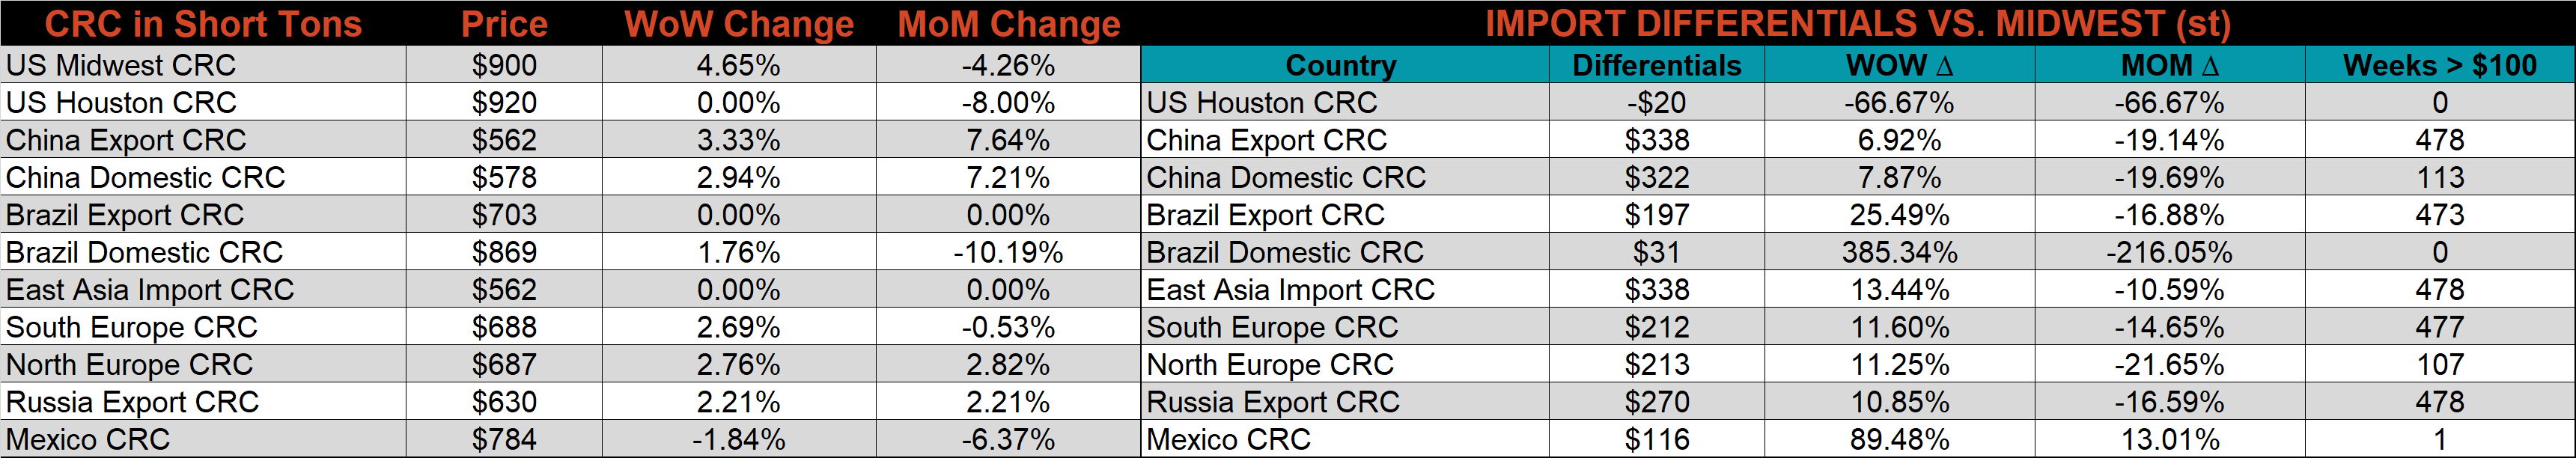
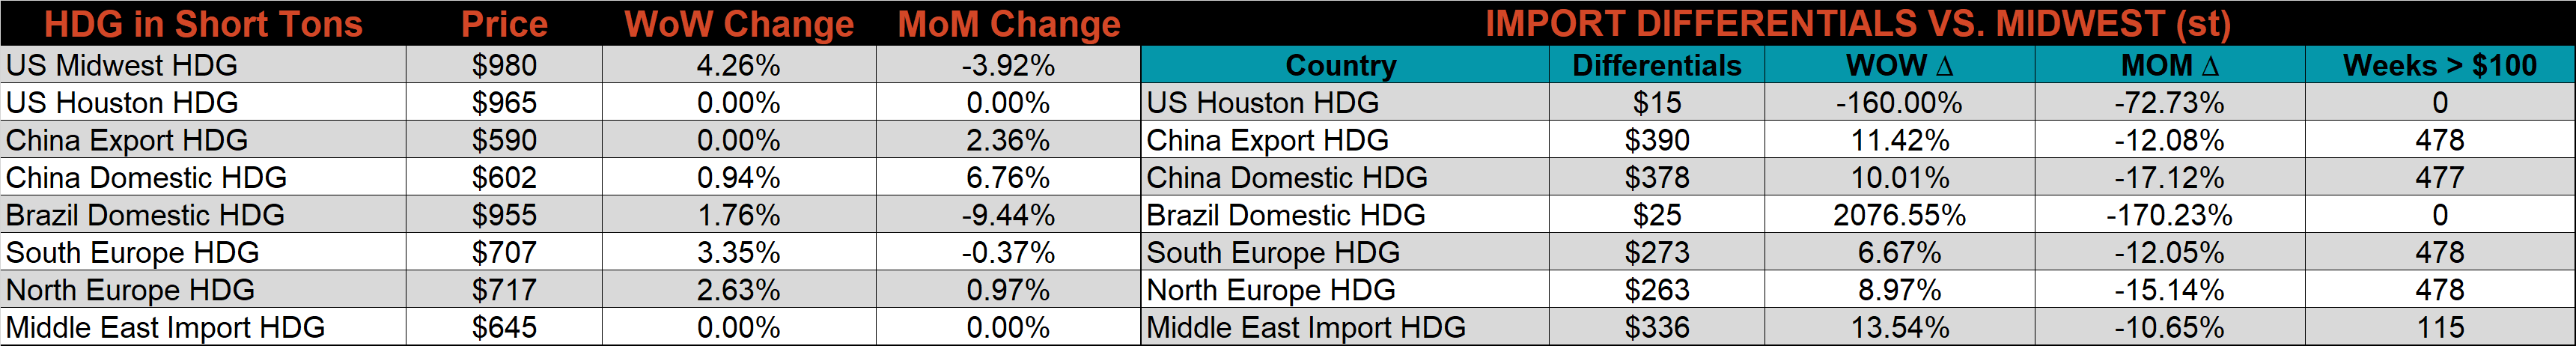
Below is the Midwest HRC price vs. each listed country’s export price using pricing from SBB Platts. We have adjusted each export price to include any tariff or transportation cost to get a comparable delivered price. The differentials for Turkey and Brazil increased this week, while the remaining countries saw their prices rise more significantly than U.S domestic prices.
Global prices were mostly higher again this week, led by East Asian HRC, up 6.4%.
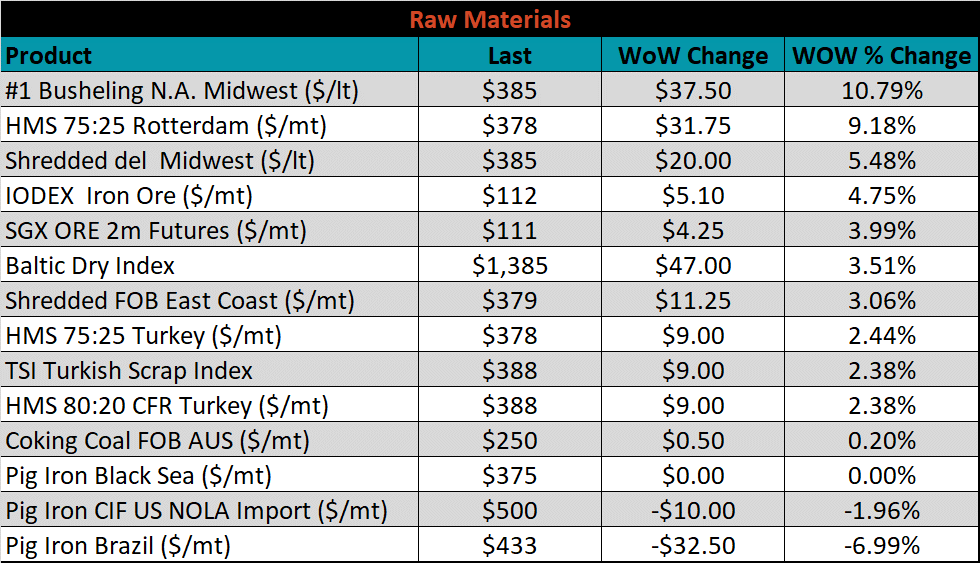
Raw material prices were mostly higher this week, led by Midwest busheling, up 10.8%, while Brazilian pig iron was down another 7%.
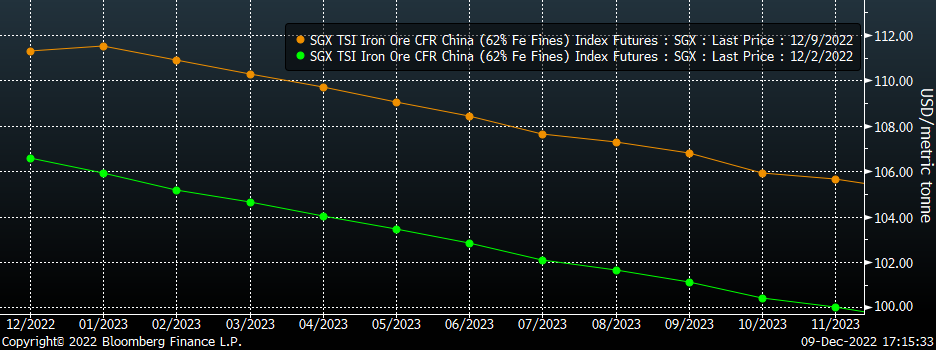
Below is the iron ore future curve with Friday’s settlements in orange, and the prior week’s settlements in green. Iron ore continues to rip higher with prices shifting $5-6 higher at all expirations last week.
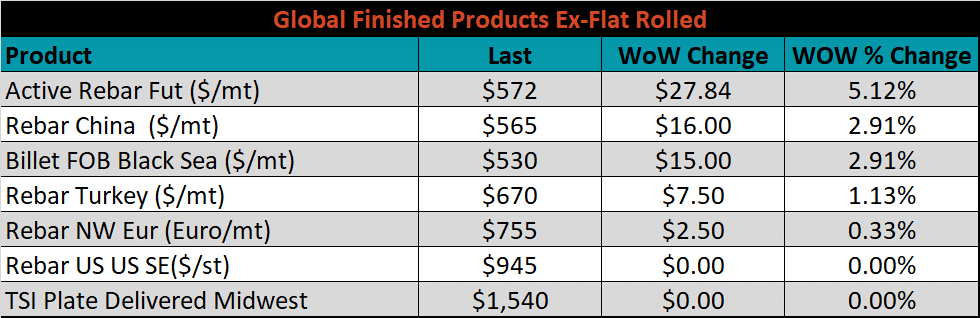
The ex-flat rolled prices are listed below.

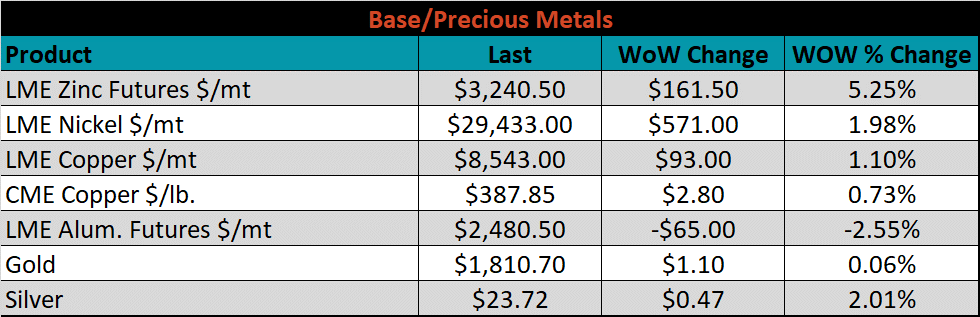
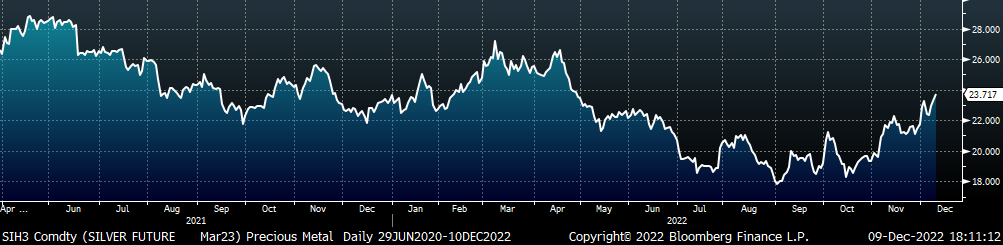
Base and precious metal futures were mostly higher this week, led by LME zinc, and silver, both up 5.3% and 2%, respectively. Silver has rallied 11 of the past 14 weeks to the highest level since April and up nearly 35% from the most recent low in August. LME Aluminum was the only base metal to lose this week down 2.6%, as the WTO ruled against Section 232 Tariffs claiming that the U.S. violated global trade rules with the law.
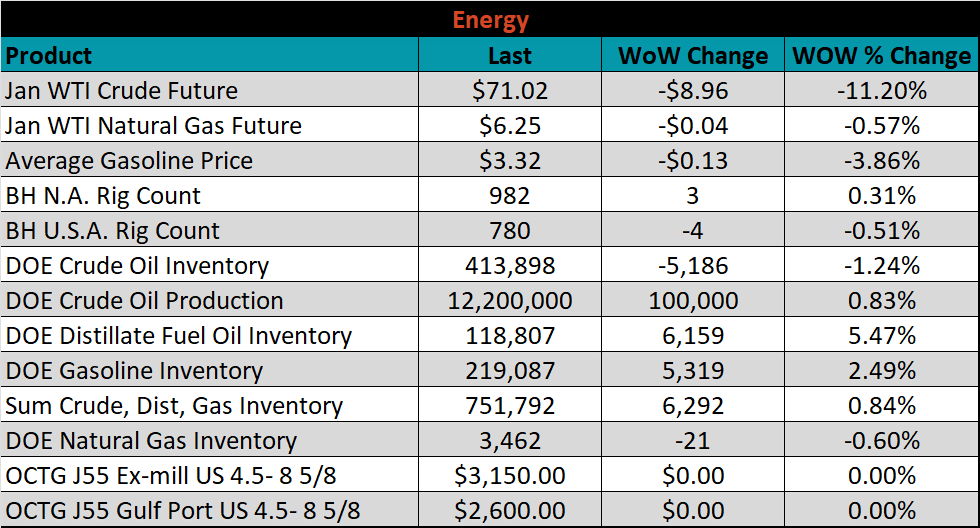
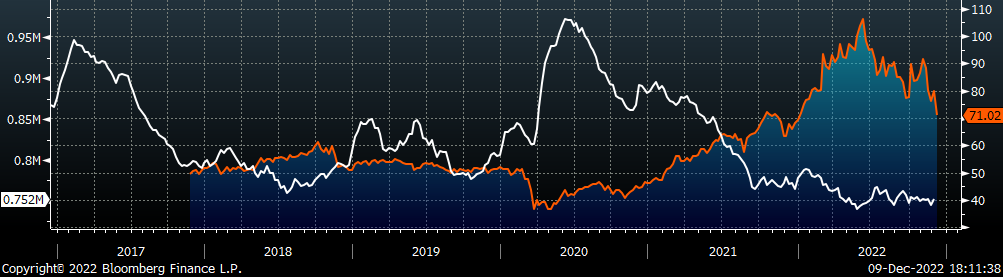
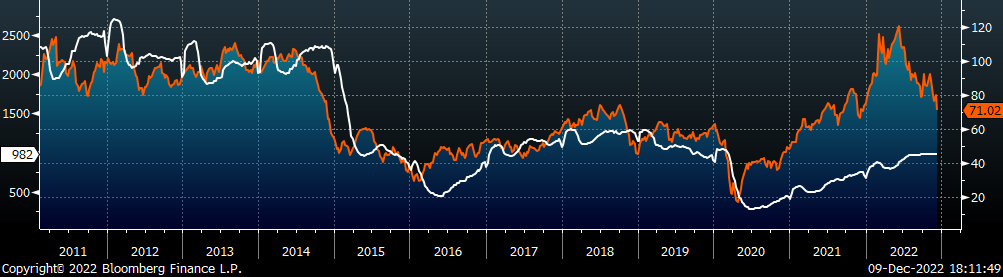
Last week, the January WTI crude oil future lost $8.96 or 11.2% to $71.02/bbl. The aggregate inventory level rose 0.8%. The Baker Hughes North American rig count increased by 3 rigs, while the U.S. rig count decreased by 4 rigs.
The list below details some upside and downside risks relevant to the steel industry. The bolded ones are occurring or highly likely.
Upside Risks:
Downside Risks: