Content
-
Weekly Highlights
- Market Commentary
- ISM PMI
- Global PMI
- Auto Sales
- Construction Spending
- Employment
- Risks


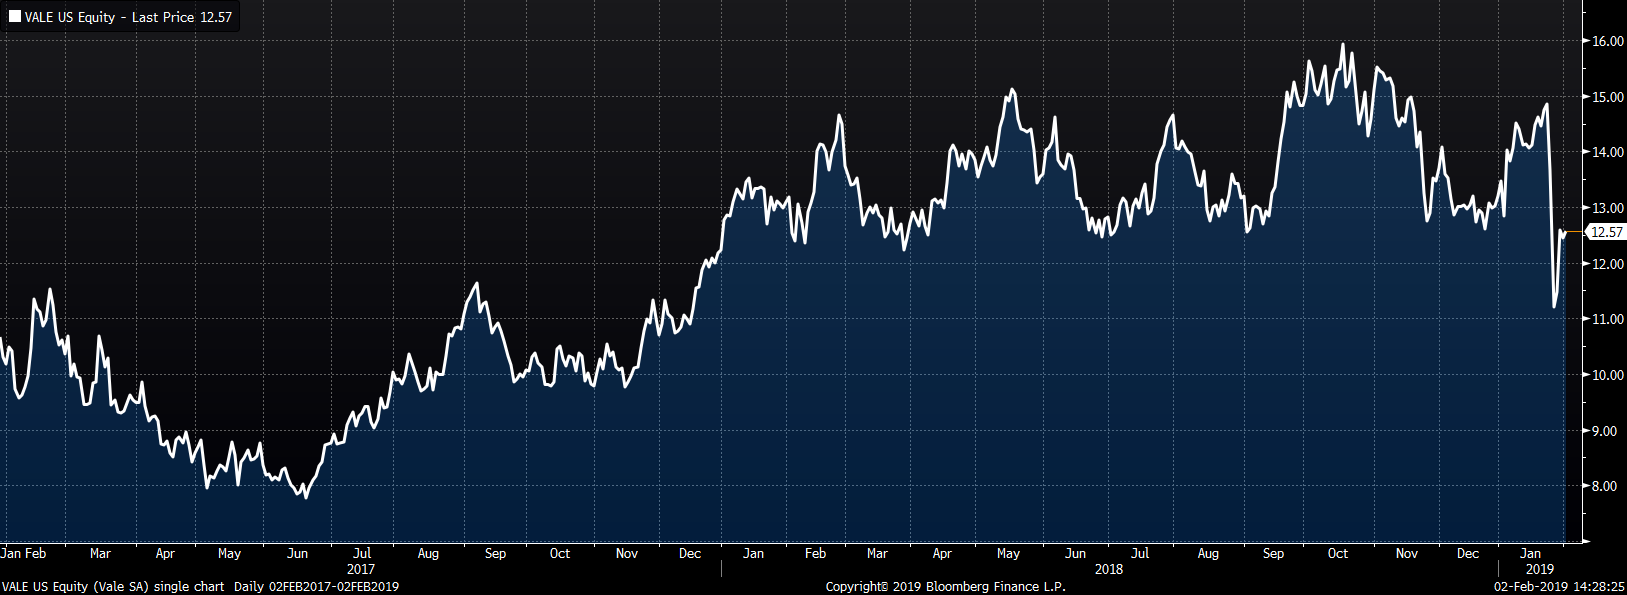
After a quiet start to the year, last week was packed with significant developments increasing both upside and downside risk for domestic flat rolled prices. Vale’s Brazilian dam collapse from the prior week was the catalyst behind a $10/t WoW rally in iron ore futures that also carried scrap prices higher.
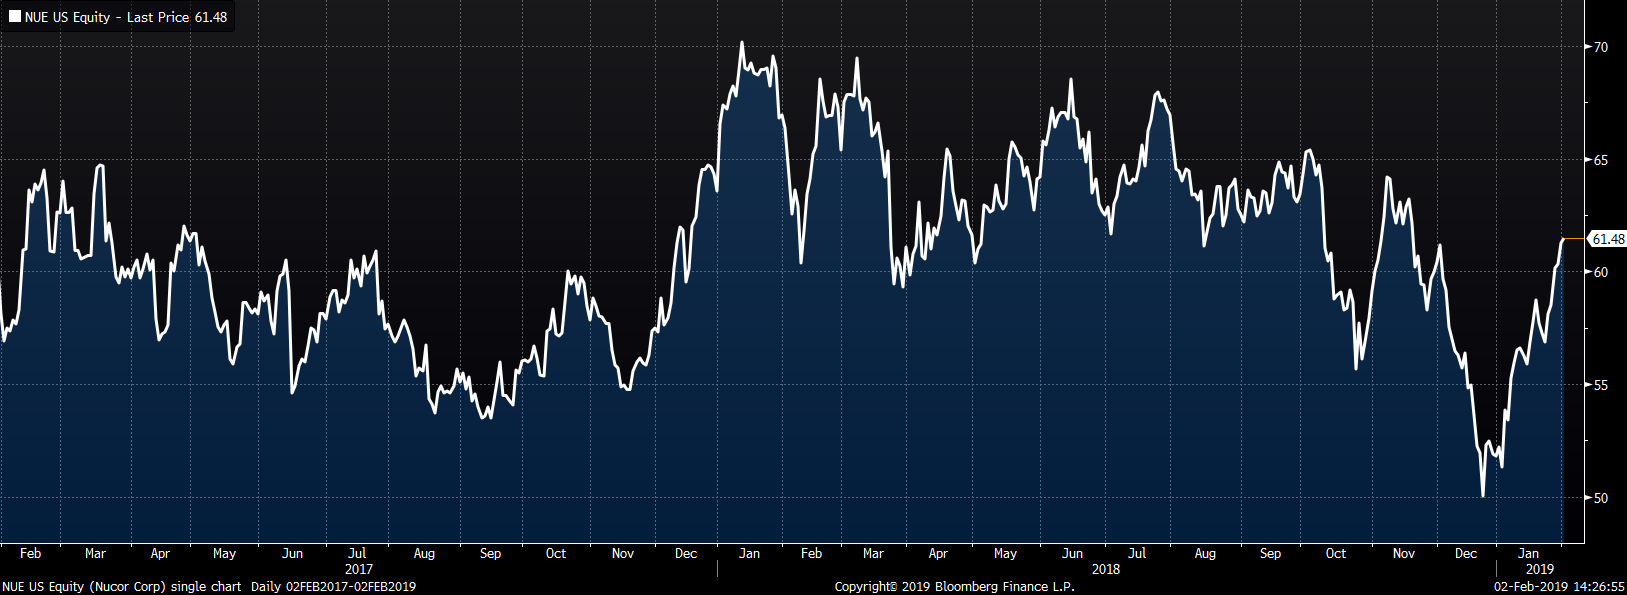
Early in the week, Nucor disseminated an official $40/t price increase letter for flat rolled products, subsequently followed by U.S. Steel, ArcelorMittal and NLMK. By week’s end, most, but not all, domestic mills that didn’t send out an official letter were asking for higher prices. The CME Midwest HRC futures curve gained sharply with some months immediately pricing in 100% of the $40/t increase.
Whether prices are in fact headed higher or if the futures move was a short squeeze is yet to be determined. At FGM, we saw a significant pick up in quoting and purchase orders. It will be interesting to see if there is follow through at the same rate this week or if last week’s pick up was a short-term response to higher iron ore and the price increase announcements.
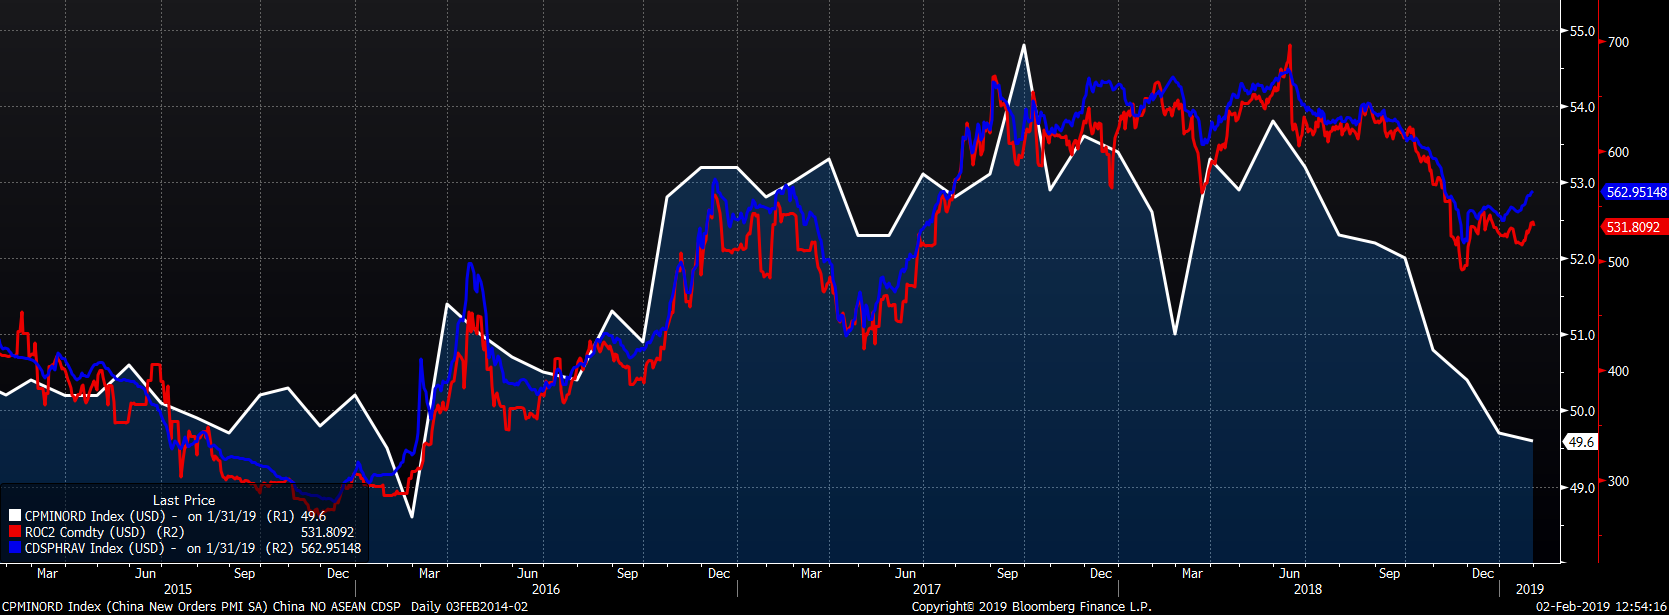
Iron ore was in rally mode long before Vale’s dam collapse. Chinese finished steel prices have been rallying along with iron ore. As the trade war has put downward pressure on China’s economy, China has been taking a proactive approach on a number of fronts including sales of their U.S. Treasury bonds, a weaker yuan and government/P.B.O.C. operations to increase liquidity in the banking system. It is clear a certain amount of this easing is moving into their “old economy” boosting ferrous commodity prices. Chinese economic stimulus measures is already in the Upside Risks list, but is now being moved to the top as the ramifications must be taken very seriously in case it gets out of hand as it did in 2004, 2008 and 2010.
There was a lot of data out of the mills last week as AK Steel, Nucor and U.S. Steel announced earnings and held earnings conference calls. Then on Friday, Steel Dynamics announced it purchased 75% of galvalume distributor United Steel Supply.
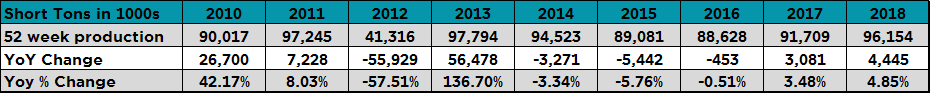
Two weeks ago, 2018 AISI production was examined showing production increased over 4.4m tons or 4.9% YoY.
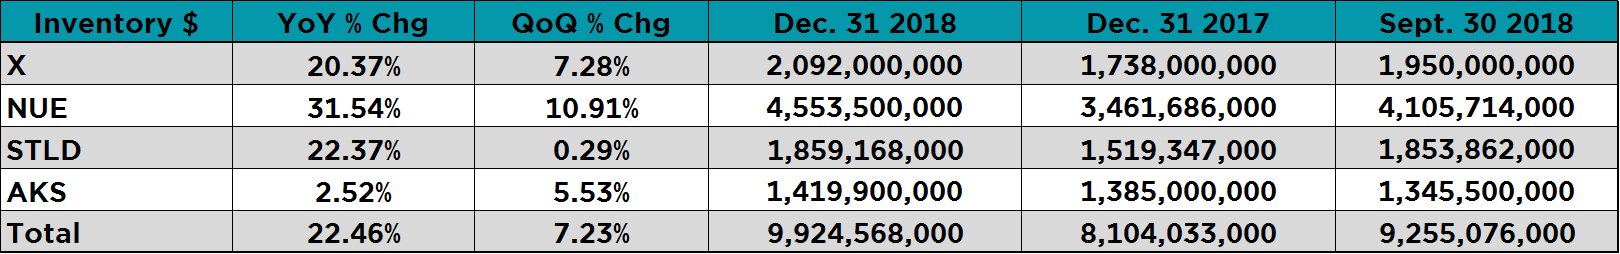
Examining the balance sheets of the domestic steel mills that have reported their earnings so far shows an increase in inventory in dollar terms of 22.5% YoY and 7.2% QoQ. How much of that inventory is raw materials, semi-finished or finished steel is unknown, but taking into account the weakness seen in Q4 combined with the three plus months of over 80% capacity utilization rate can lead to certain assumptions. This combined with the YoY gains in service center inventory begs the question is there too much steel.
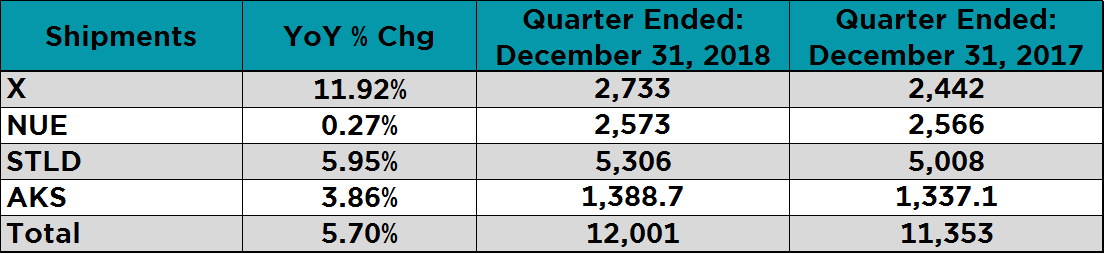
Below are YoY shipments, which were up 5.7% YoY.
In addition to this supply side question, a new major downside risk presented itself last Tuesday when Texas Republican representative Kevin Brady, ranking member of the House Ways & Means Committee, said the following regarding U.S.M.C.A.:
“Key things in my discussions with members, Republicans and Democrats, is that they’re not really willing to consider this agreement until the steel and aluminum tariffs are ensured to be lifted off, including quotas,” Brady said Tuesday during a morning appearance at a trade conference in Washington.
“Frankly, quotas can be just as disruptive as tariffs can be … the truth of the matter is the agreement’s strong enough to stand without them. These are fair trading partners, trading fairly in those metals, so I think that’s going to be one of those threshold issues.”
As the week continued, more members of congress on both sides of the aisle voiced opposition to the tariffs. Then, a number of bills regarding the matter were introduced. One bill sought to limit the power of the president to levy tariffs under Section 232 and for reasons of national security. A similar bill went a step further requiring a congressional vote on the steel and aluminum tariffs imposed last year on not only Canada and Mexico, but also the European Union. The industry has struggled with this issue for almost two years, but it seems the risk pendulum has swung from upside risk to downside risk. Trying to forecast policy changes is a fool’s errand, but if any adjustments, exclusions, reversals, etc. to the 25% tariff on steel occurs, then a sharp and immediate price fall is all but certain, all else being equal. Thus, Tariff resolution has been moved to the top of the Downside Risks list.
As noted above, there has been an increase in supply with restart of Granite City and JSW coming to market. The demand side weakened rather dramatically in late 2018. What at first was thought to be a “buyers strike” in response to high steel prices, looks to have been more due to a slowdown in new orders for manufacturing products. The January ISM Manufacturing PMI fell a shocking 4.5 points to 54.3 with the new orders subindex collapsing to 51.3. This coincided with a global slowdown in PMIs. The drop in the ISM PMI also broke through the more than three-year trend line. It looks as if the uptrend in manufacturing and steel prices ended in late 2018 and is now in a bear market downtrend that started when the ISM and flat rolled prices peaked in the summer of 2018. Characteristics of bear markets include not only deleveraging and rapid price depreciation, but also sharp rallies or short squeezes, such as the abrupt $40 rally seen over the course of a few days in CME Midwest HRC futures.
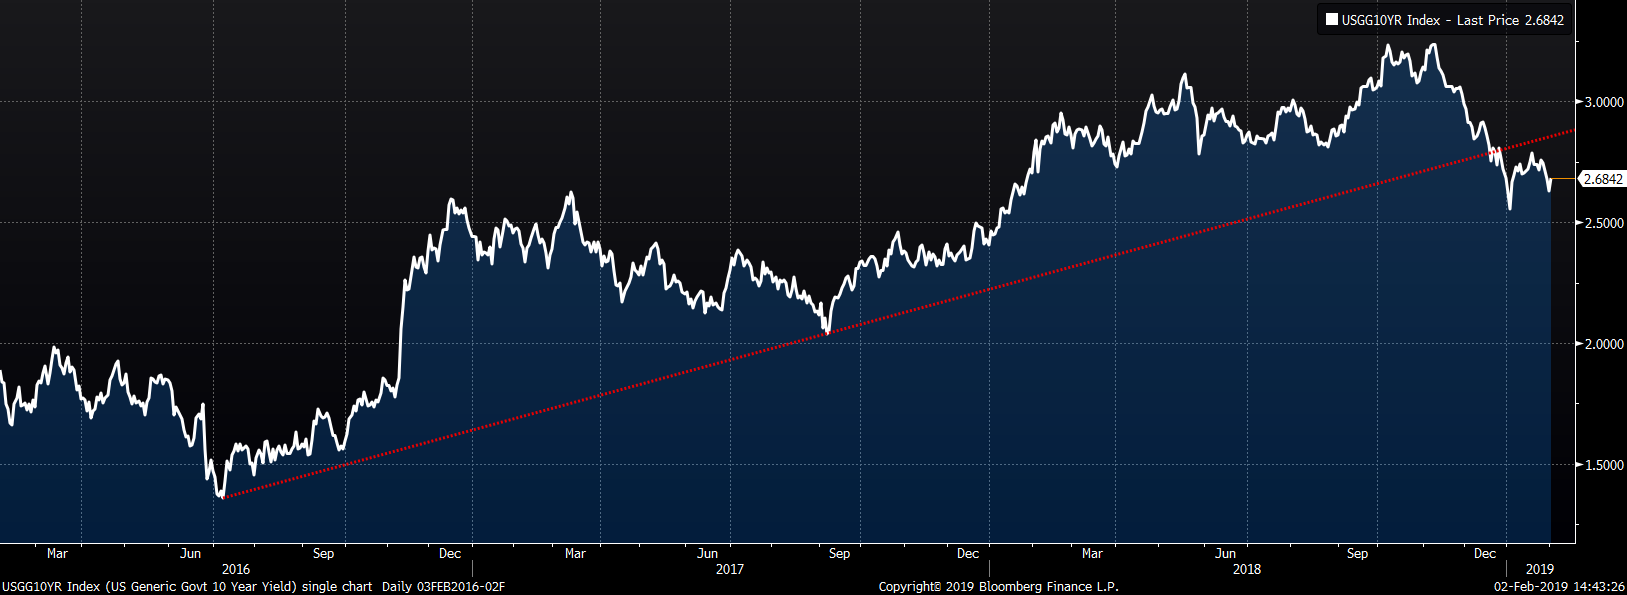
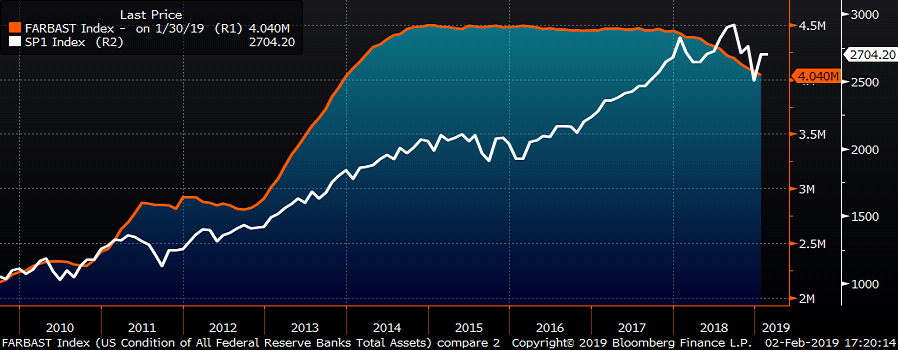
While the idiosyncrasies of the steel industry move prices in the short term, the Federal Reserve is at the center of the deleveraging, which is having a dampening effect across not only the U.S. economy, but also the global economy. This chart compares the assets on the Federal Reserve’s balance sheet with the S&P 500. Two things become apparent. First, the correlation between the rise in the Fed’s balance sheet and the strength in the stock market are clear. Second, it wasn’t long after the Fed started to shrink their balance sheet that volatility increased and not only did the stock market sell-off, but also there were troubling signs liquidity was being withdrawn from corporate bond markets. This also coincided with a steep drop in the price of oil. In response to these developments, Federal Reserve Chair Powell did an abrupt 180-degree turn communicating a dovish stance regarding the path of further rate hikes, which has successfully calmed markets for now.
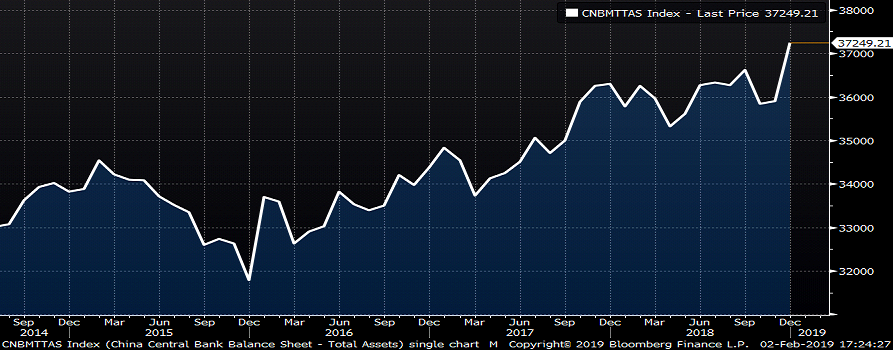
The evidence is clear that the trade war has slowed China’s economy dramatically. China has taken a proactive approach, as discussed above, evidence further below with the increase of assets on the P.B.O.C.’s balance sheet.
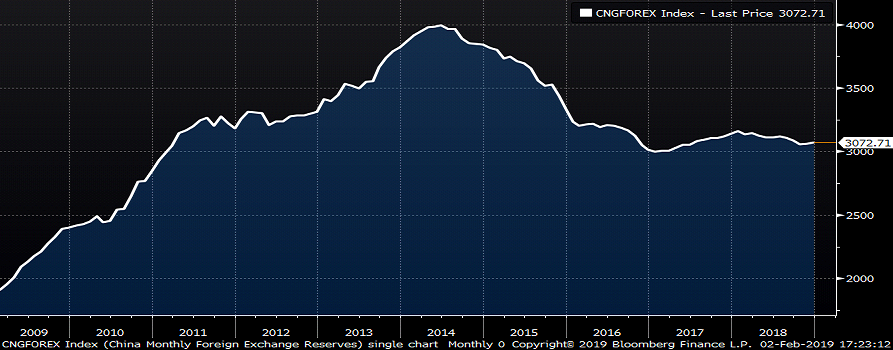
One interesting note is that China has maintained a stable level of foreign exchange reserves….
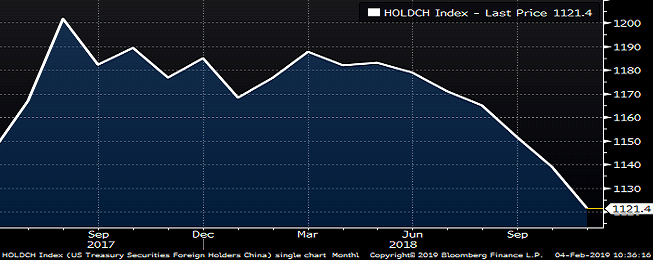
While steadily decreased its holdings of U.S. Treasury Securities since the trade war began selling almost $70 billion worth.
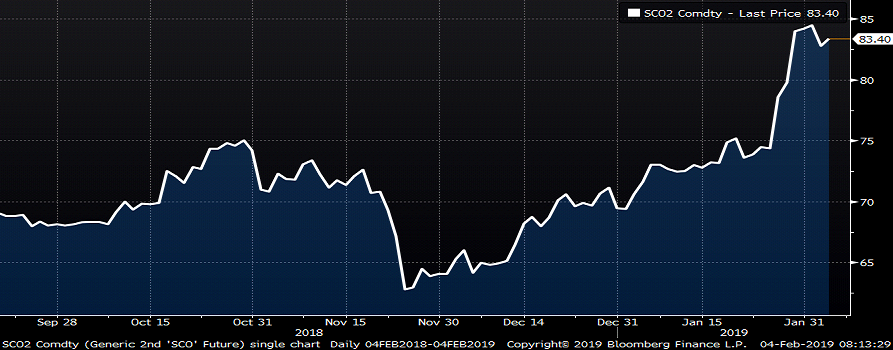
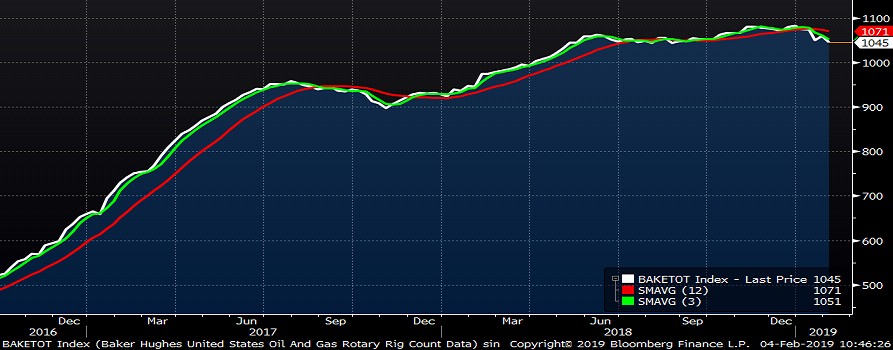
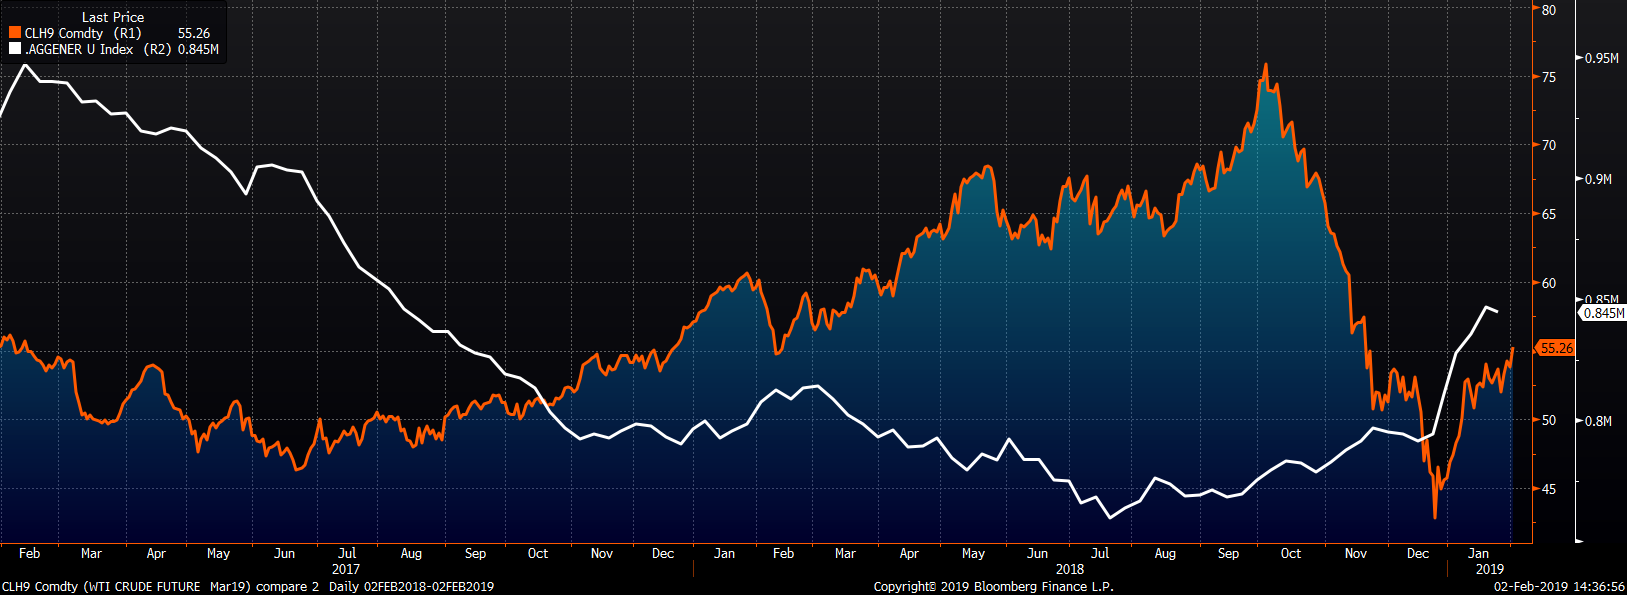
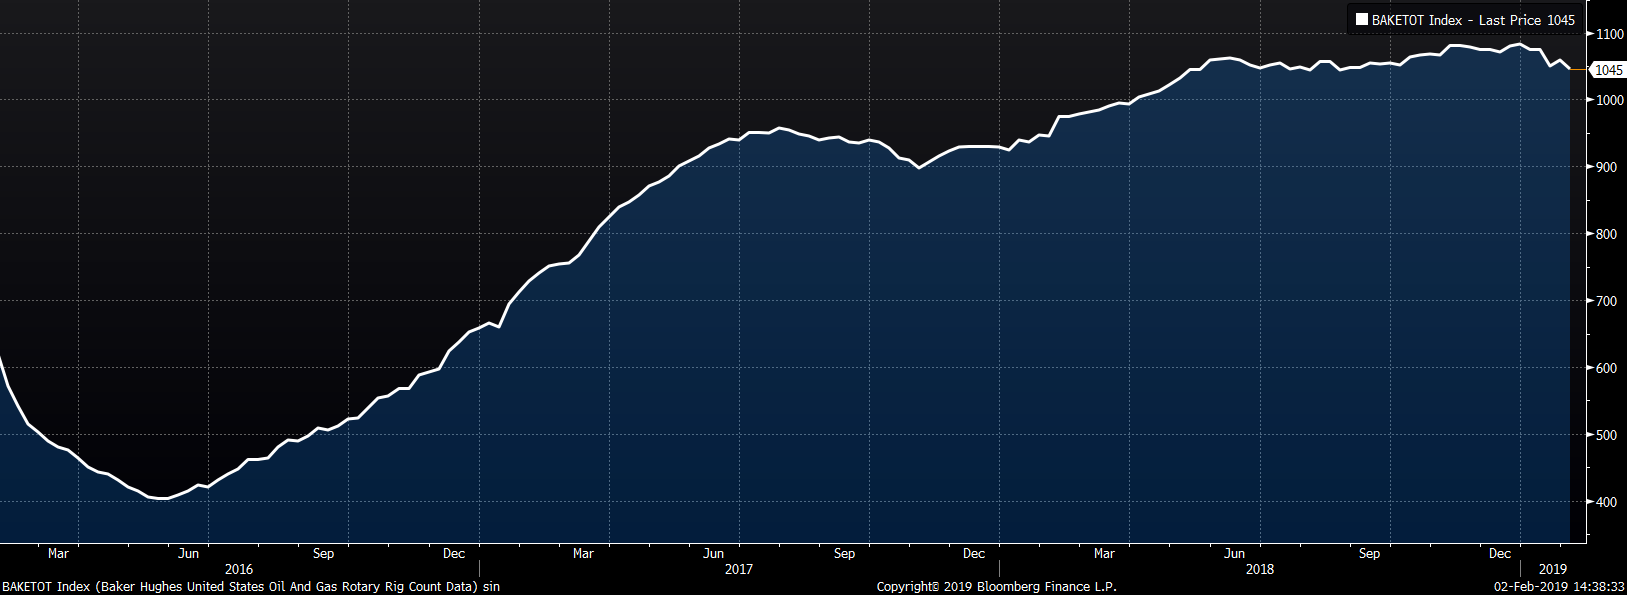
The outlook for the energy industry is a critical component to forecasting steel demand. As oil prices collapsed from $75/bbl to as low as $42.50/bbl in Q4, this report began taking a closer look at the relationship between oil prices and rig counts. The chart below shows the lagged relationship between oil prices and oil rigs indicating rigs will continue lower in the coming months, a significant drag for OCTG demand and the steel industry.
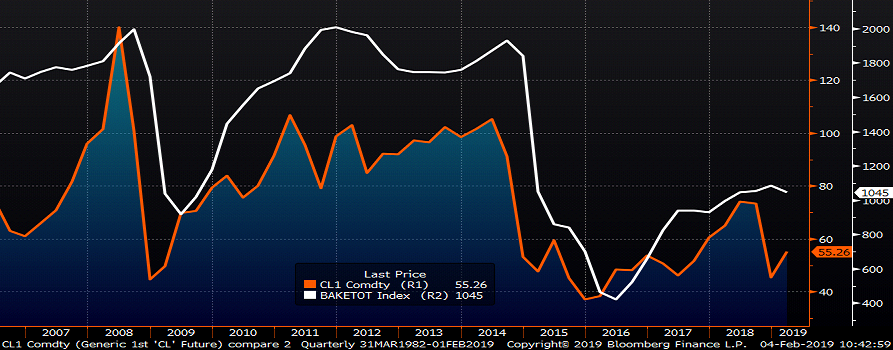
The Baker Hughes U.S. Rig Count fell 14 rigs last week to 1,045 with its three-month moving average falling below its twelve-month moving average. After initially falling 10% – 14% at the end of November, OCTG prices took another leg lower last week falling another 7% – 8% (depending on type).
On Friday, the ISM Manufacturing PMI, global manufacturing PMIs, November U.S. construction spending, auto sales and the U.S. employment report were released. Each report showed signs of slowing growth. The ISM gained, but looks to have moved into a downtrend. Global PMIs on whole worsened with Germany’s PMI falling below 50. Construction spending slowed with private residential spending down YoY for the third consecutive month. U.S. auto sales fell to the lowest level for January sales of the past five years.
The following issues provide the foundation of our view:
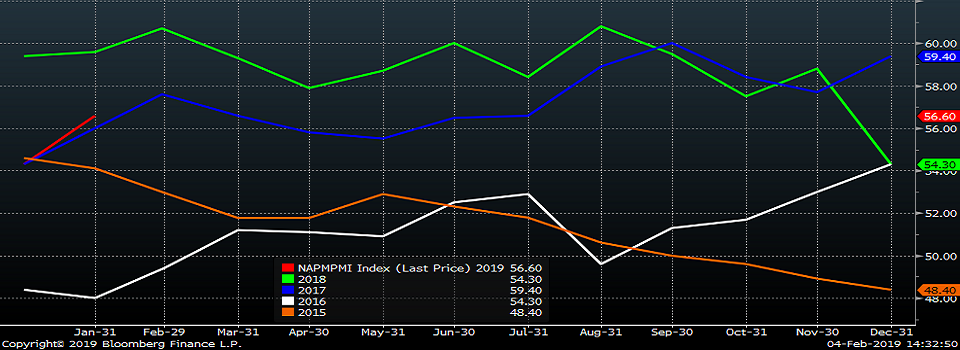
The January ISM Manufacturing PMI printed 56.6 recovering 2.5 points from December’s sharp drop.
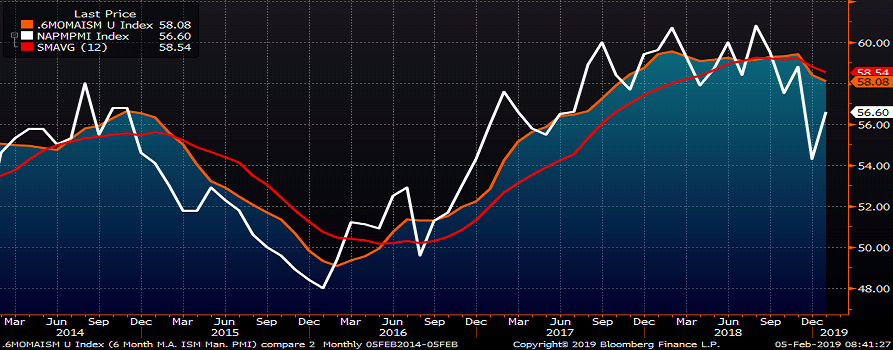
The ISM Manufacturing PMI six-month moving average decreased to 58.08 falling to its lowest level since October 2017. The six-month moving average has crossed below the twelve-month.
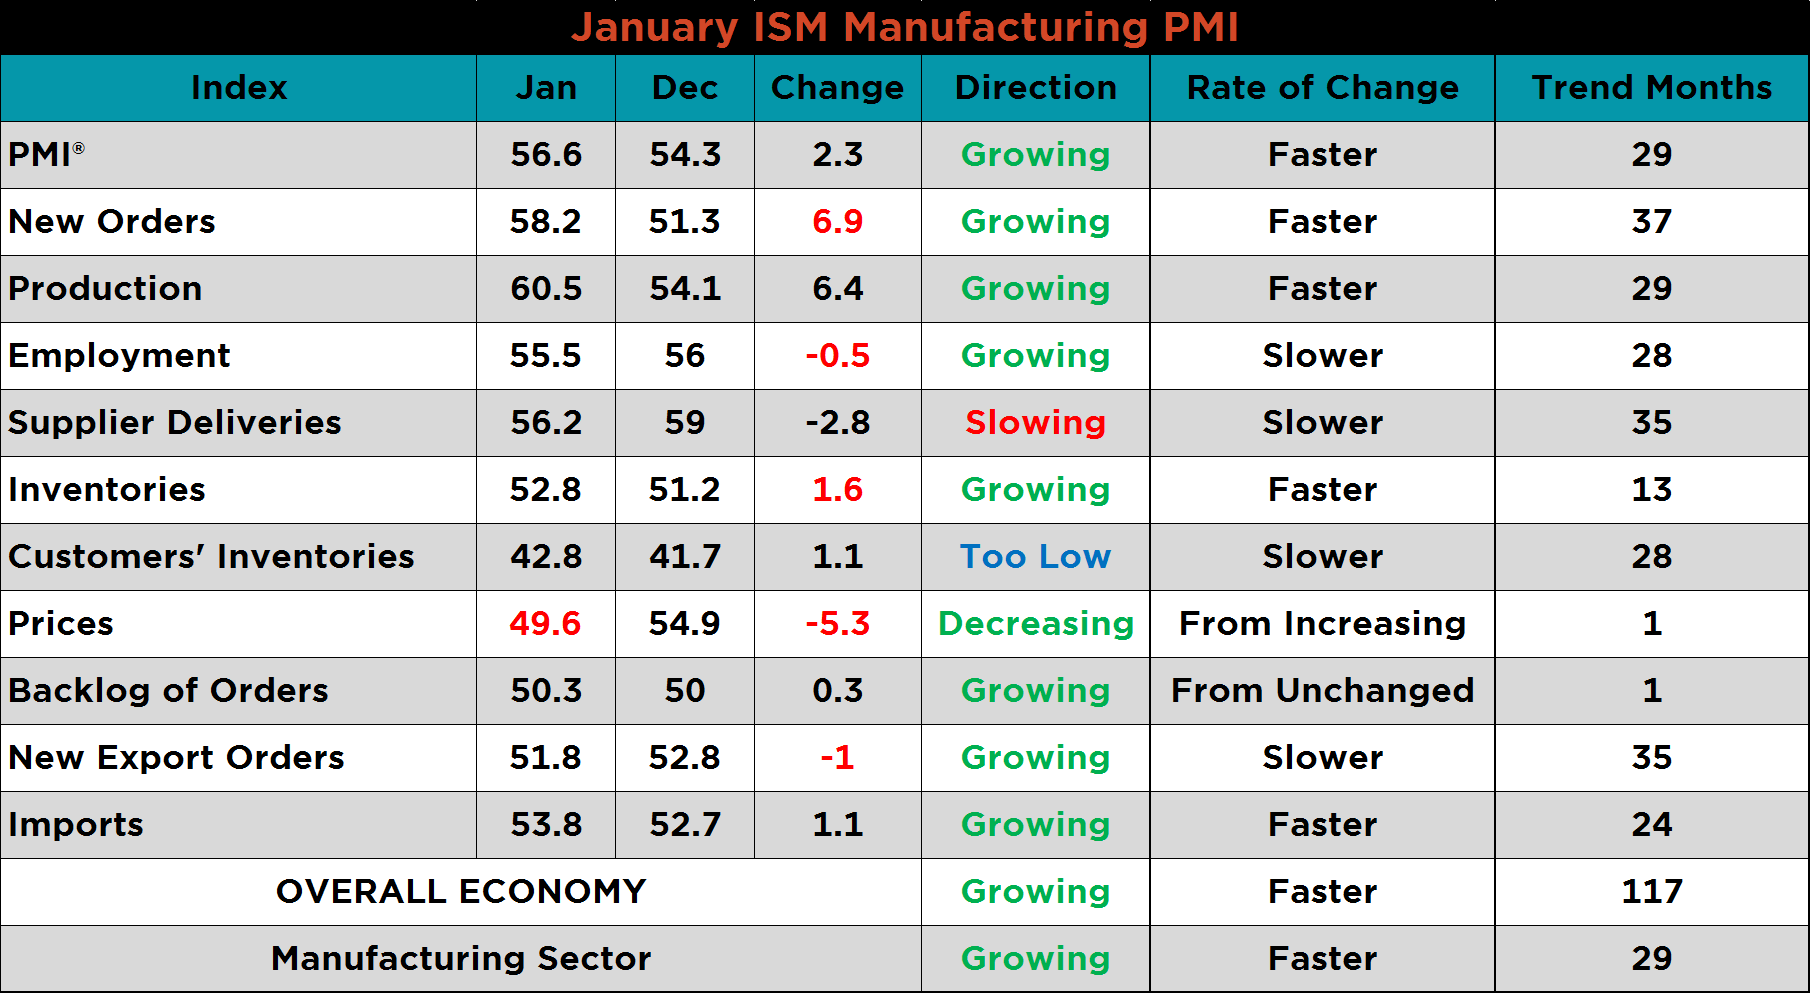
The ISM Manufacturing PMI with subindexes are shown below. The new orders and production subindex rebounded sharply, while the prices subindex took a sizeable leg lower falling into contraction.
The ISM Manufacturing PMI printed at the second highest level for the month of January going back five years, but was down three points YoY.
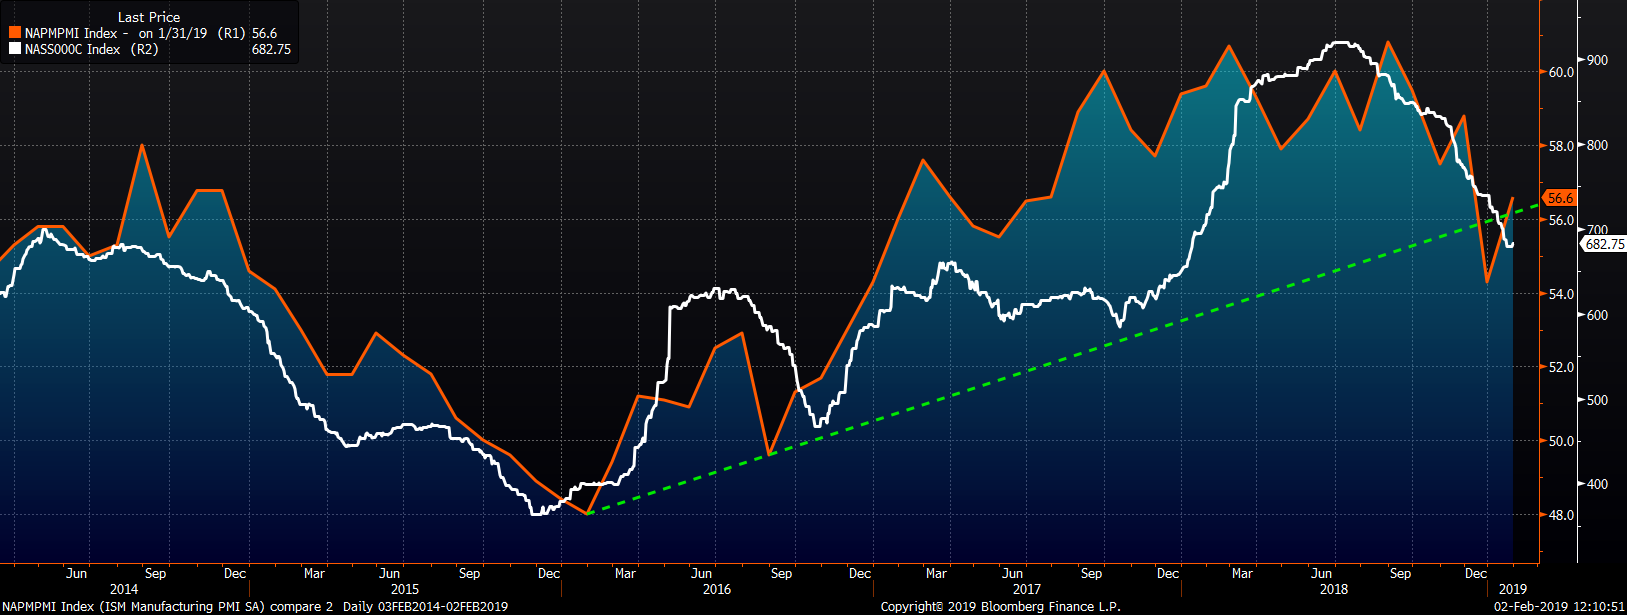
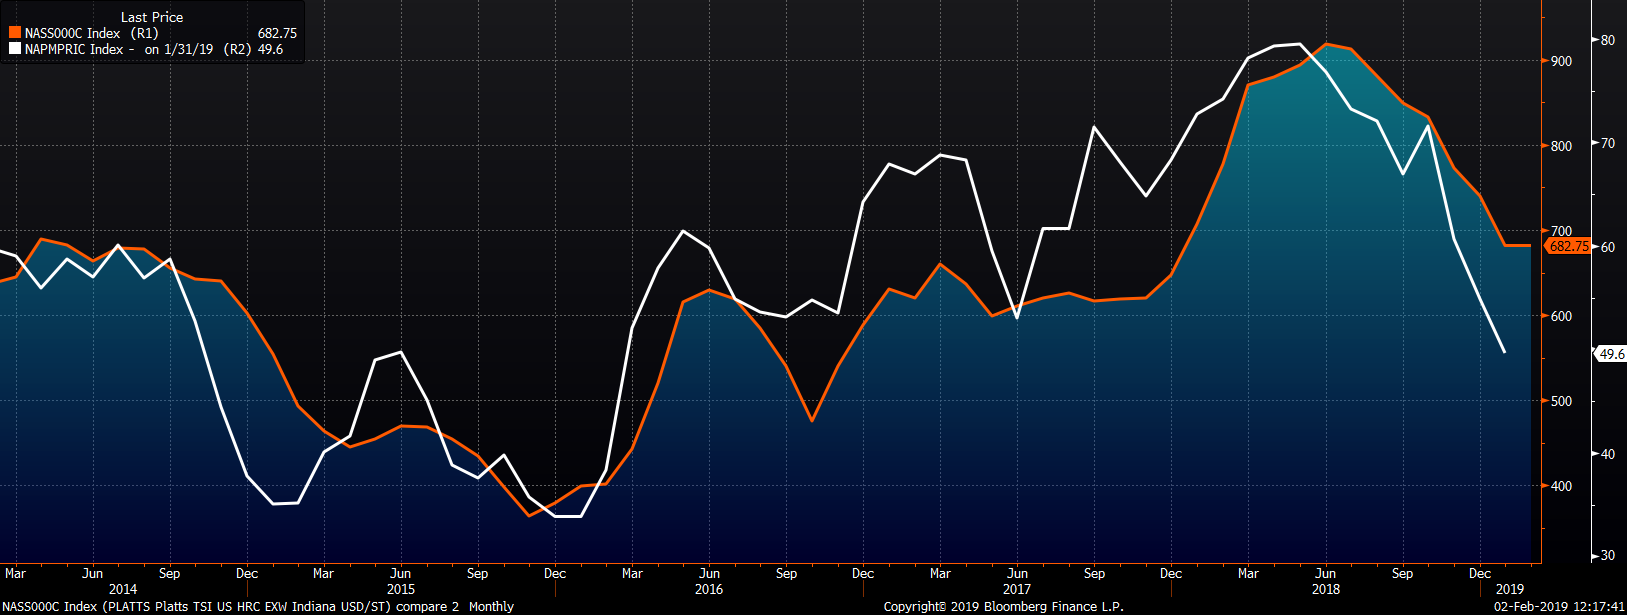
The next two charts compare the ISM new orders subindex and ISM prices subindex with the Platts TSI Daily Midwest HRC Index. In both cases, the subindexes were below the Midwest HRC index indicating HRC prices have more room to fall.
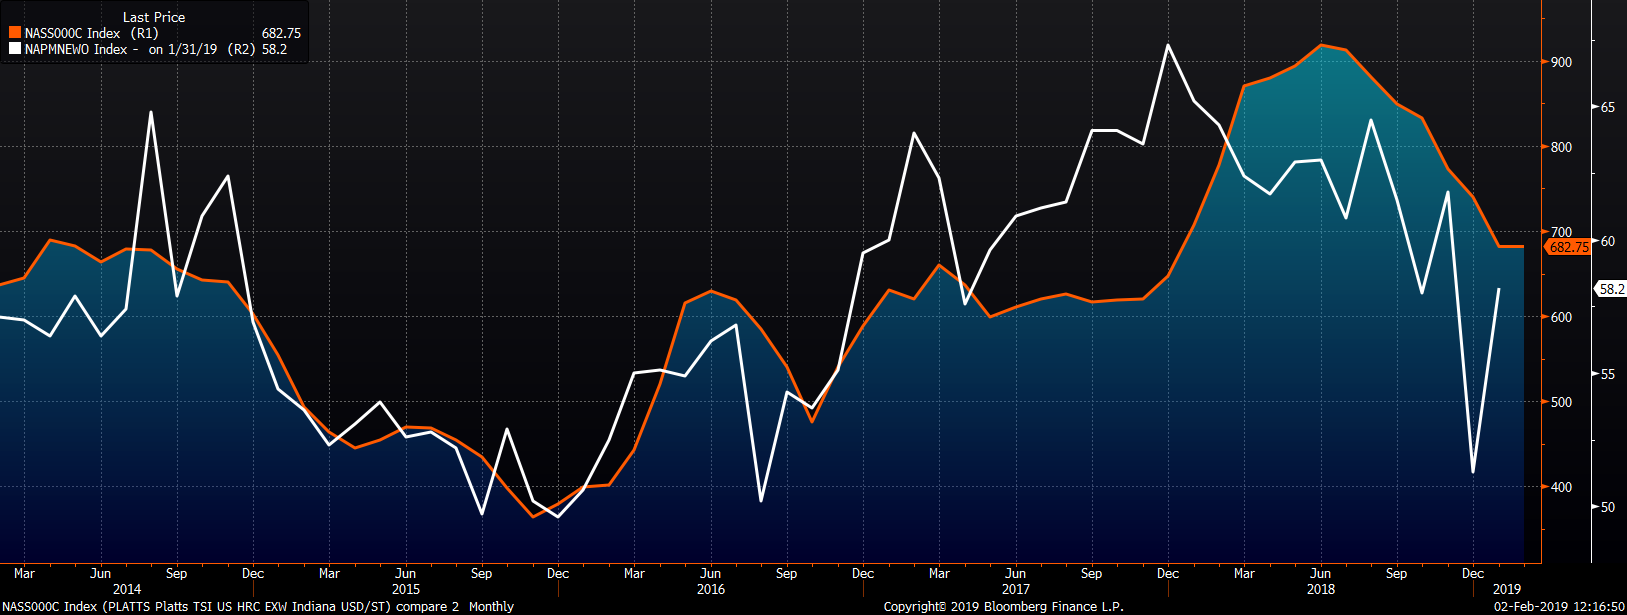
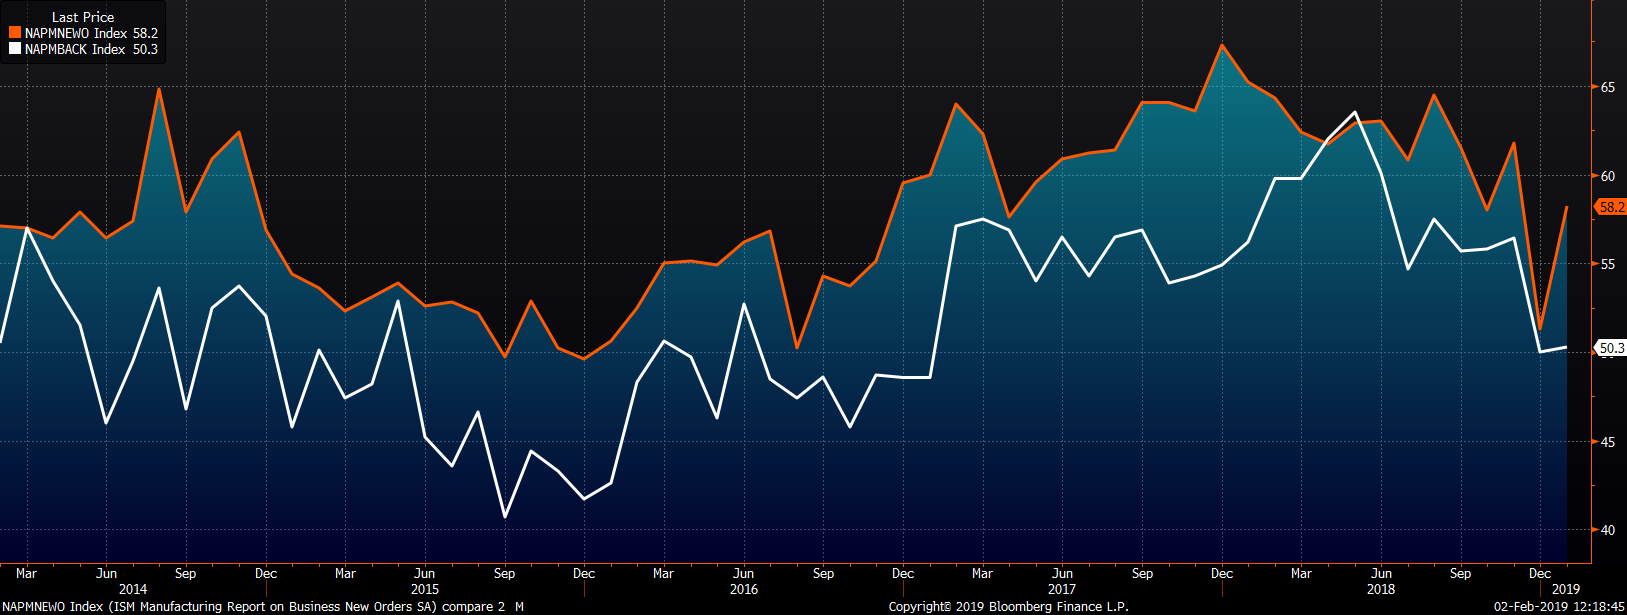
The January ISM new orders subindex rose 6.9 points to 58.2 while the backlog subindex rose 0.3 points to 50.4.
While the new orders index rebounded nicely vs. December, it remained below the January levels of 2017 and 2018.
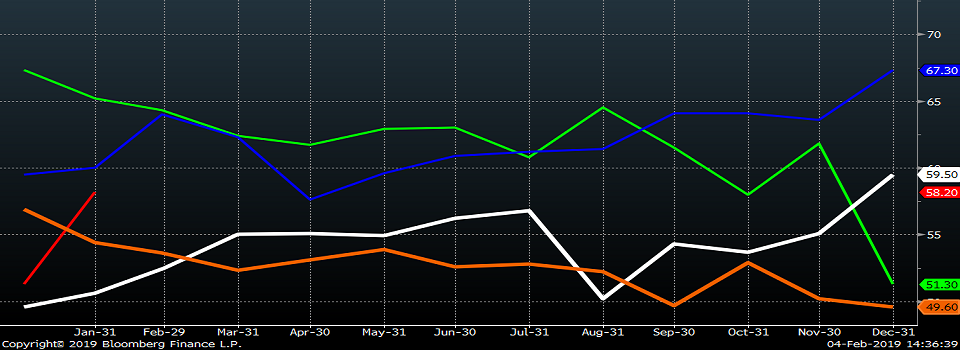
This chart adds the new orders and backlog subindexes. Even with the MoM increase in new orders, January printed at the second lowest level since October 2016.

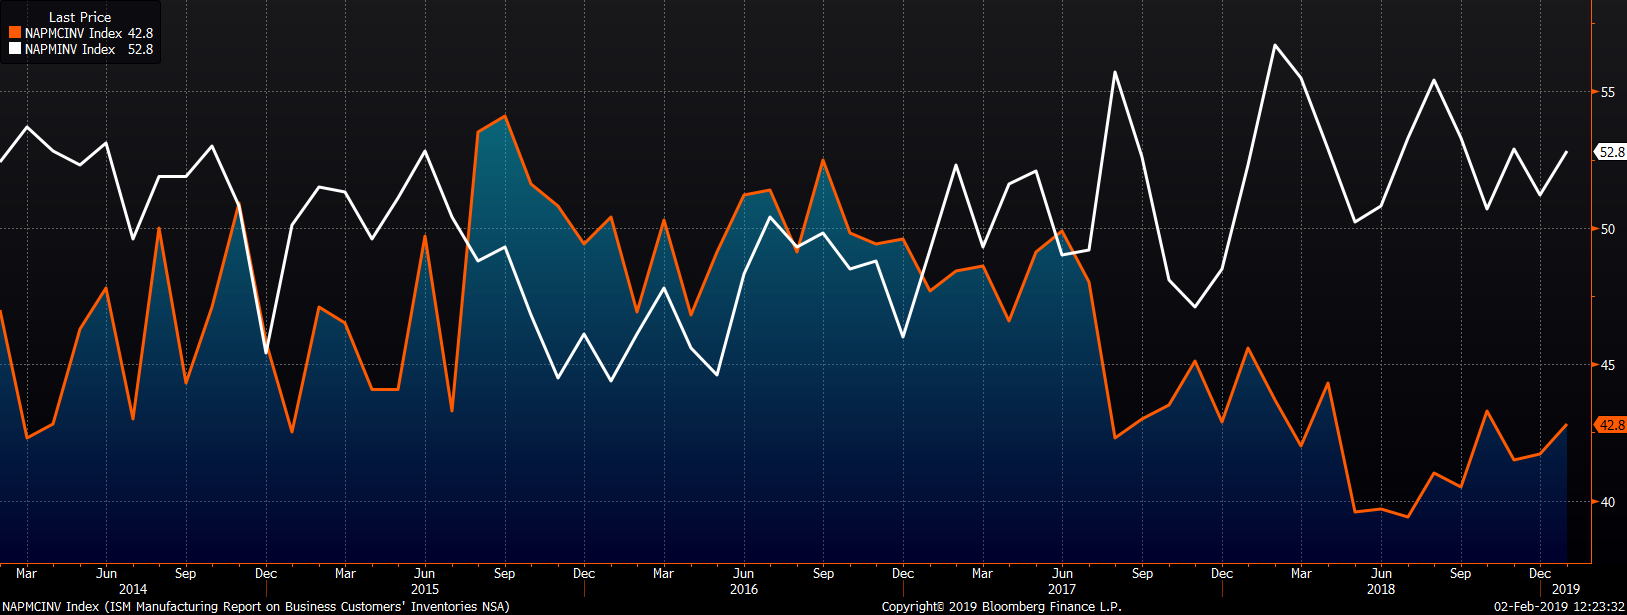
The chart below shows both the producer inventory subindex and the customer inventory subindex up slightly to 52.8 and 42.8, respectively.
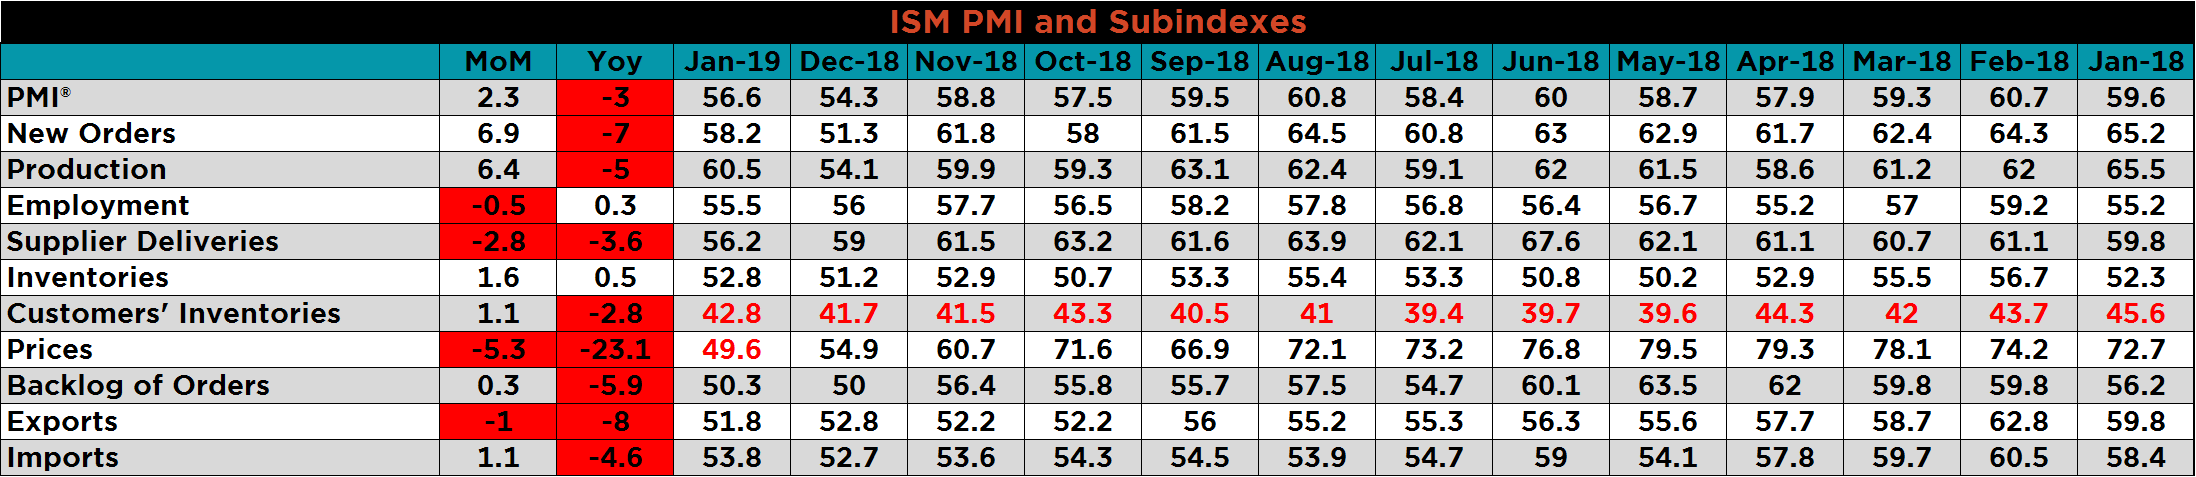
This table shows the monthly ISM PMI and subindexes back to January 2018. Most subindexes are down YoY with the prices, exports, new orders and backlog subindexes down the most.
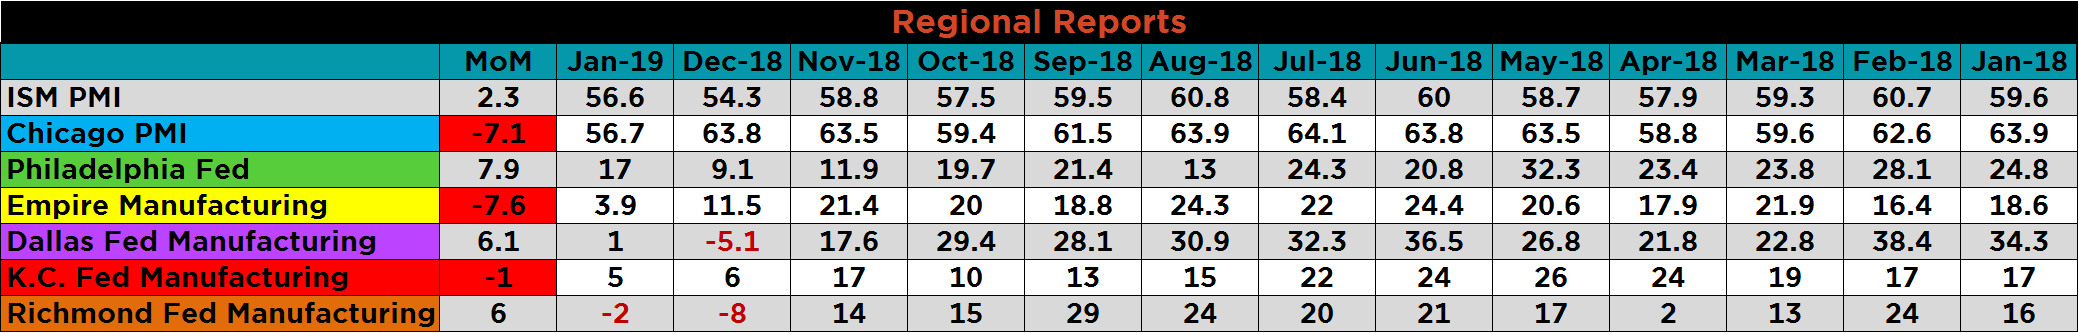
The table below shows the monthly ISM and regional PMIs back to January 2018. Notice the YoY declines in the regional reports.
The January global purchasing manager indexes continued to decline overall with seven countries now in contraction. China, South Korea, Taiwan, Italy and Turkey continued to see their PMIs in contraction. Germany and Indonesia’s PMI fell below 50, while Mexico and France moved back above 50.
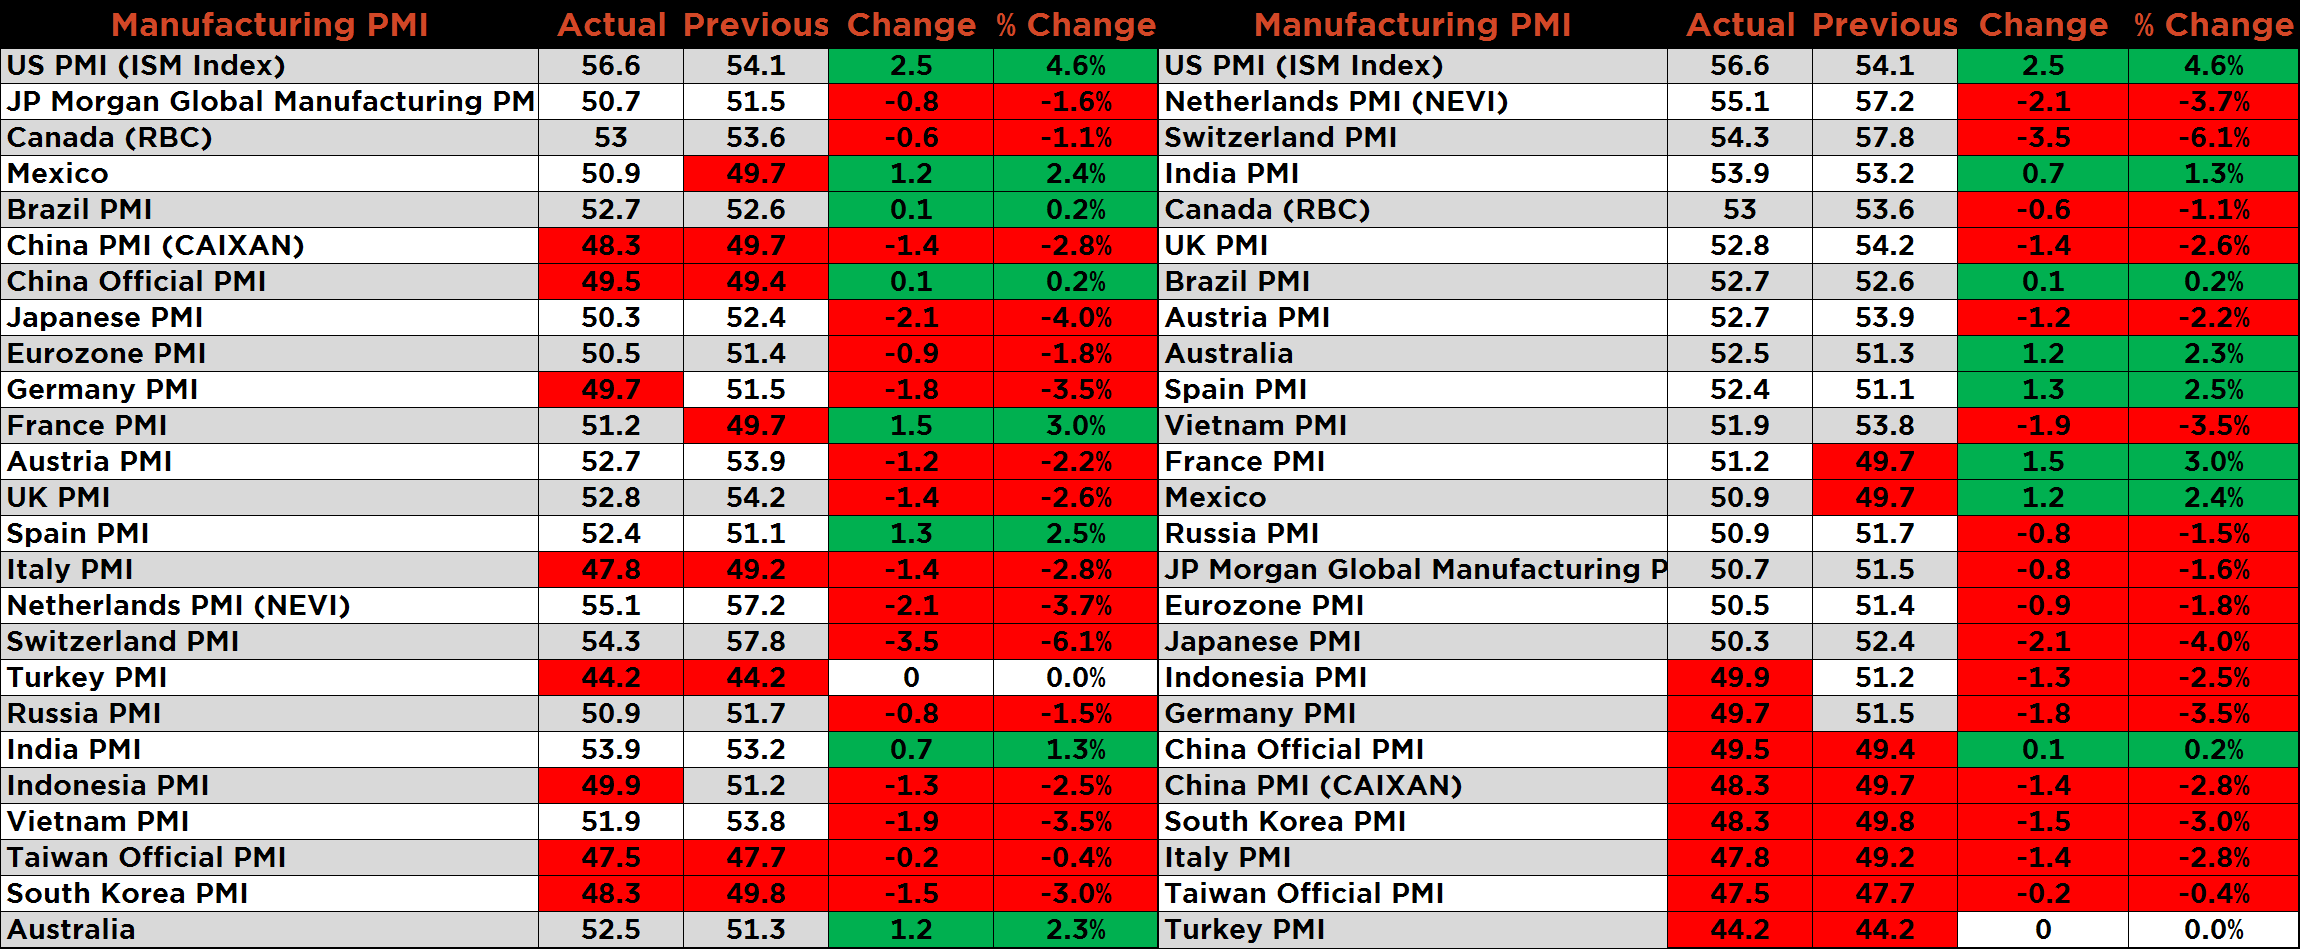
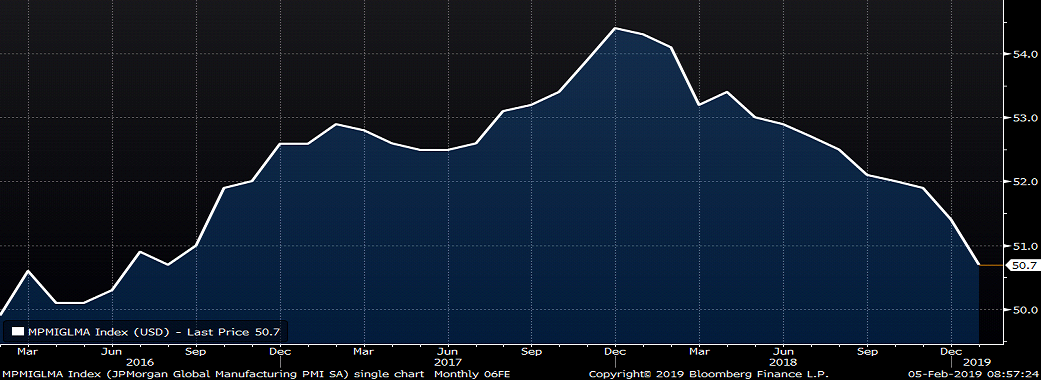
The JP Morgan Global Manufacturing PMI continued to decline falling 0.8 points to 50.7, its lowest level since August 2016.
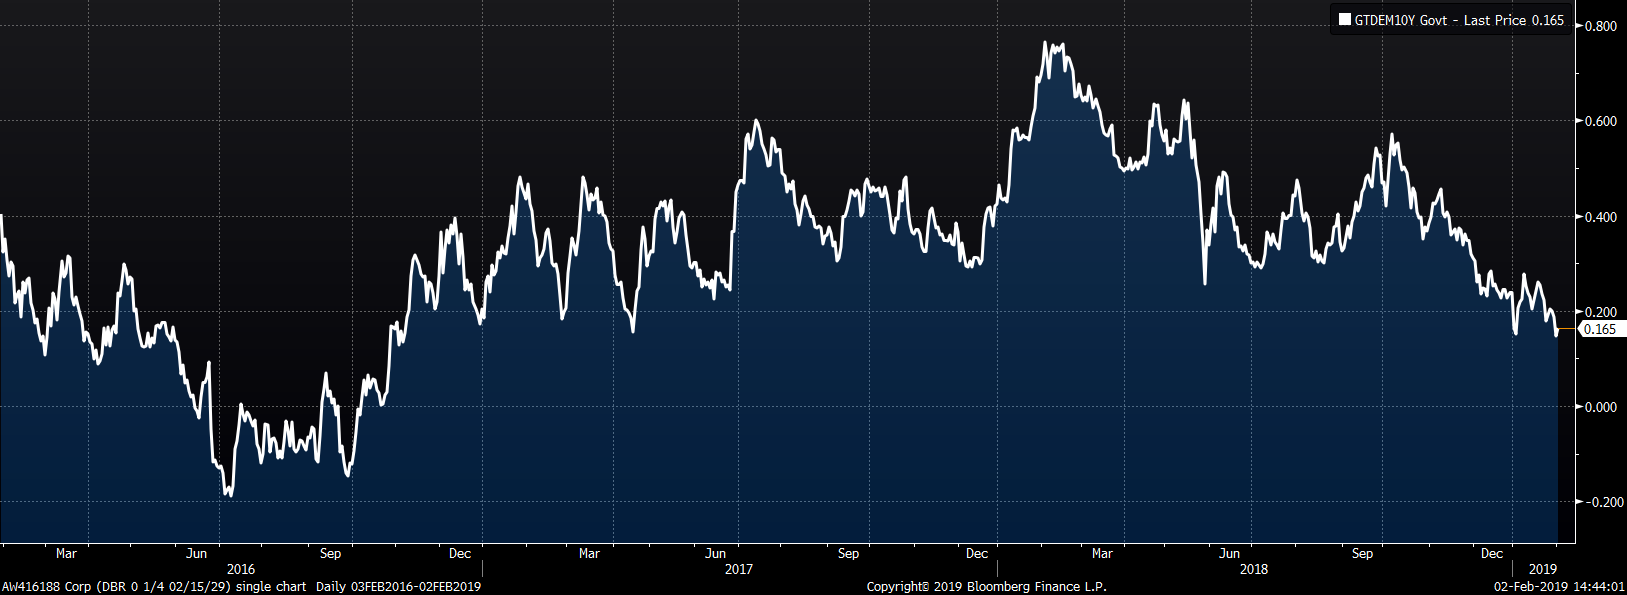
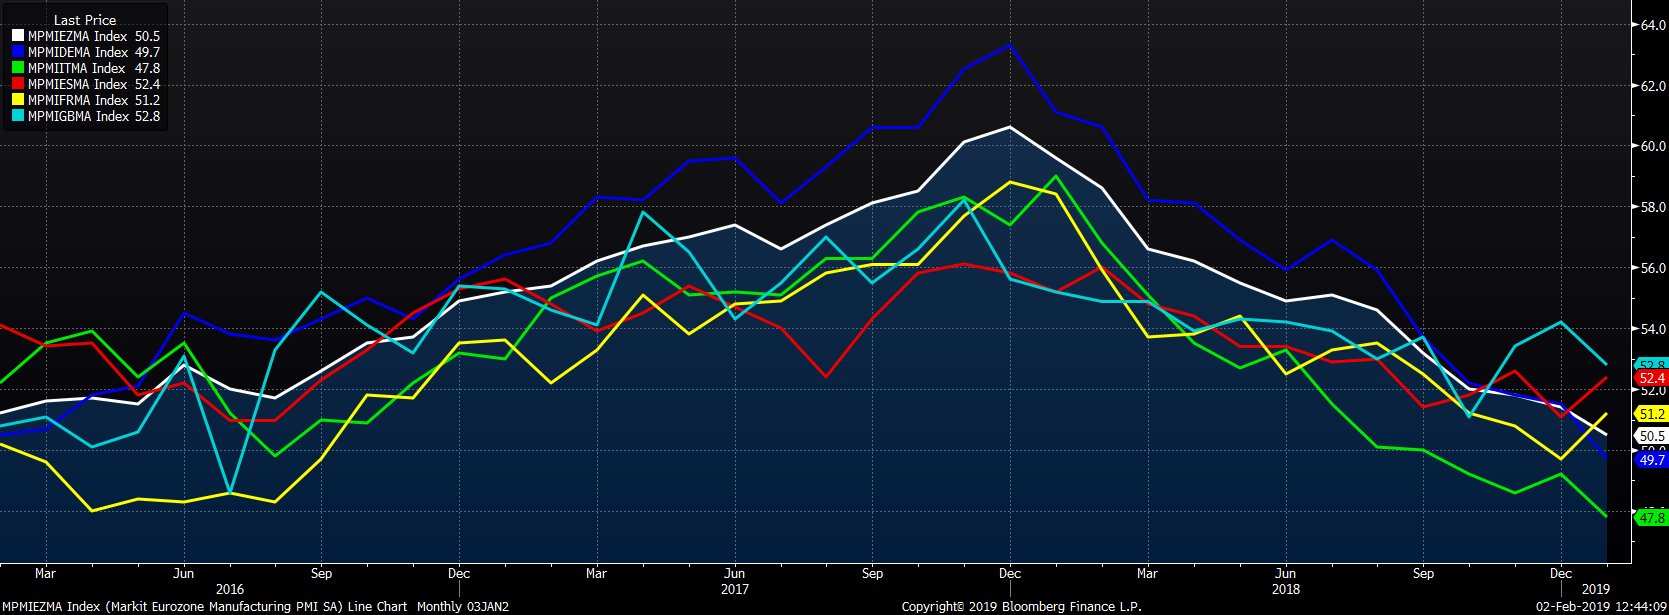
The overall downtrend in European PMIs continued in December. The PMIs of the Eurozone, Germany, the U.K. and Italy were lower, while the PMIs of Spain and France gained. Germany fell below 50, while France bounced back above 50.
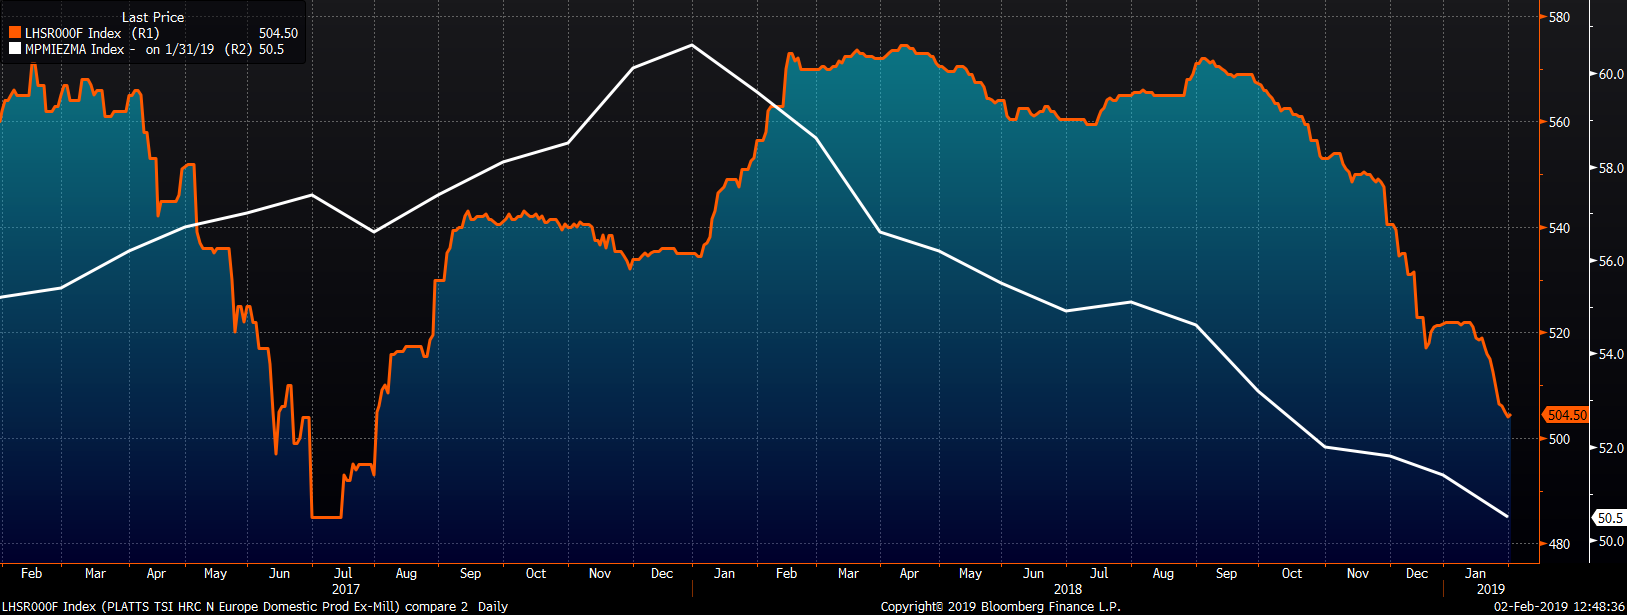
The chart below shows the Eurozone PMI and the TSI North European HRC Index continuing their long-term downtrend.
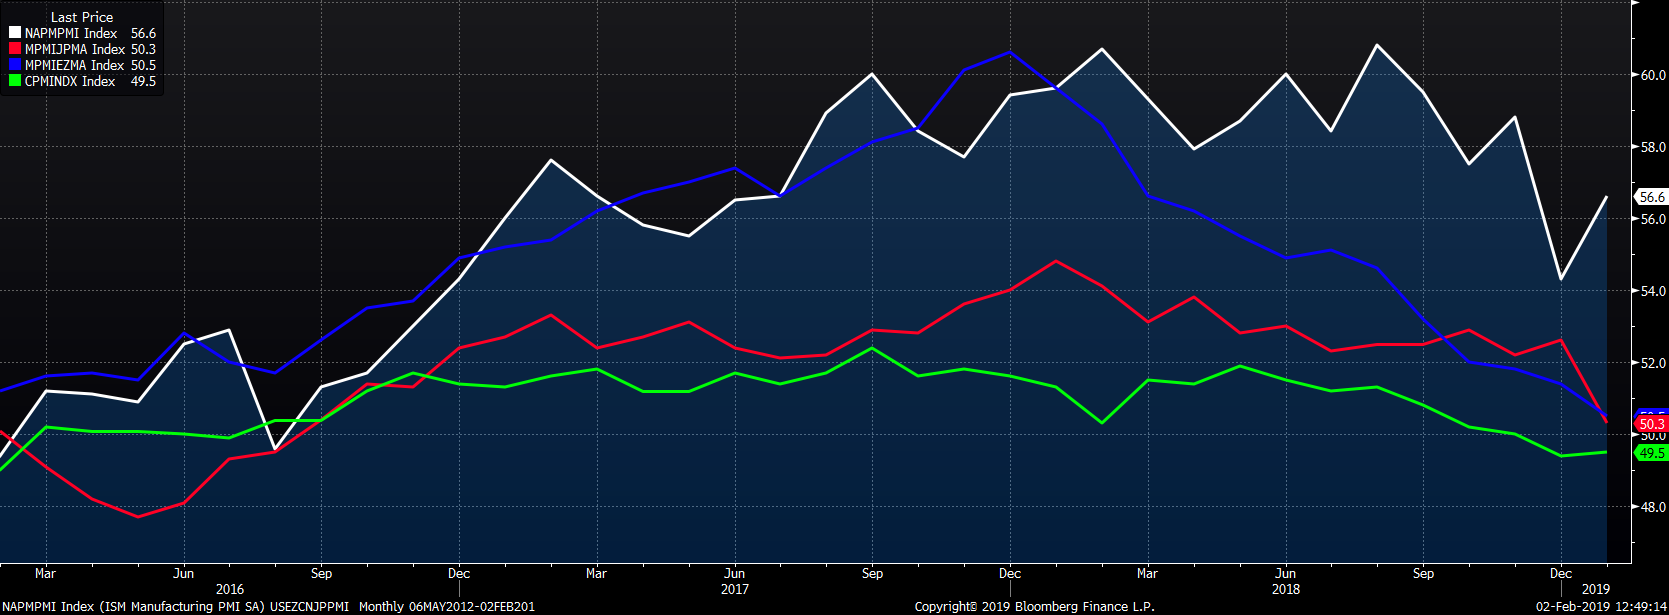
The PMIs of Europe and Japan moved lower to just above 50, China was essentially flat, while the U.S. gained.
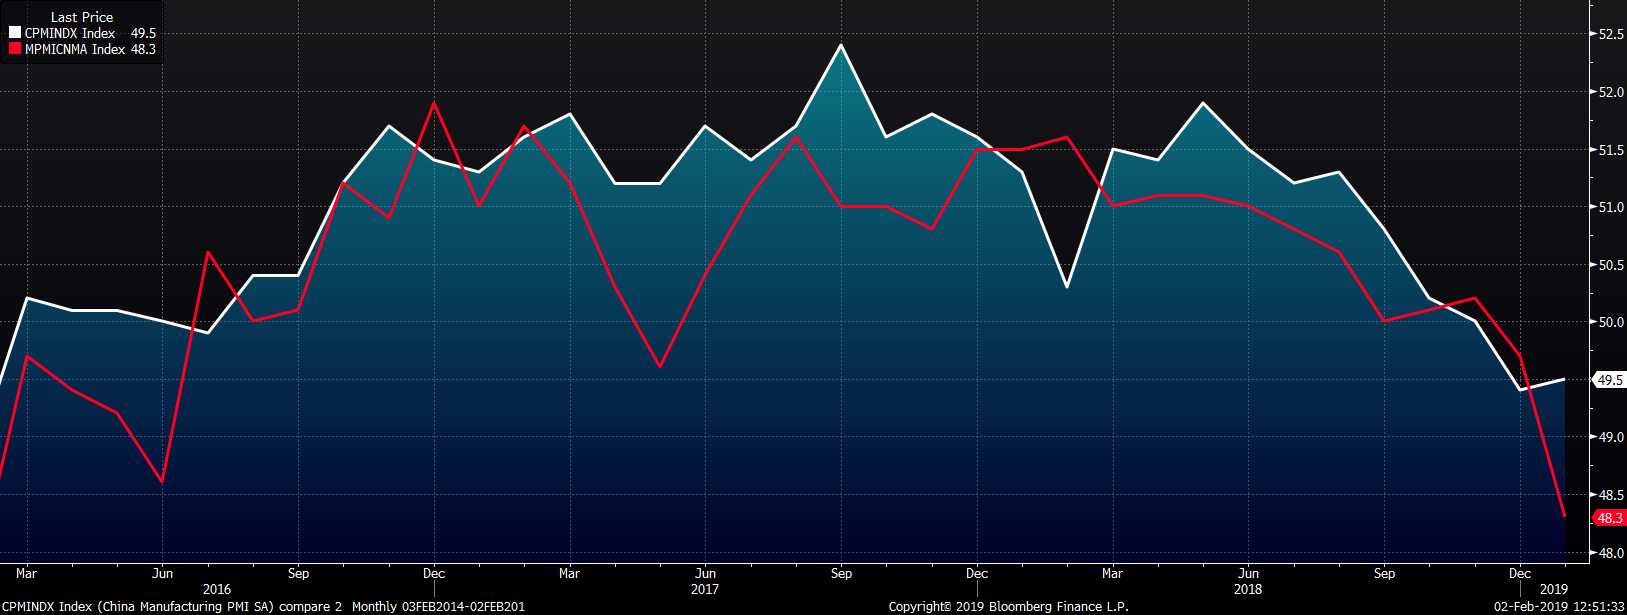
Despite the slight increase in China’s official PMI, both the official and Caixan Manufacturing PMIs remain below 50 and in contraction territory. The Caixan Manufacturing PMI fell to its lowest point in 3 years.
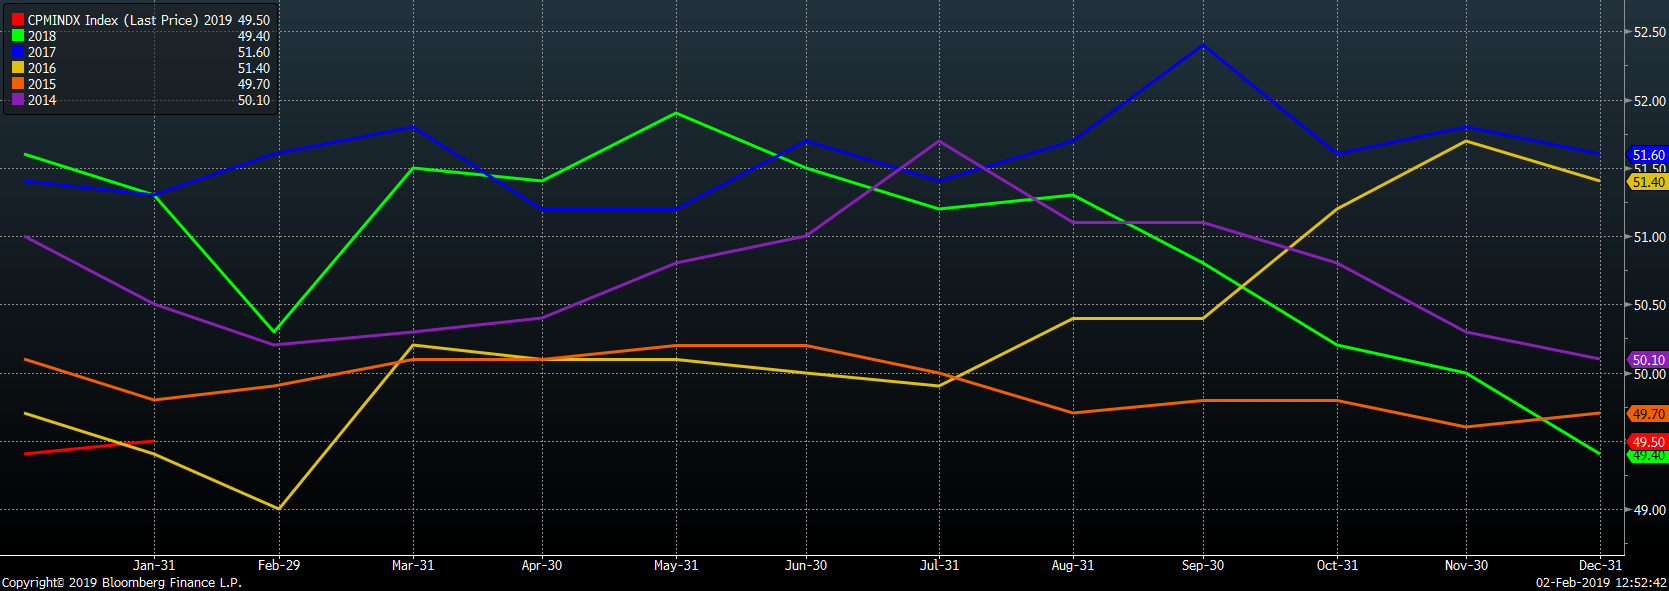
China’s official PMI printed at the second lowest January level of the last five years.
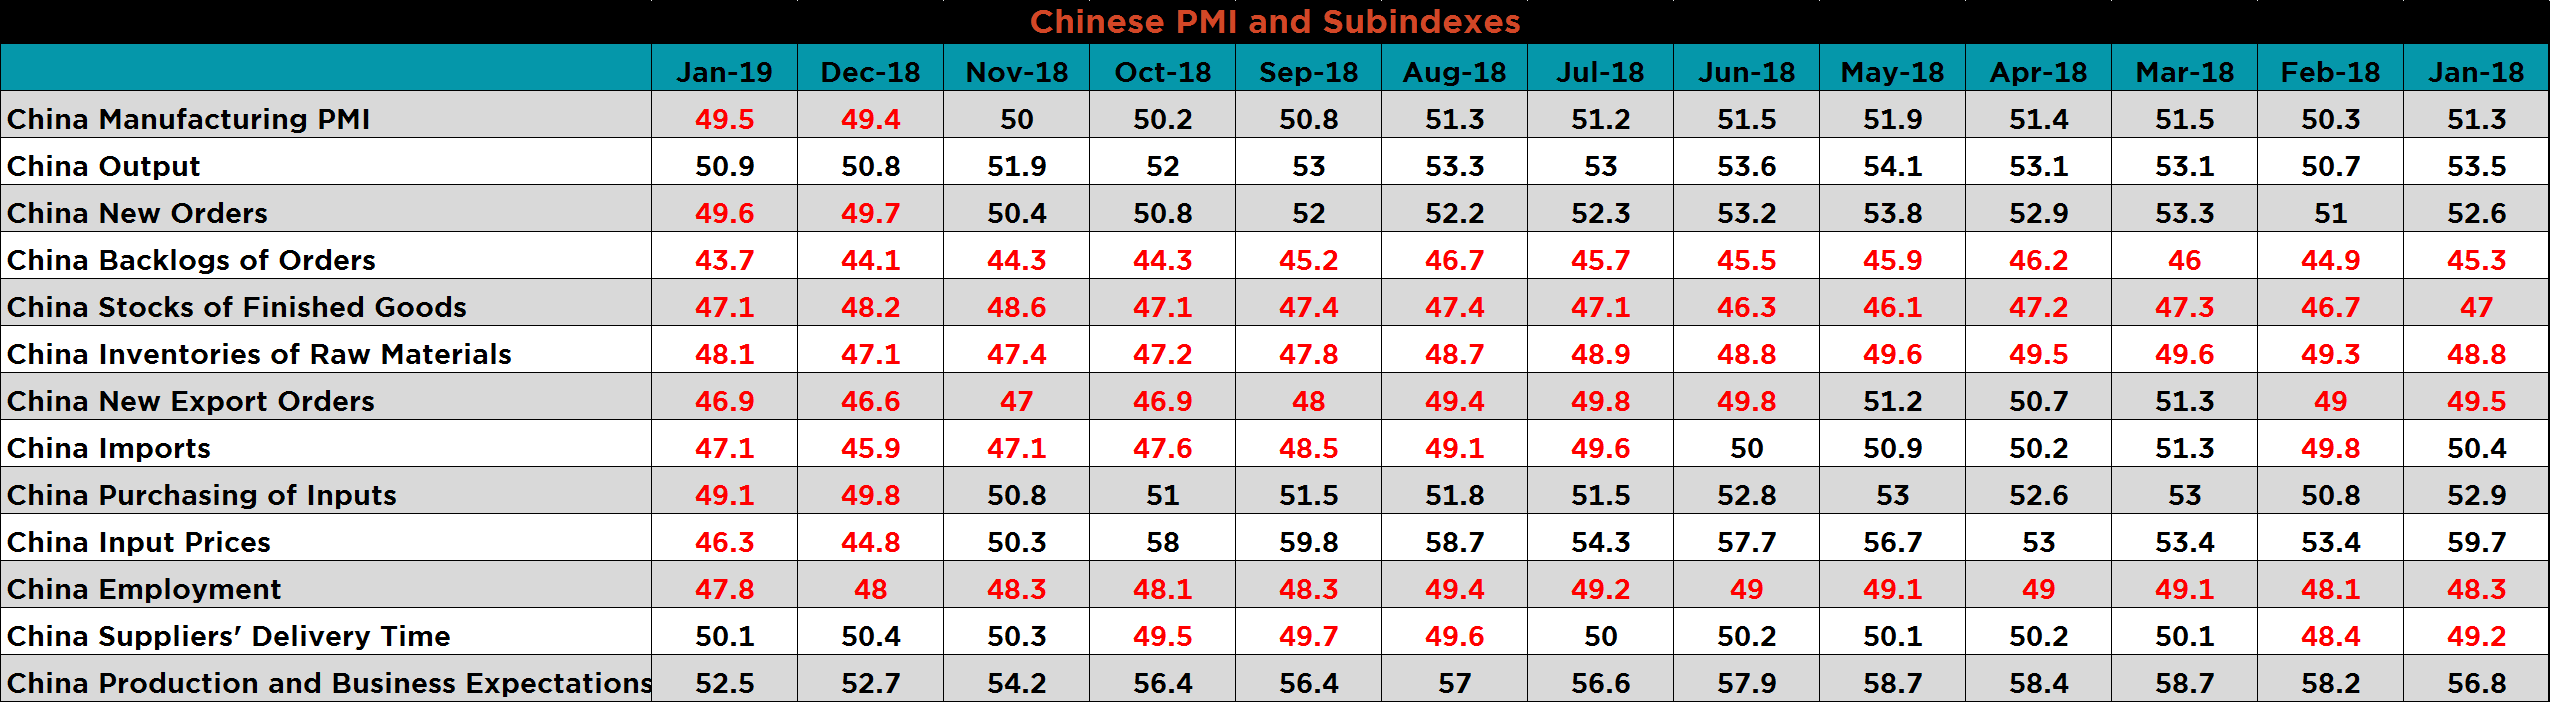
The table below breaks down China’s official manufacturing PMI subindexes. Ten of the thirteen subindexes remain in contraction while supplier delivery times and business expectations ticked slightly lower.
China’s new orders subindex fell further into contraction, while Chinese HRC futures and the Chinese HRC spot price have been in rally mode.
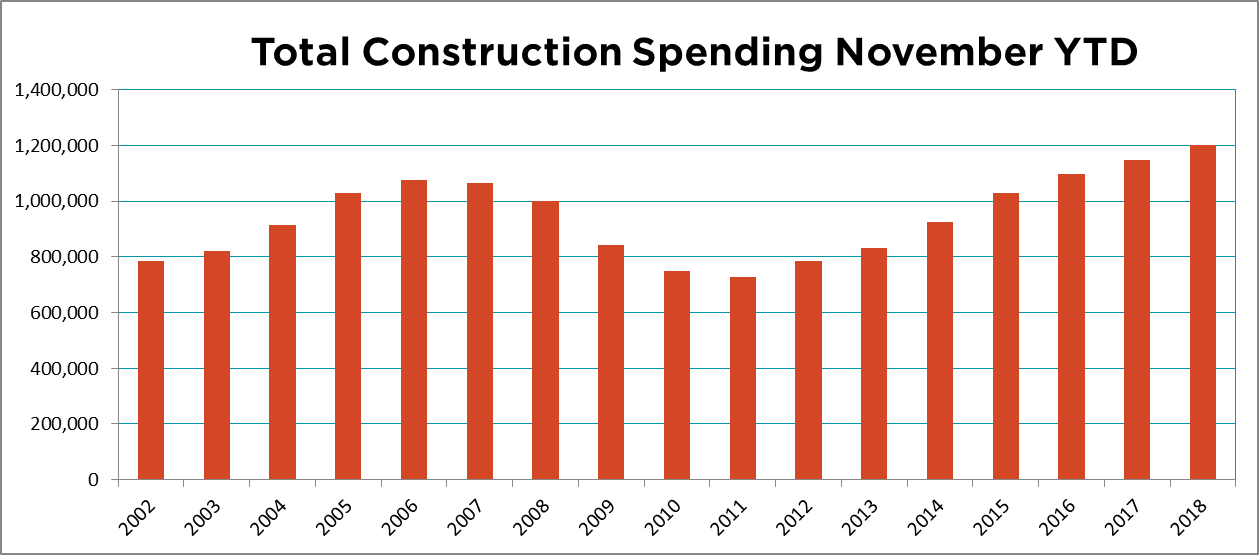
Seasonally adjusted November U.S. construction spending was up 0.8% MoM.

Unadjusted November total construction spending was 2.5% higher YoY while YTD spending gained 4.5% YoY.
Unadjusted November total private construction spending was 1.3% higher YoY while YTD spending gained 3.9% YoY.

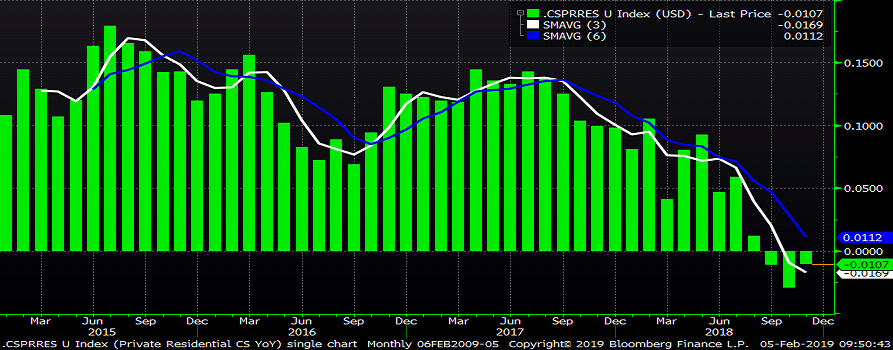
Unadjusted November private residential construction spending was down 1.1% YoY, while YTD spending gained 3.9% YoY.

Unadjusted U.S. residential construction spending was down YoY for the third straight month.
This chart shows unadjusted private residential construction spending YoY % change falling into negative territory for three straight months.
Unadjusted November private nonresidential construction spending was 4.2% higher YoY while YTD spending gained 3.5% YoY.
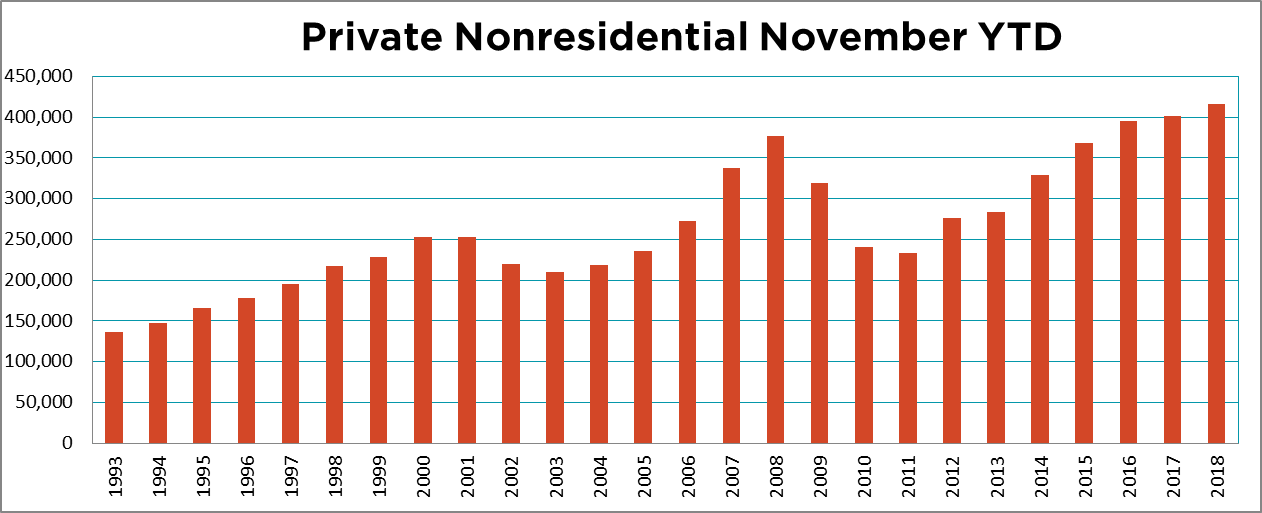
Unadjusted U.S. construction spending remained higher YoY, but the gap is shrinking.

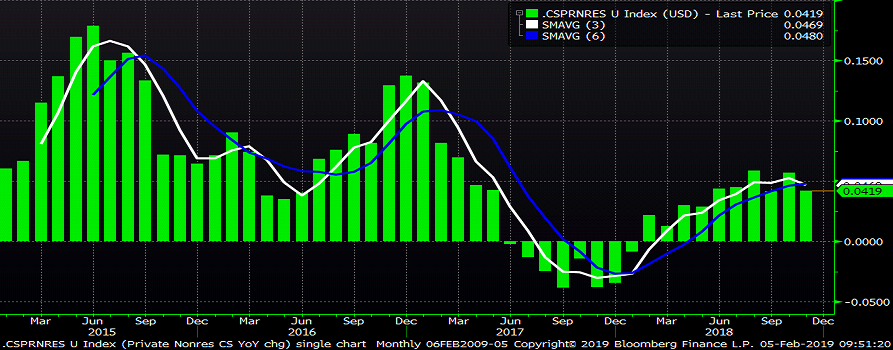
This chart shows U.S. nonresidential construction spending NSA YoY % change with the 3-month average crossing below the six-month average.
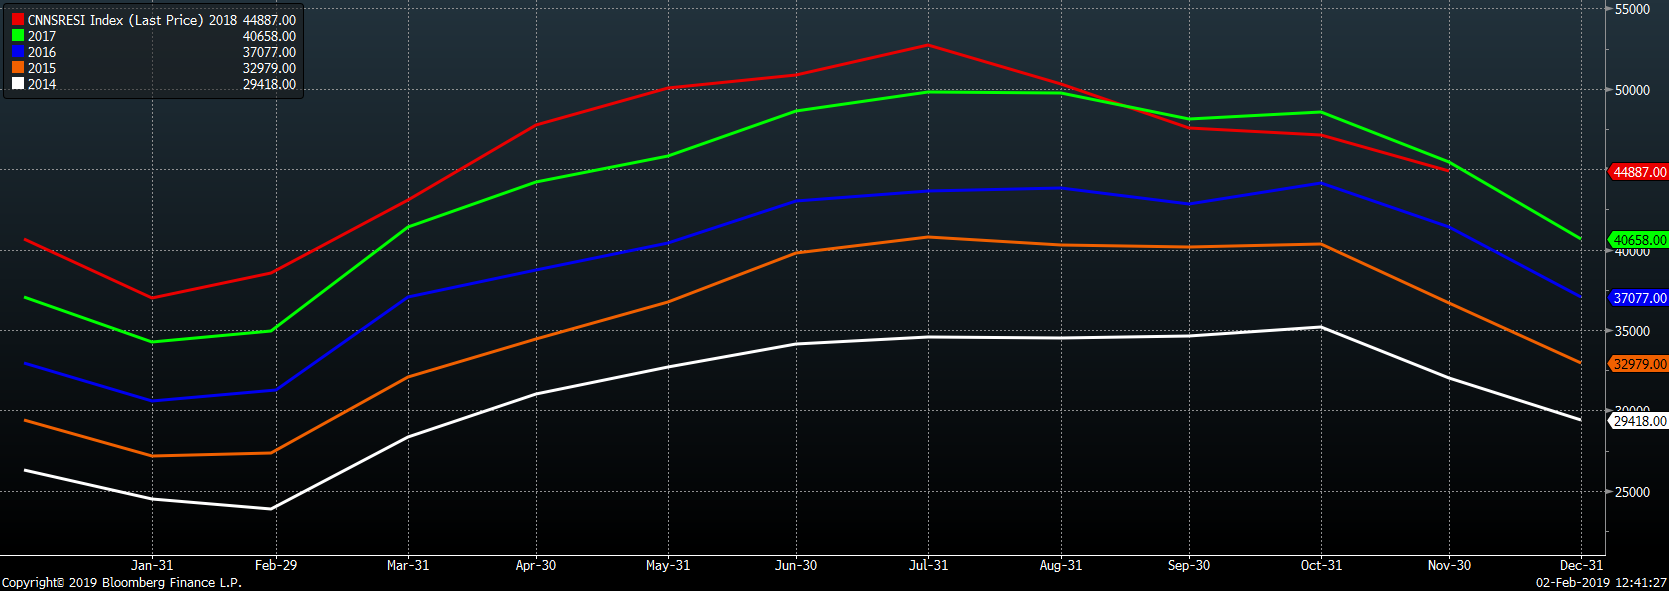
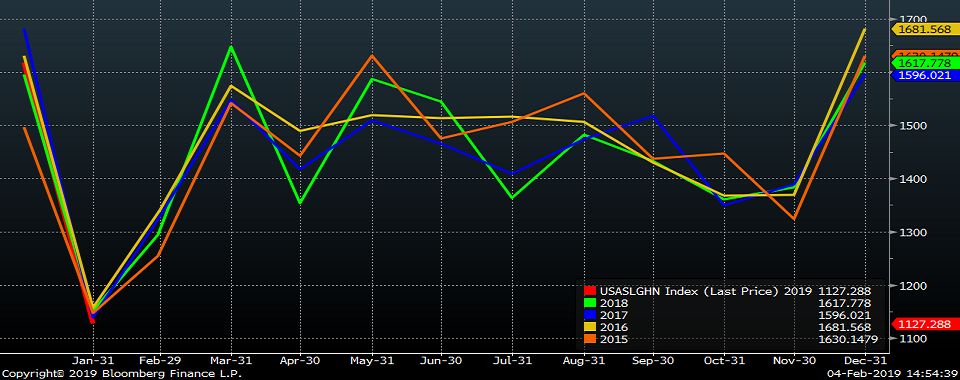
January US light vehicle sales were down to a 16.6m seasonally adjusted annualized rate (S.A.A.R).
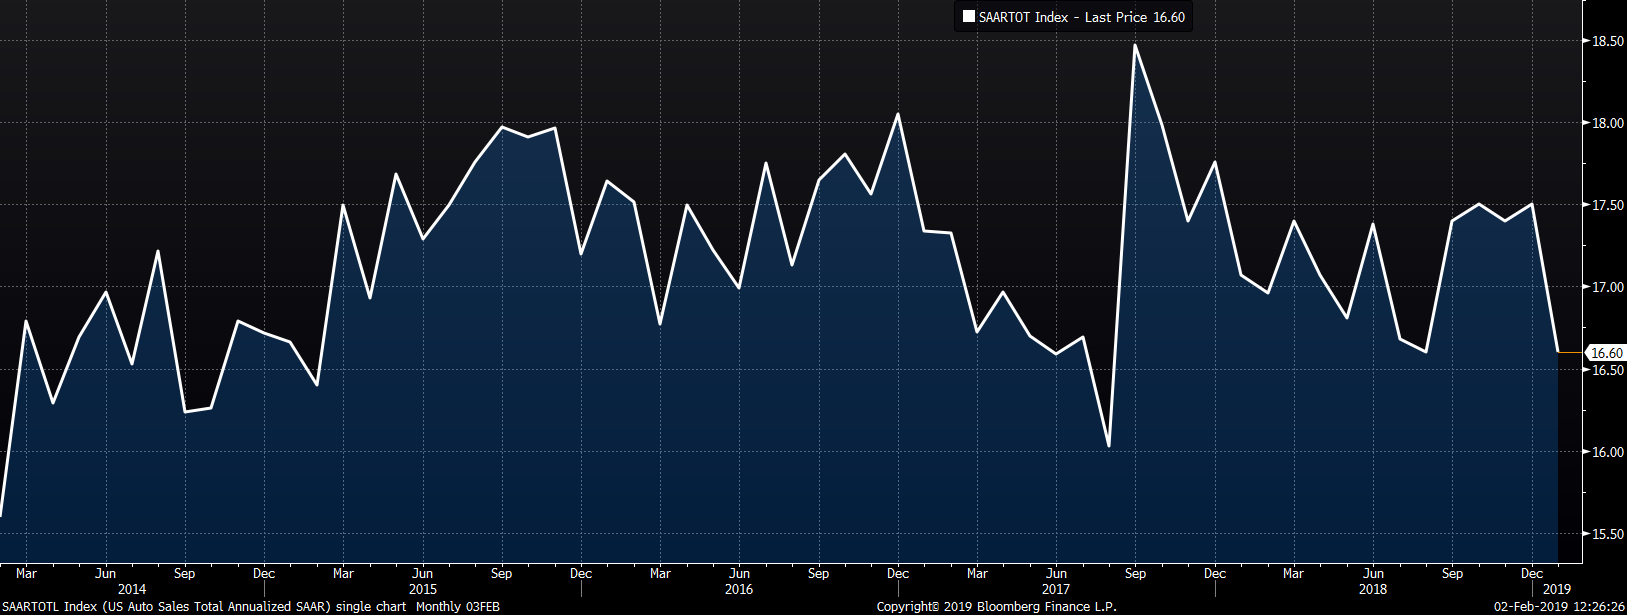
The January U.S. auto sales annualized rate fell 2.8% YoY to its lowest point in the last five years.

January unadjusted monthly auto sales fell to 1.1m units. January is always the lowest sales month of the year, but January 2019 is the lowest sales level since January 2014.
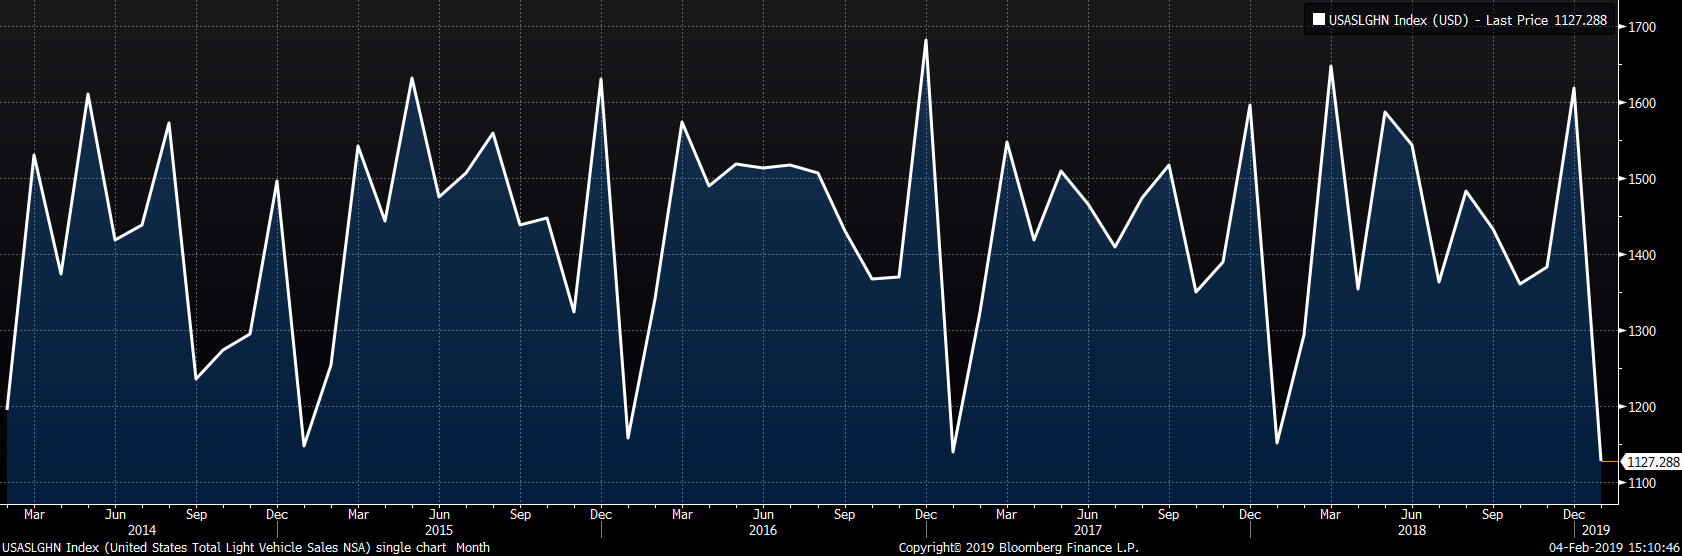
1.1m in light car and truck sales is at the lowest January level of the past five years.
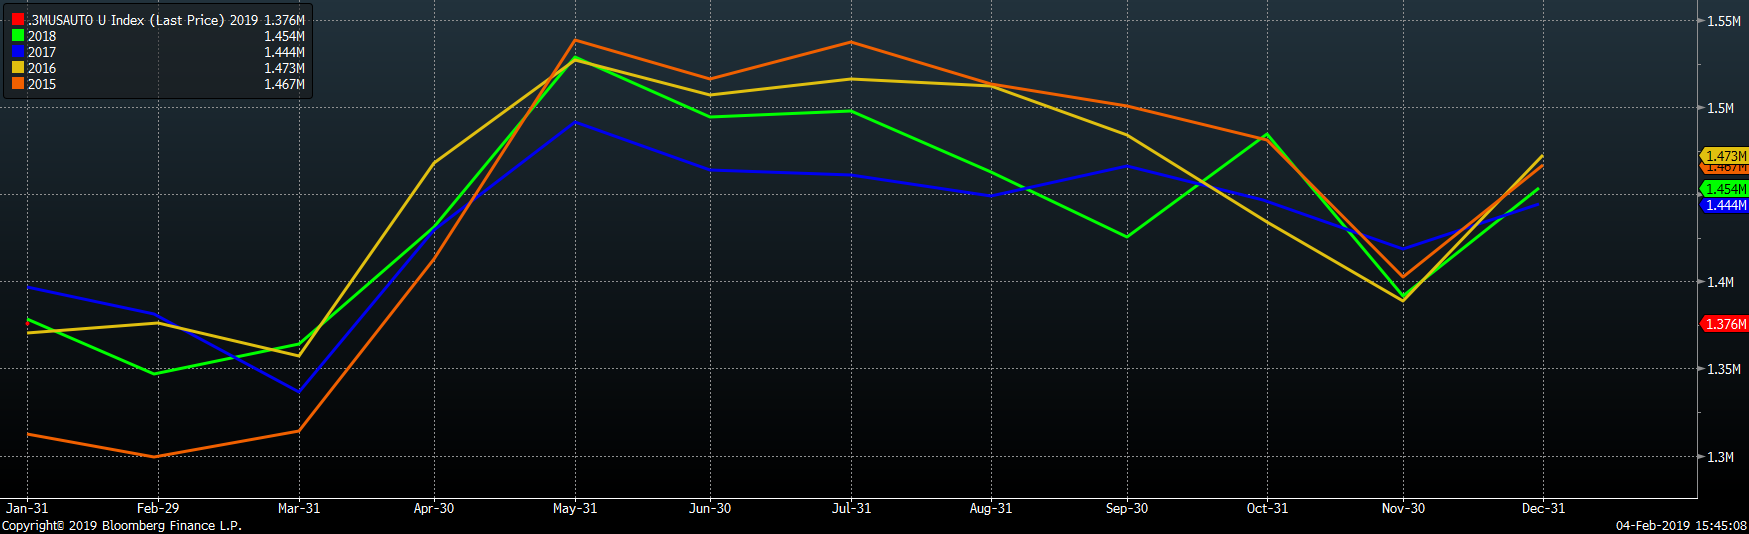
The U.S. monthly auto sales three-month moving average continues to trend lower falling to the lowest the level since last March 2018.
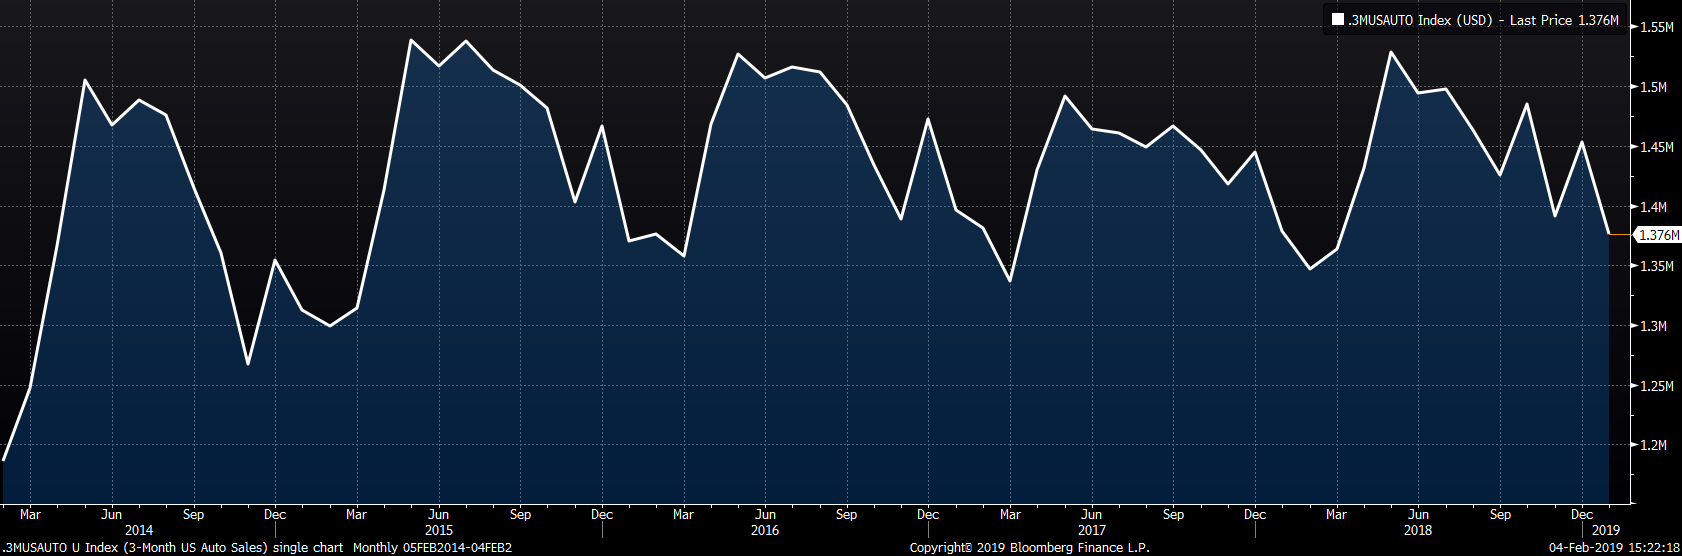
The U.S. monthly auto sales three-month moving average fell to the lowest January level since 2016.
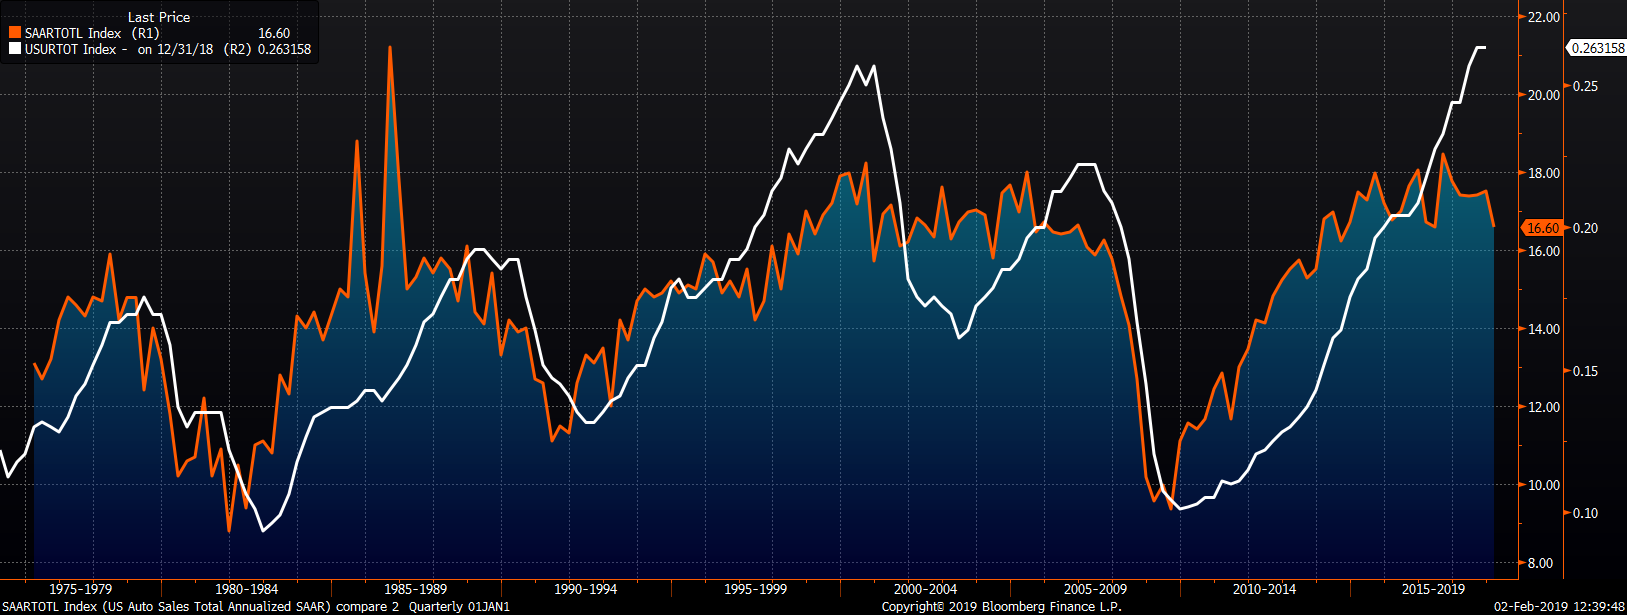
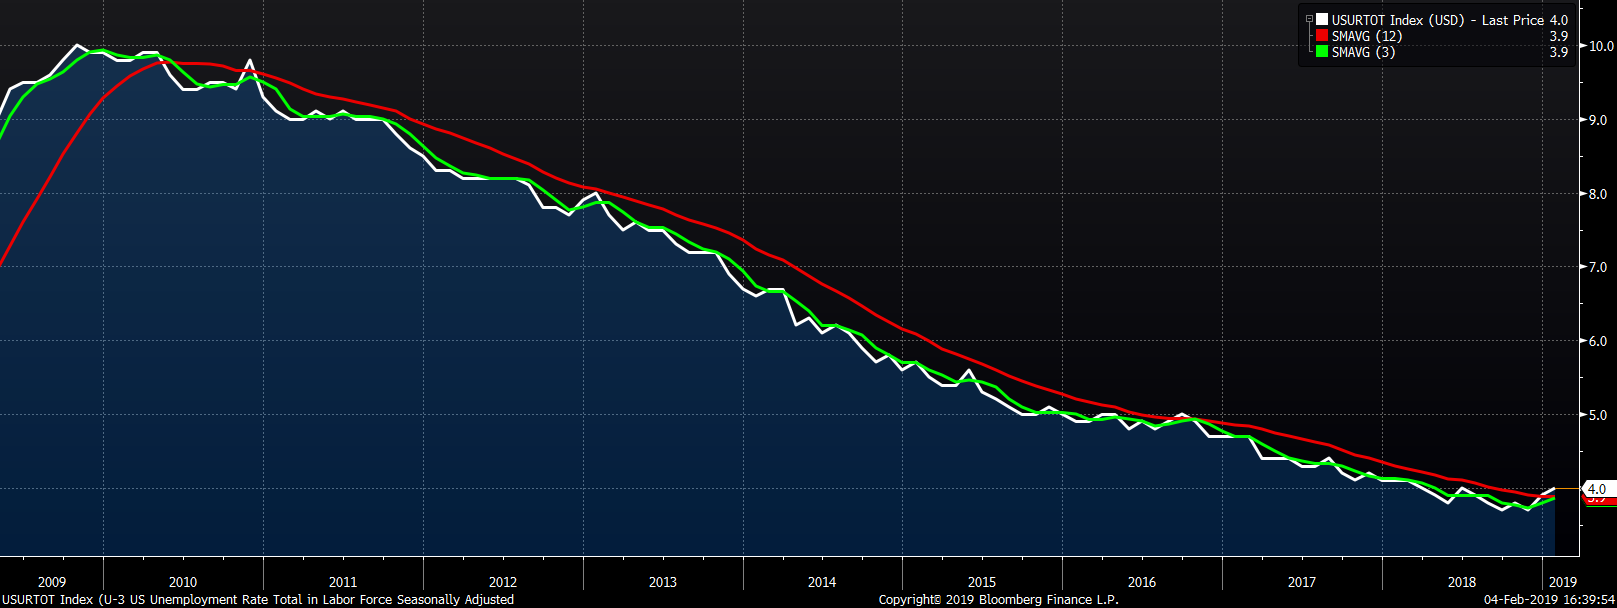
January annualized auto sales continued lower while the U.S. unemployment rate rose to 4.0%, but remains near all-time lows.
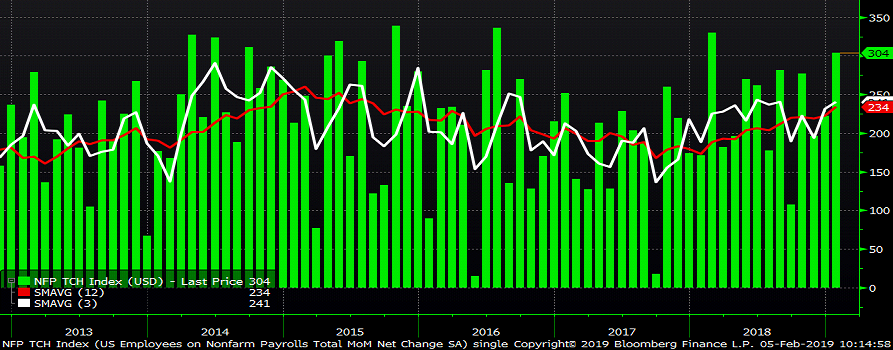
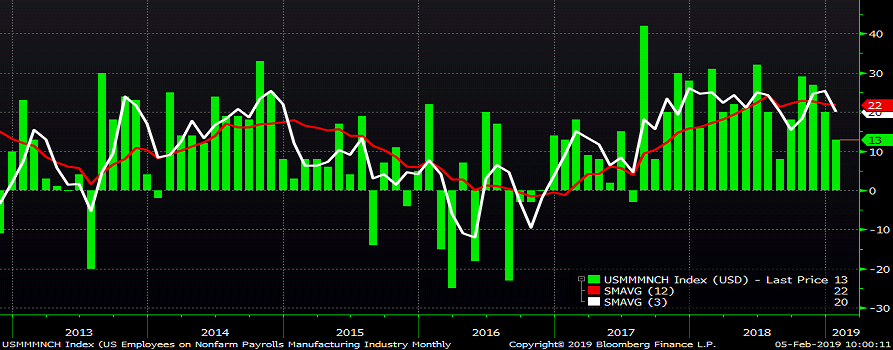
The U.S. employment report saw another upside surprise with a gain of 304k new jobs vs. expectations of a 165k build. However, the labor department revised December’s 312k gain lower to 222k. Manufacturing payrolls gained 13k new jobs, but missed expectations of an increase of 19k jobs. The labor department revised December’s manufacturing payroll gain lower to 20k from 32k. The unemployment rate increased slightly to 4.0% likely due to an increase in the labor participation rate to 63.2%. Average hourly earnings rose less than expected MoM, but were in line with YoY expectations at 3.2%,
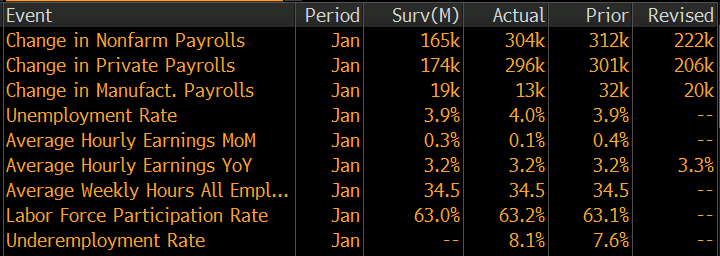
Employment continues to be strong with the U.S. unemployment rate at 4.0%
Upside Risks:
Downside Risks:
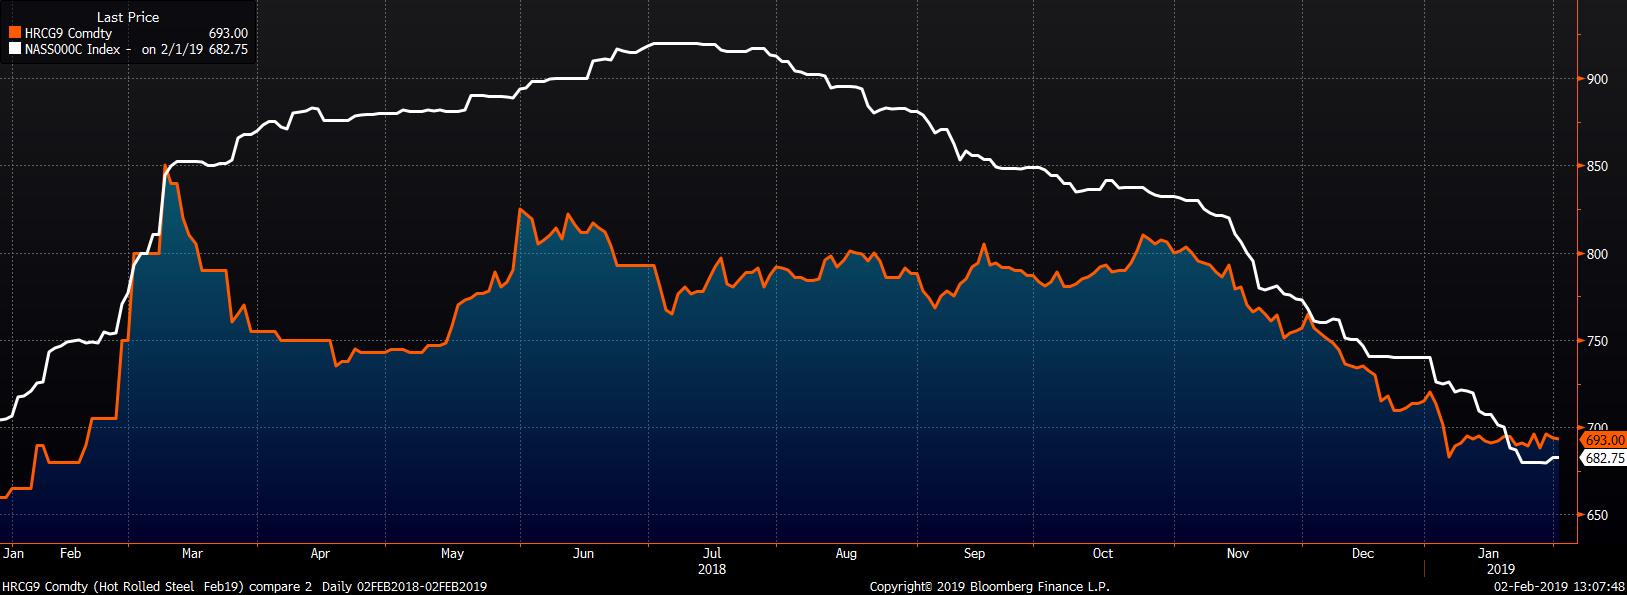
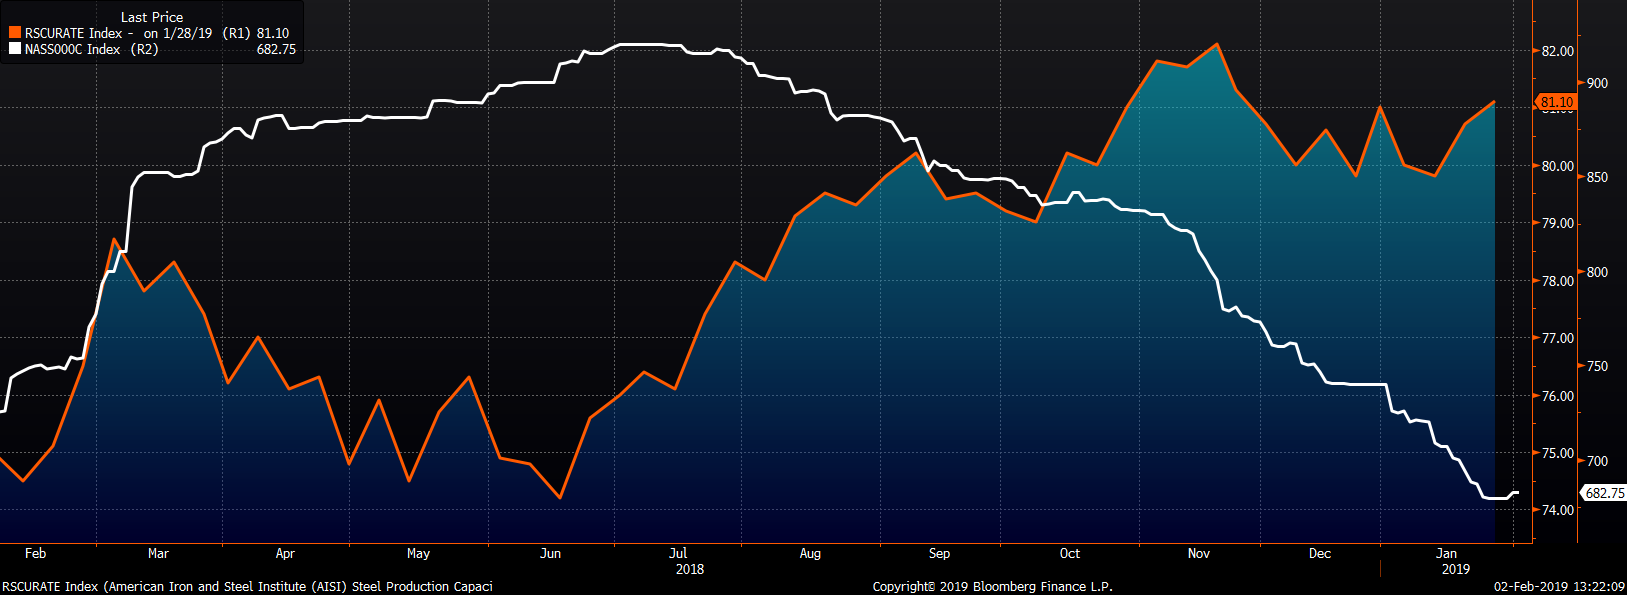
The February CME HRC future rose $4 to $693 while the Platts TSI Daily Midwest HRC Index was up $2.75 to $682.75.
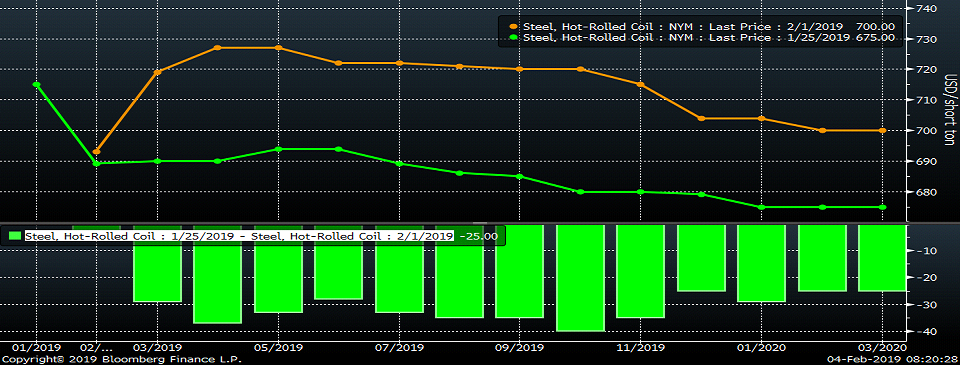
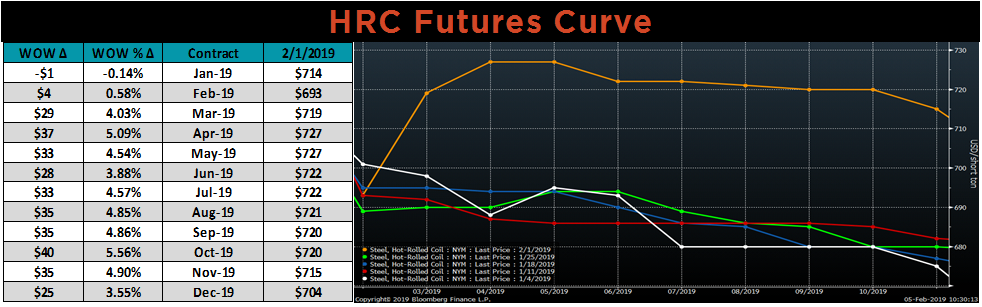
The CME Midwest HRC futures curve is below with last Friday’s settlements in orange.
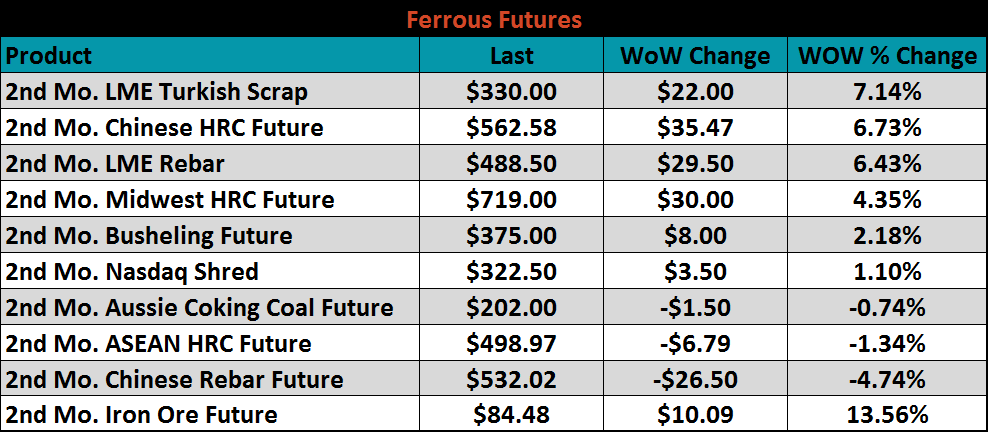
March ferrous futures are listed below. There was a broad based rally led by a 13.6% gain in iron ore.
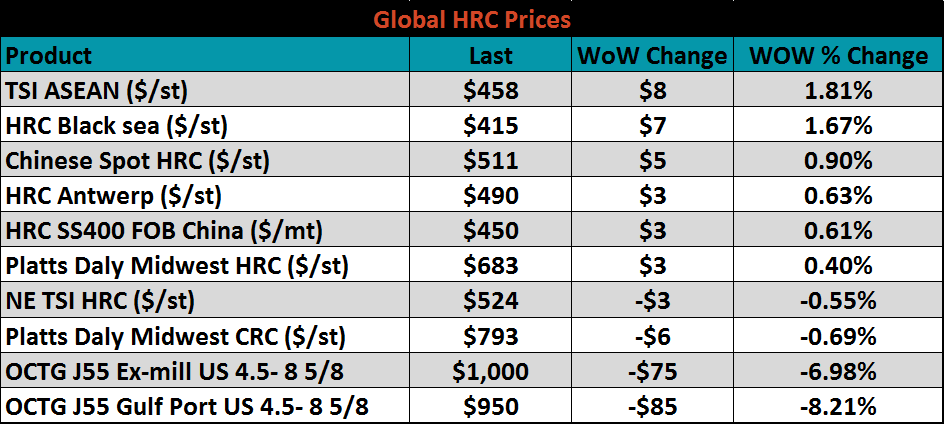
Flat rolled indexes were mixed. OCTG prices moved much lower as discussed above.
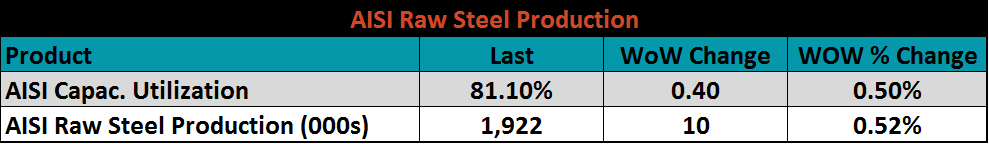
The AISI Capacity Utilization Rate increased to 81.1%.
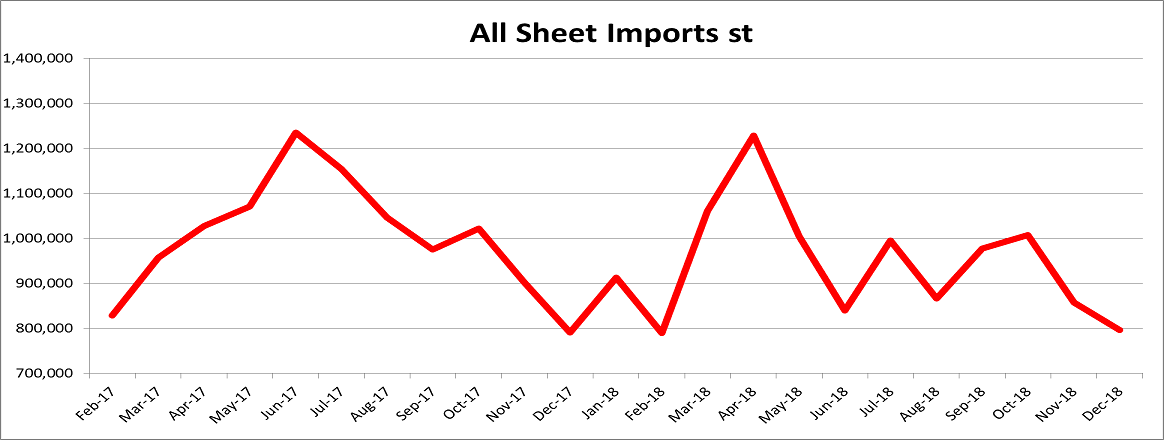
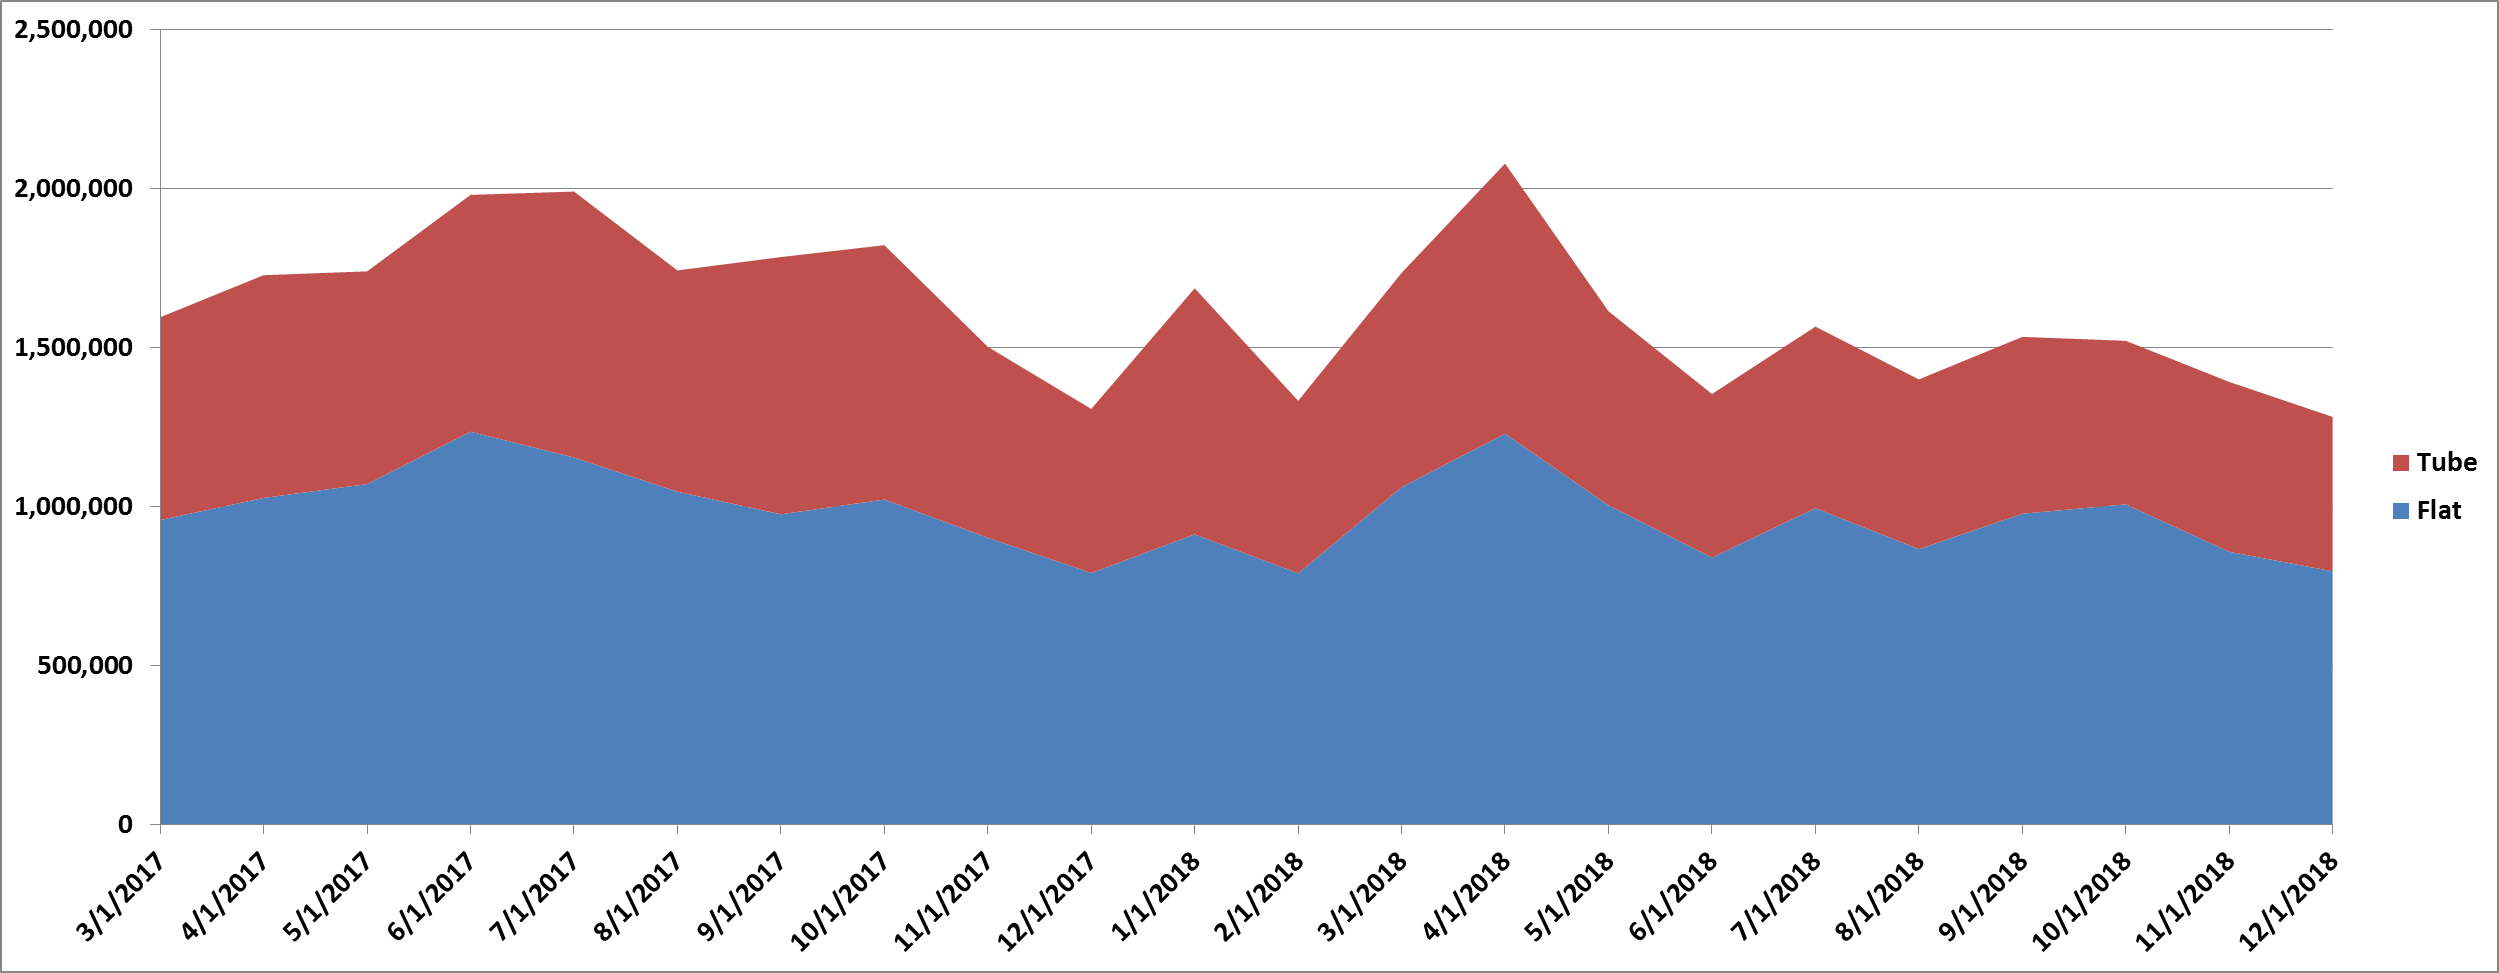
December flat rolled import license data showed a MoM decrease to 790k.
December’s tube import license data showed a MoM decrease to 485k tons.

December’s combined flat rolled and tube import license data continued slightly lower MoM.
December AZ/AL import licenses showed a decrease of 35k tons MoM to 55k.
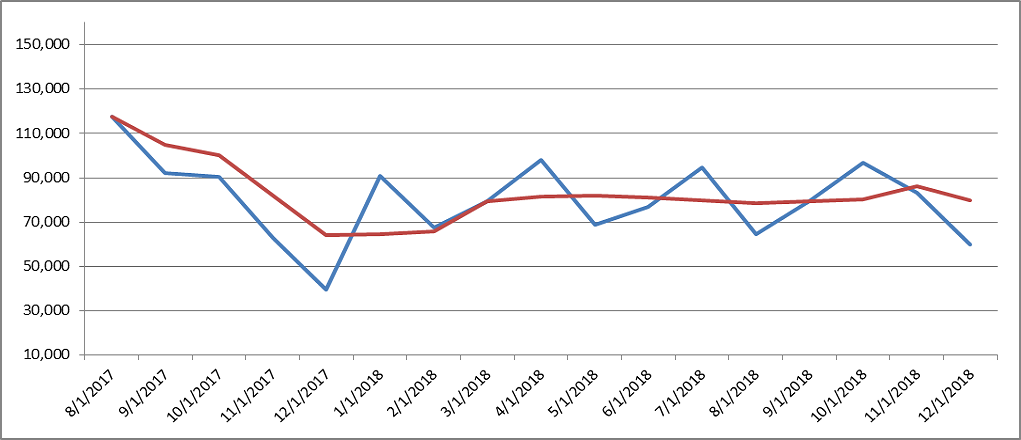
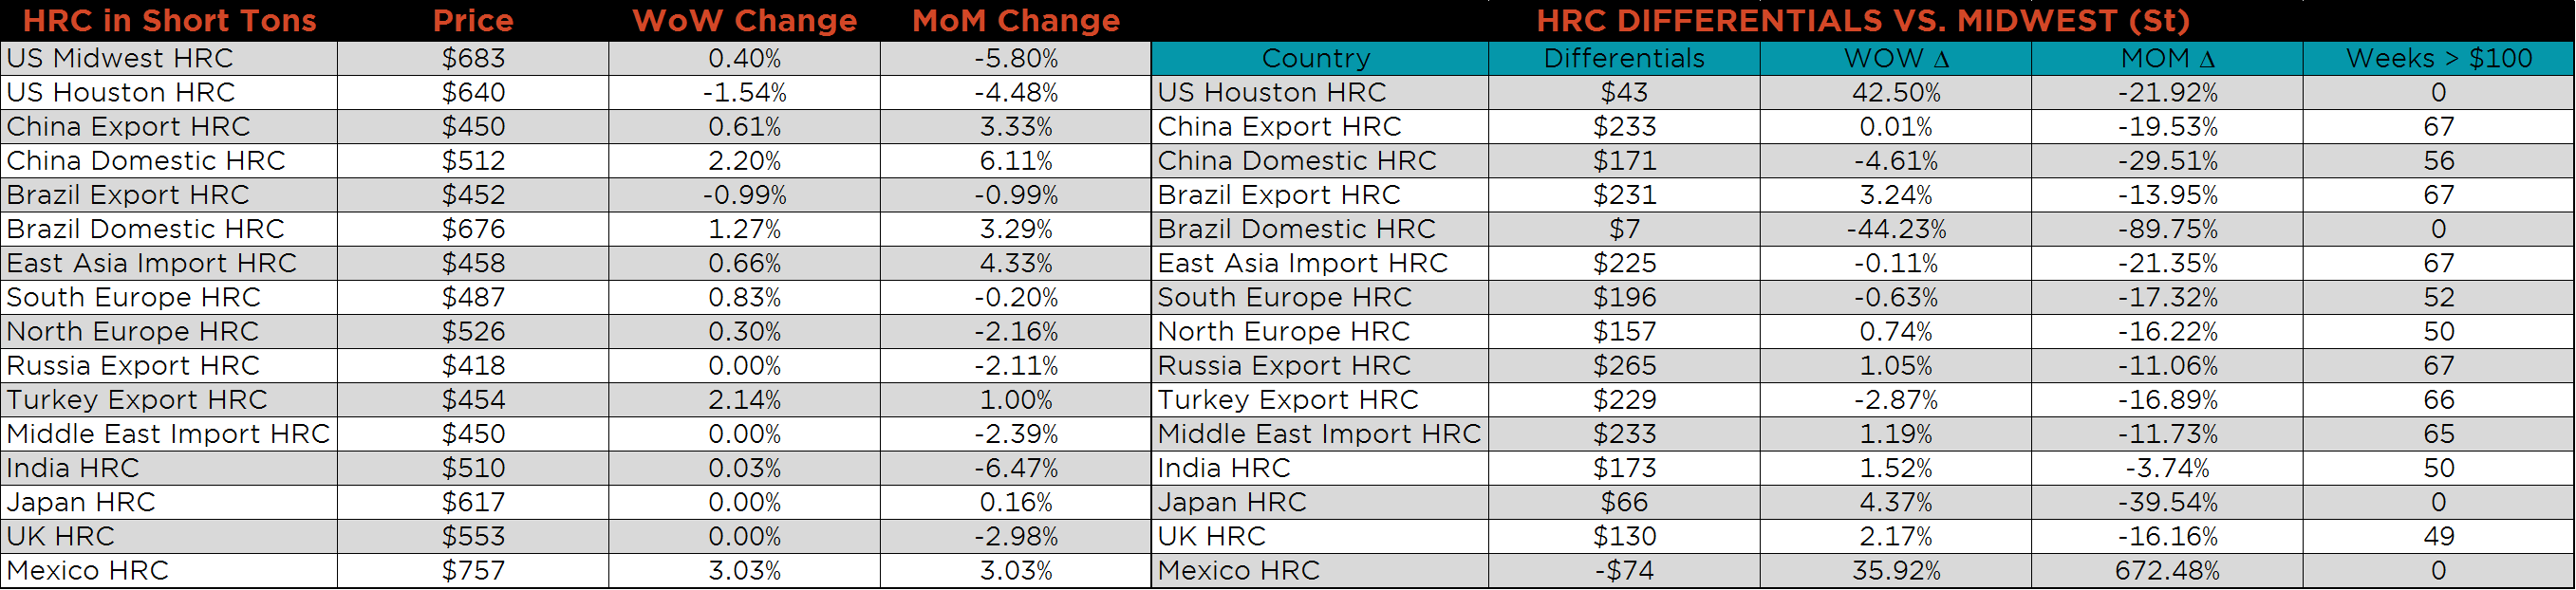
Below are HRC and CRC Midwest vs. each country’s export price differentials using pricing from SBB Platts. Both HRC and CRC are down WoW. Platts Chinese export prices have not rallied along with Chinese domestic spot tons, however export prices out of Asia have firmed up in recent weeks so this chart might not reflect the reality that the differentials between the U.S. price and Asian price has been converging noticeably. This is one area of strength for a bullish HRC case.

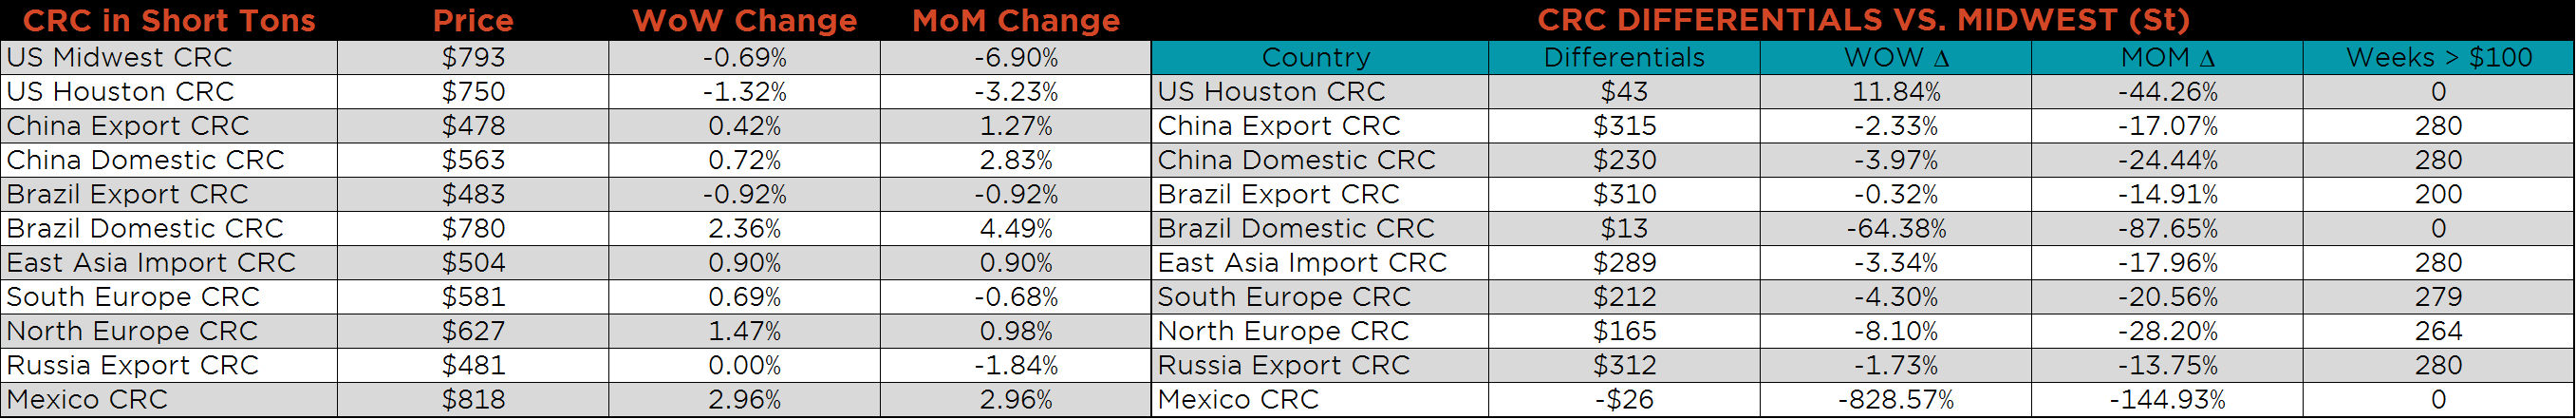
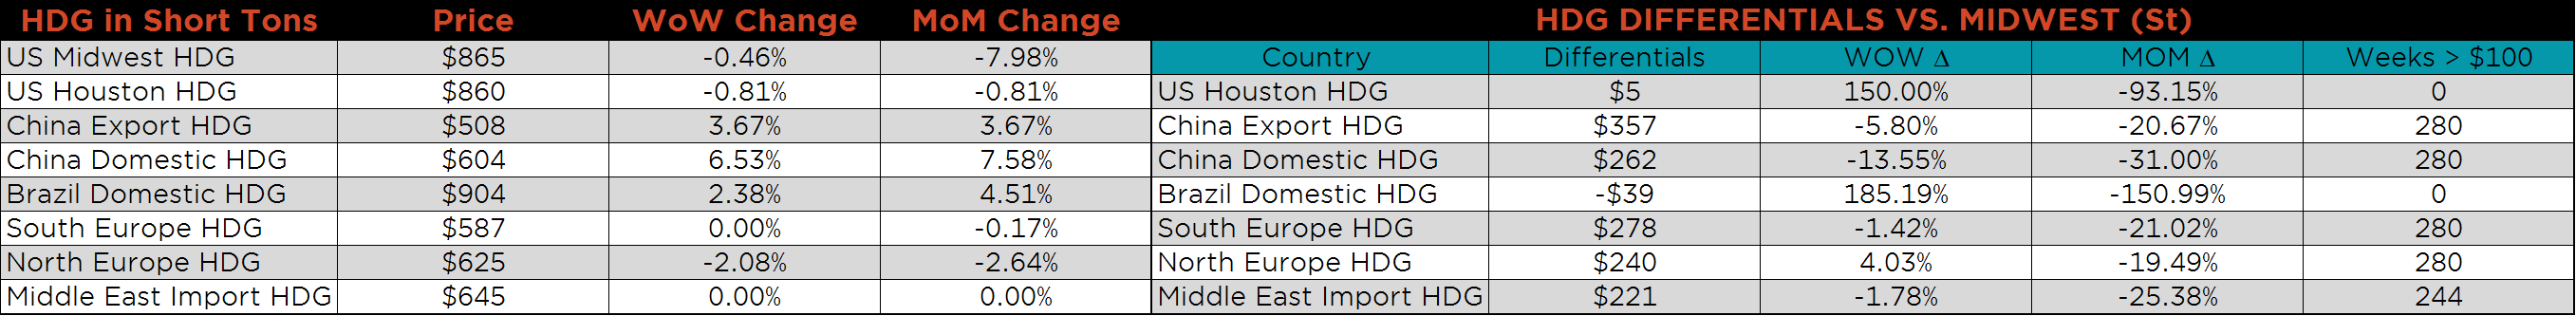
SBB Platt’s HRC, CRC and HDG WoW pricing is below. The U.S. Midwest prices saw little changes. The Mexico HRC price was up 3% while Chinese Domestic price was up 2.2%. The Mexico CRC and Brazilian domestic CRC prices were up 3% and 2.4%, respectively. The Chinese domestic HDG price was up 6.5% while their export price was up 3.7%.
Listed below are ferrous raw materials WoW price changes. Iron ore prices were up massively and carried scrap higher with it.
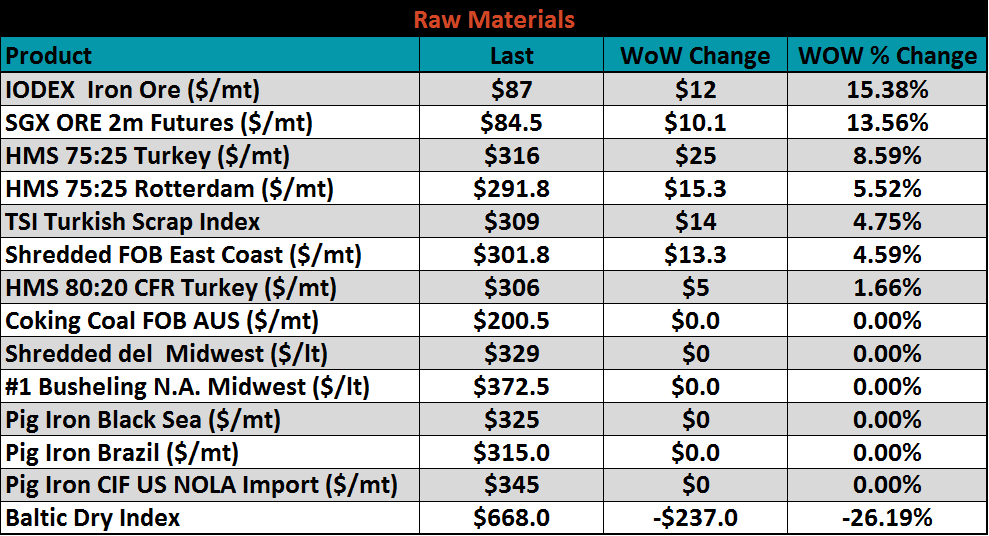
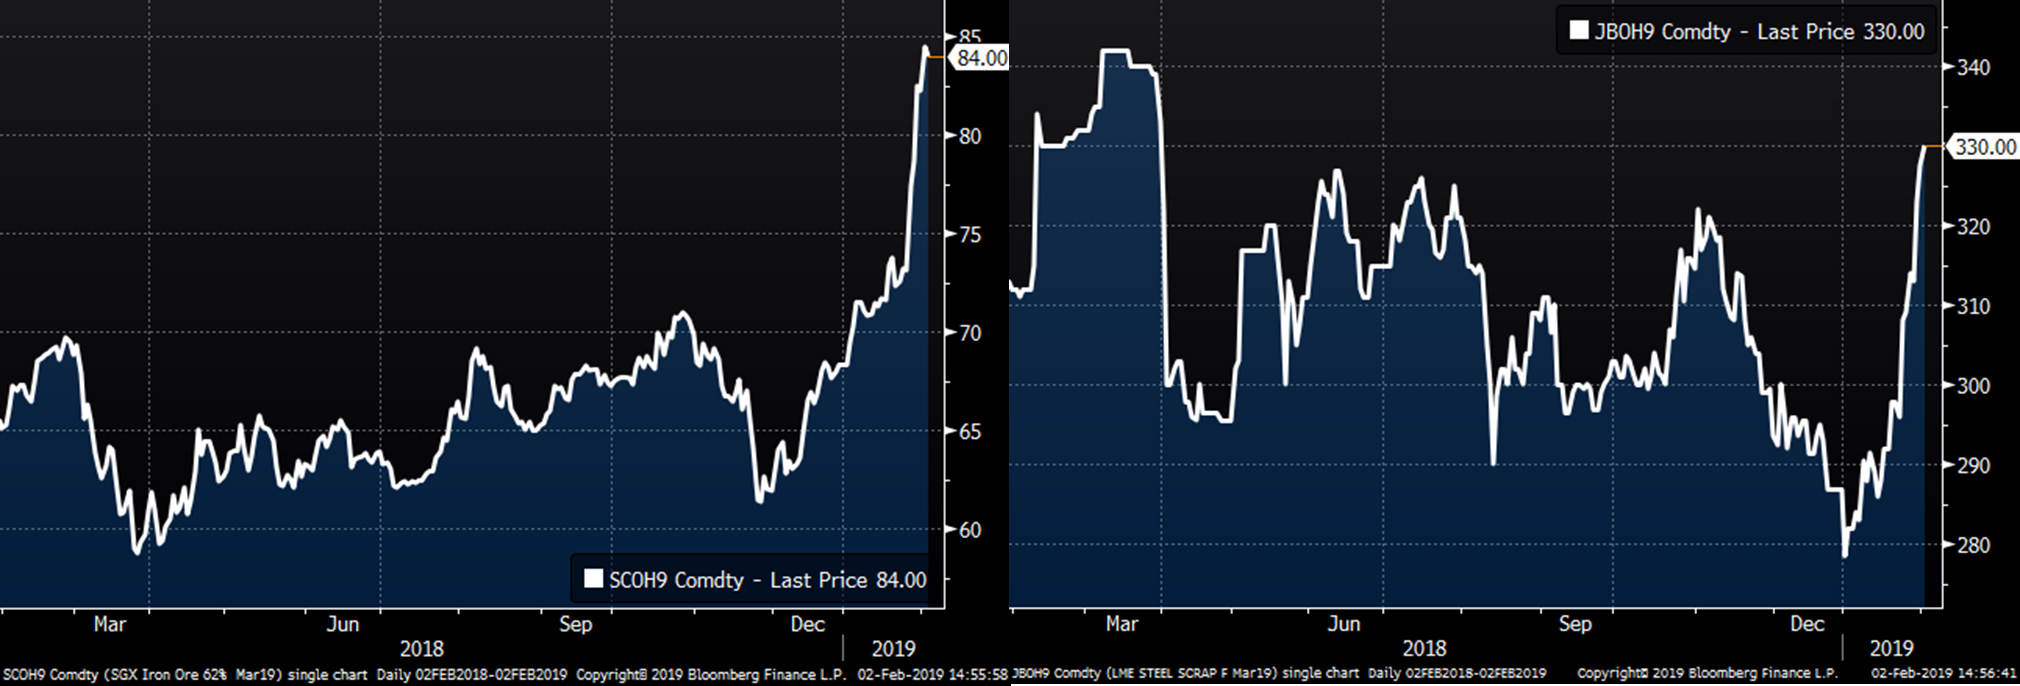
The March SGX iron ore future was up $11.40 to $84.48 while the March Turkish scrap future gained $21 to $330.00.
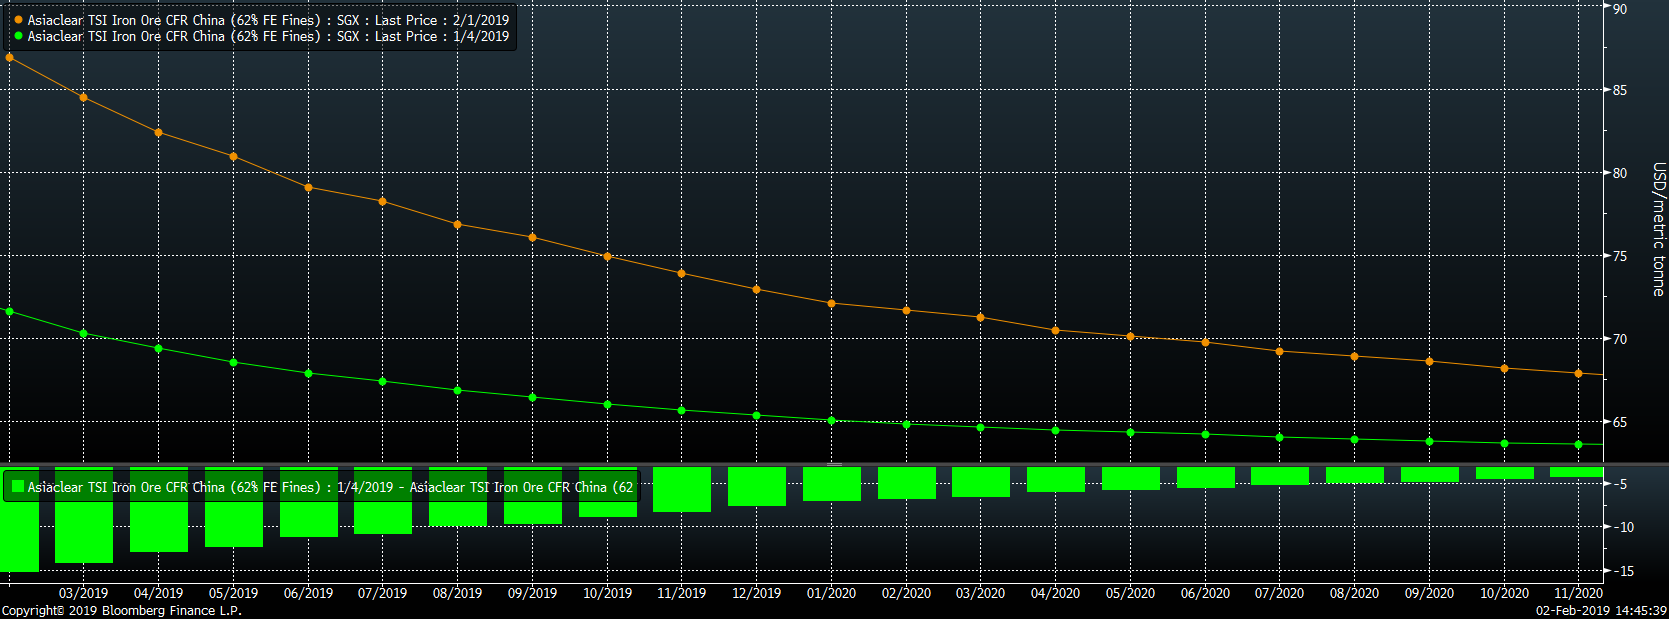
The SGX iron ore futures curve has rallied significantly with the front of the curve opening up big before converging with later dated futures over the past month.
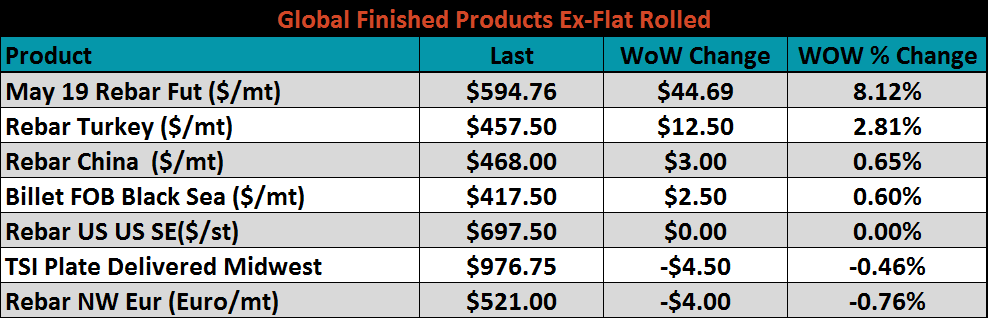
Ex-flat rolled prices shown below. Rebar saw nice gains with the May Shanghai rebar future up 8.1% and Turkish rebar gaining almost 3%.
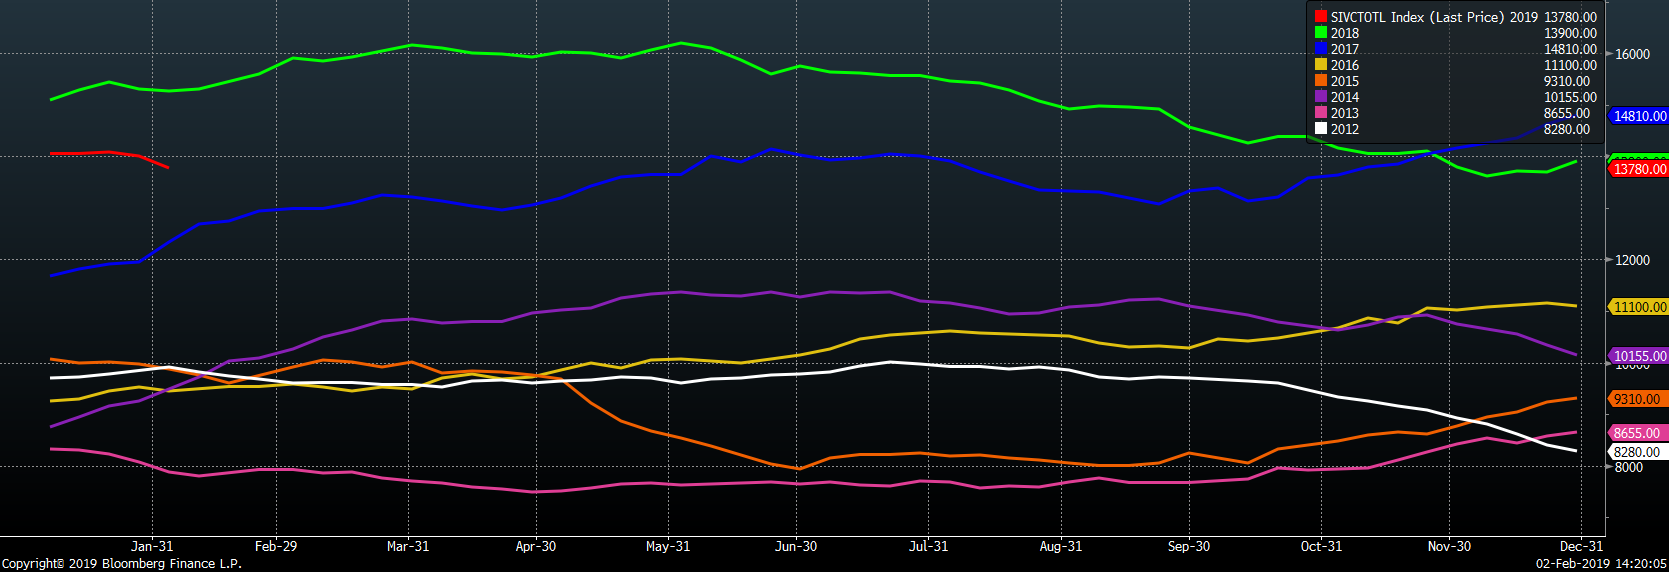
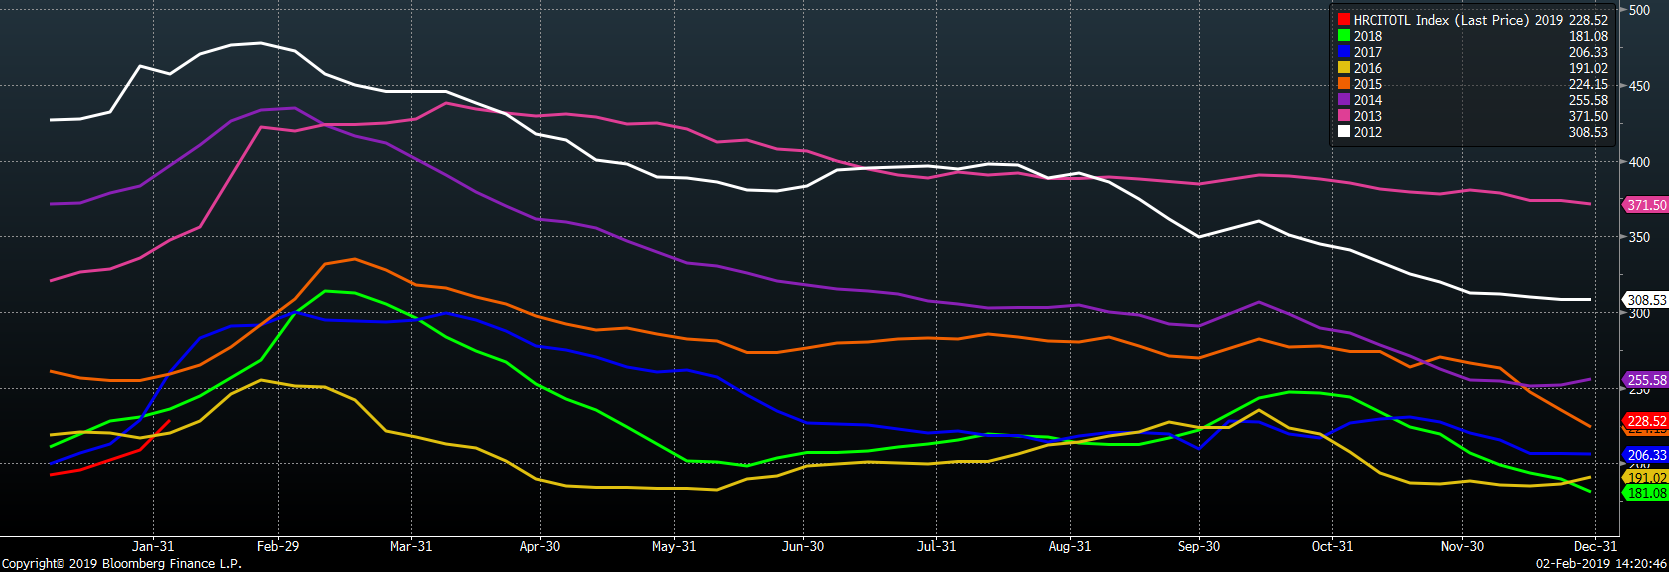
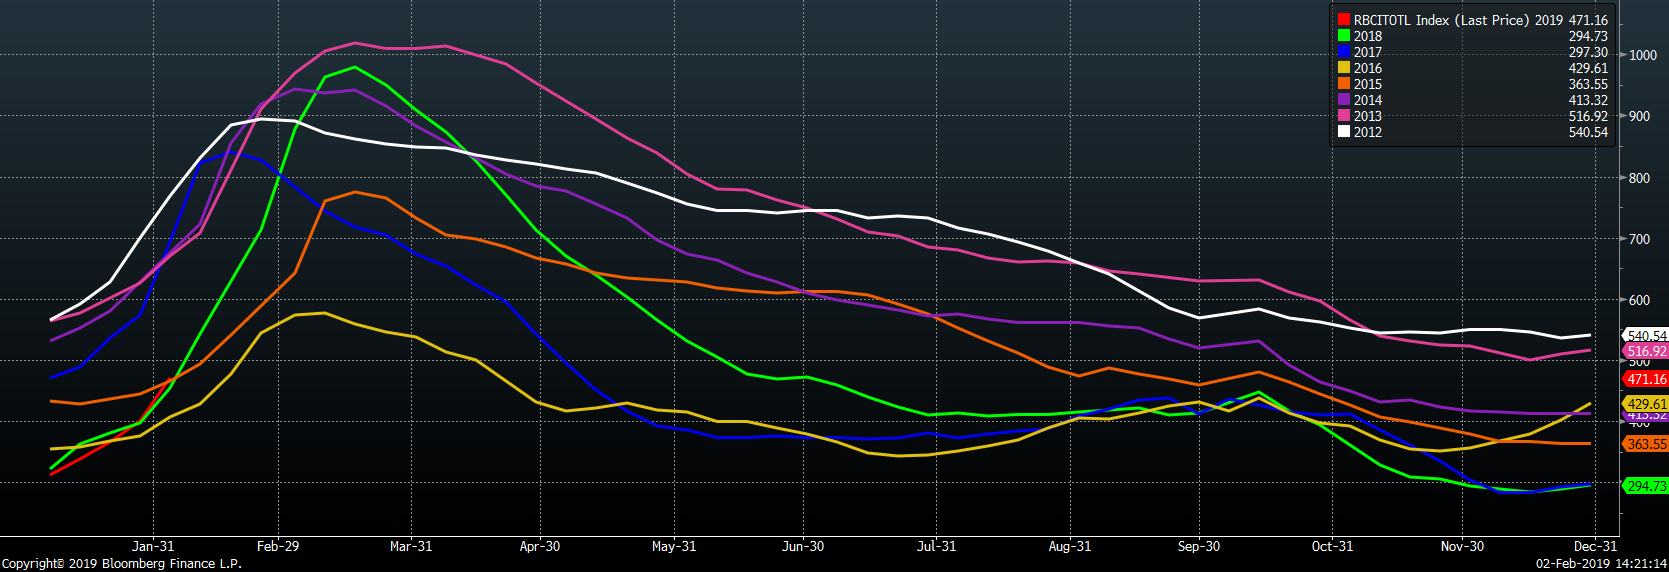
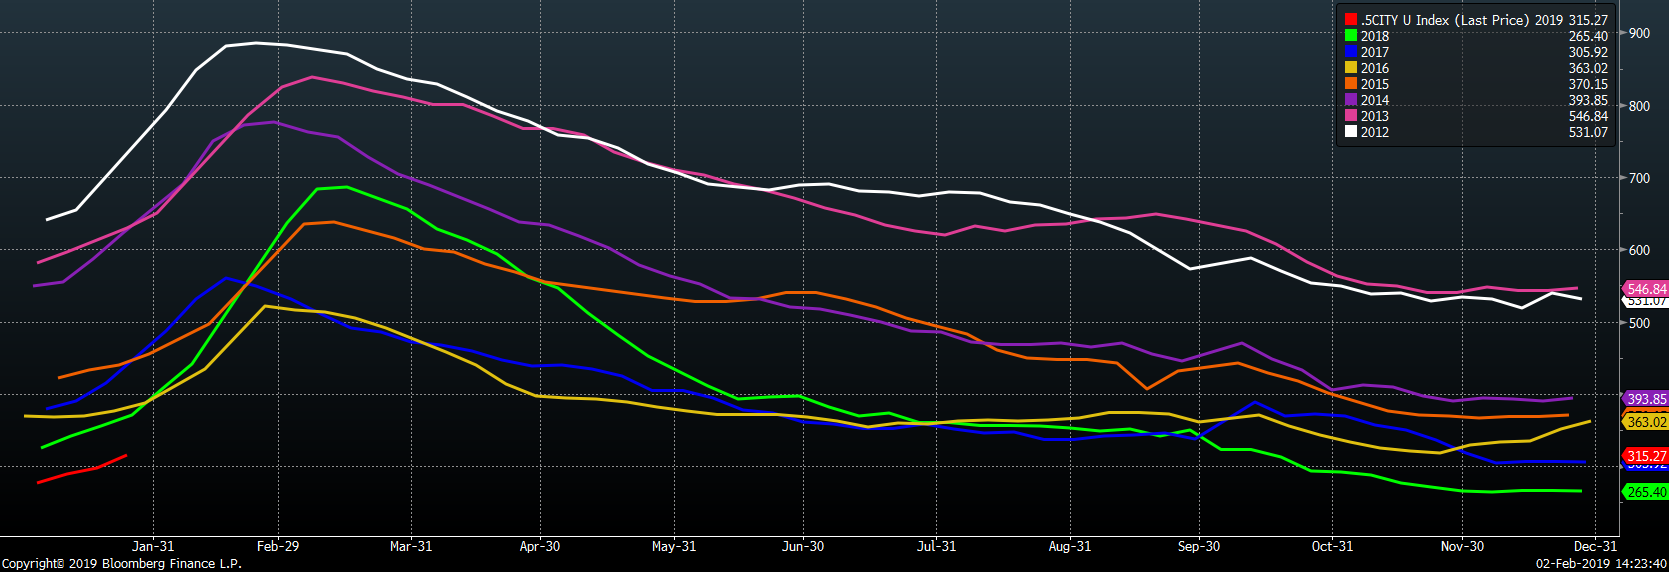
Below are inventory levels for Chinese finished steel products and iron ore. Chinese rebar and HRC inventory rose 17.6% and 9.5%, respectively, while iron ore inventory fell. The 5-City inventory level was not updated.


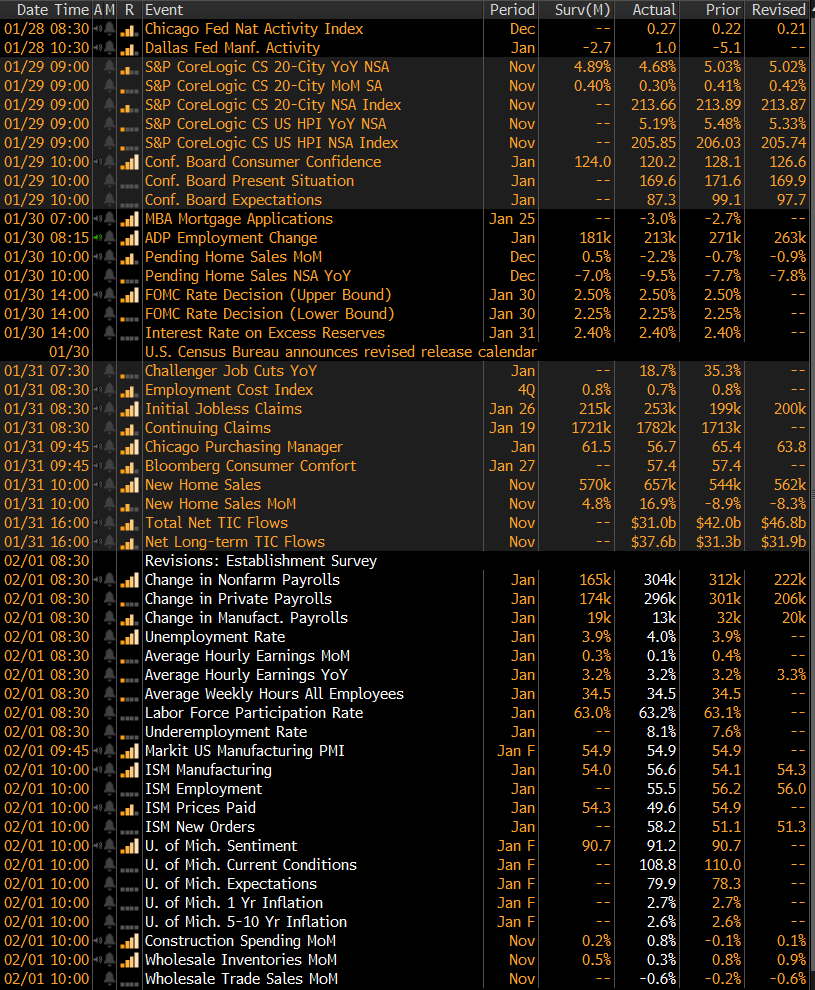
Last week’s economic data is to the right. The regional manufacturing indexes were discussed above. The November Case Shiller 20-City Home Price Index saw YoY gains of 4.68%, down from October and below expectations. November New Home Sales increased to a 657k annualized rate and above expecataions of a 570k annualized rate. November Pending Home Sales fell 2.2% vs. expectations of a 0.5% increase.
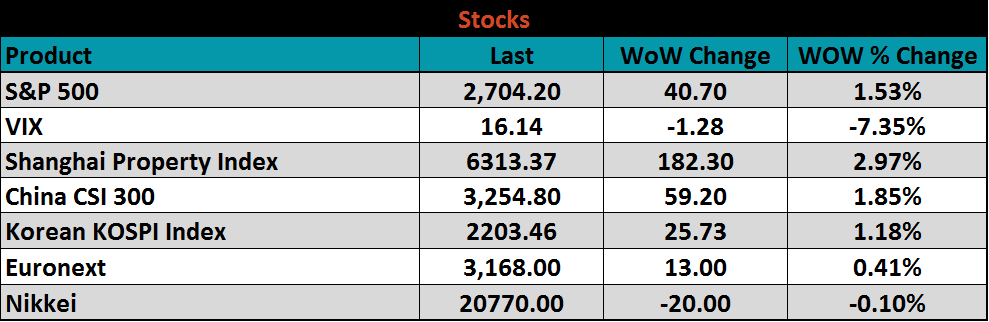
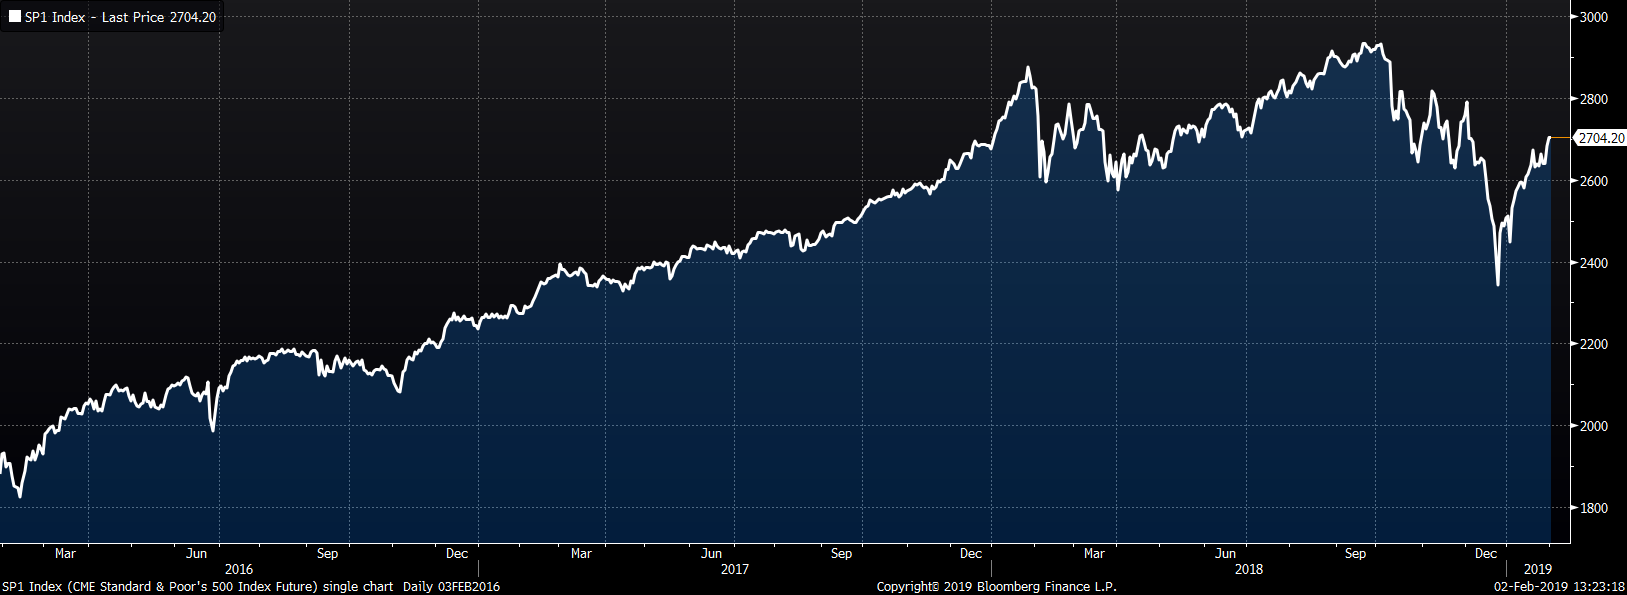
The S&P 500 was up 1.5% while the VIX fell. Markets in Asia saw gains except for Japan.
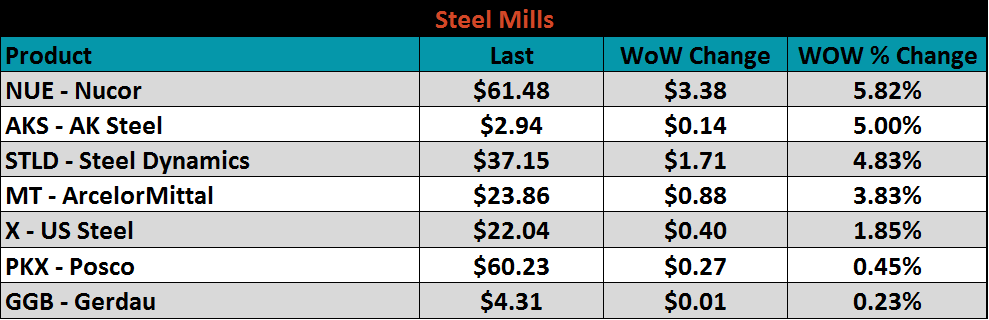
Steel mill stocks were all higher as AK, Nucor and U.S. Steel announced earnings.
Service center stock’s weekly performances were mostly higher.

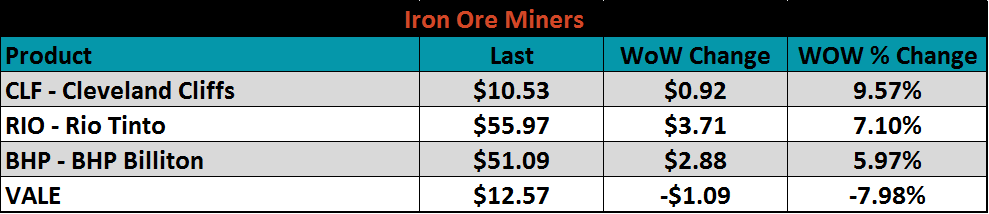
Mining’s stocks were mostly higher along with the sharp rally in ore, much of which was due to Vale’s production slowed by the damage caused by last week’s dam break in Brazil. Vale’s stock was under pressure in response.

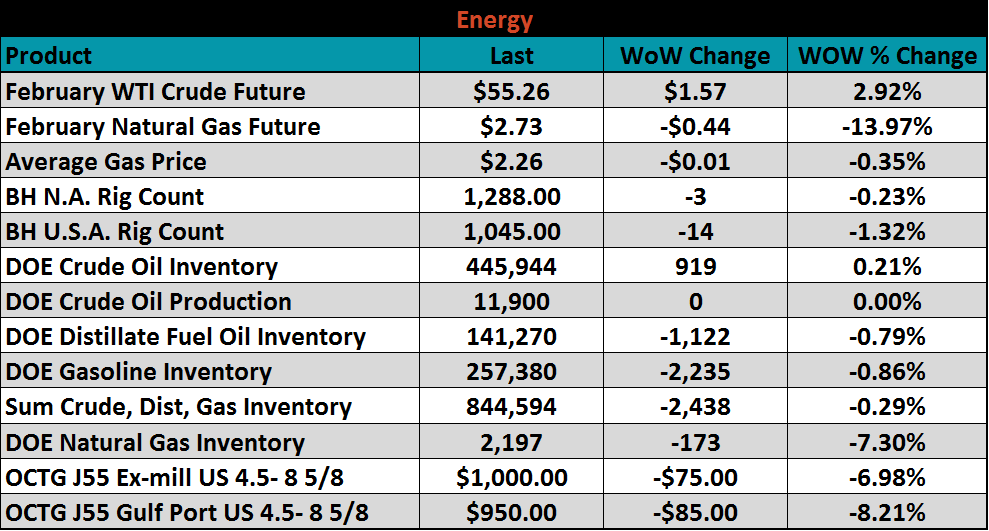
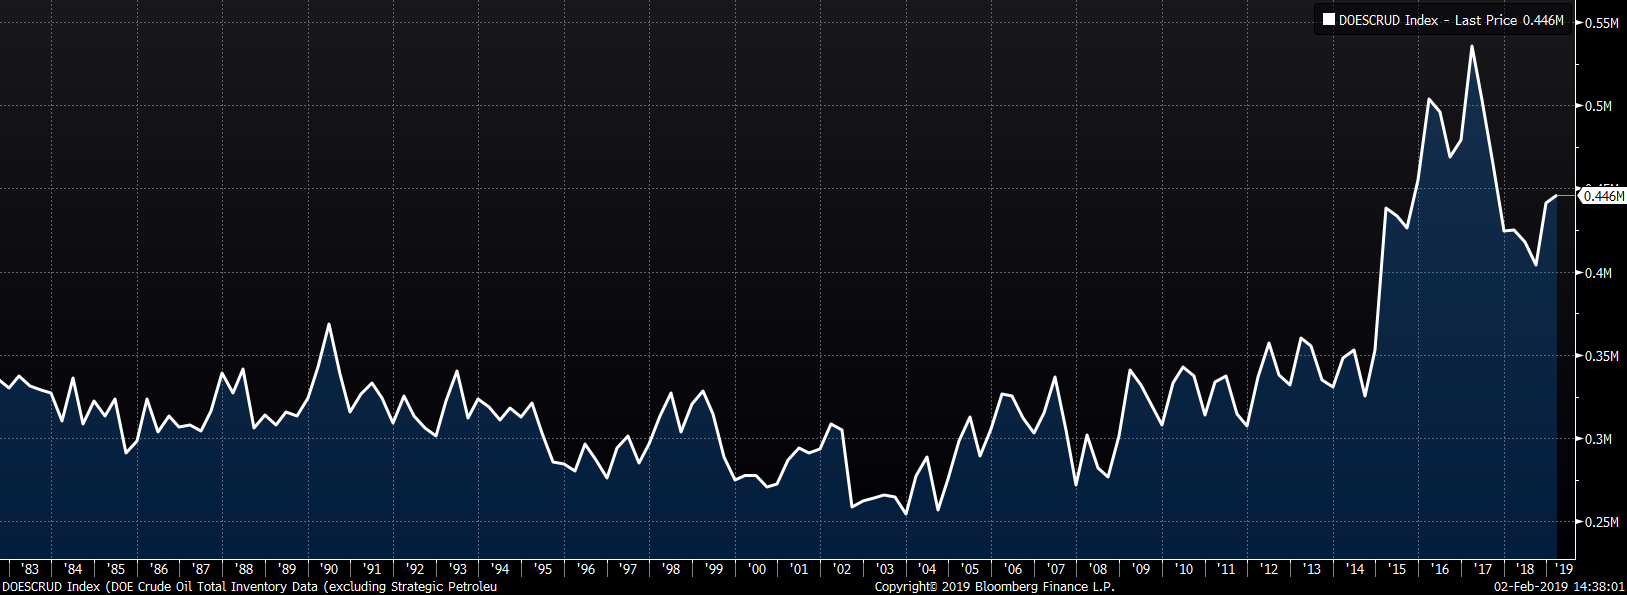
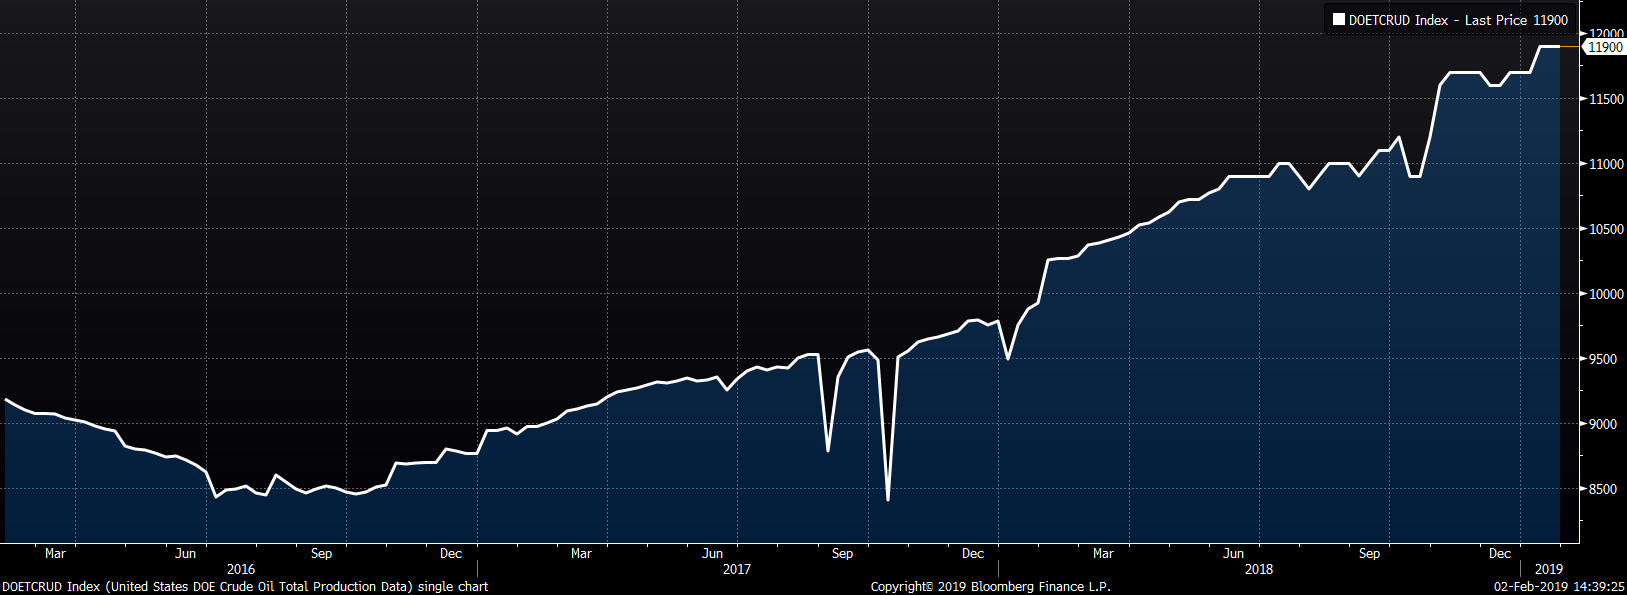
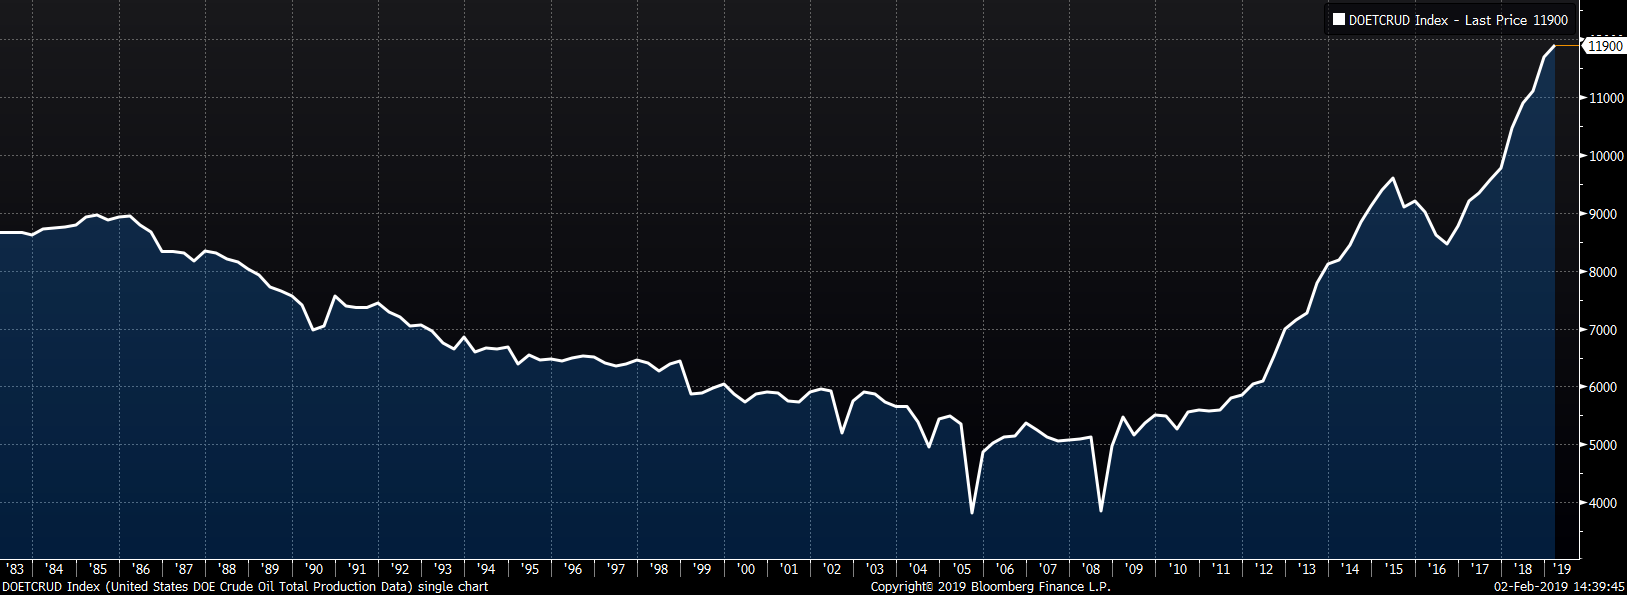
The March WTI crude oil future gained $1.57 or 2.9% to $55.26/bbl. Crude oil inventory was up 0.2%, while the gasoline and distillate inventories fell 0.9% and 0.8%, respectively. The aggregate inventory level was down 0.3%. Crude oil production remains at 11.9m bbl/day. The U.S. rig count cut 14 rigs while the North American rig count cut three rigs. The March natural gas future lost $0.44 or 14% to $2.73/mmBtu. Natural gas inventory fell 7.3%.

The list below details some upside and downside risks relevant to the steel industry. The orange ones are occurring or look to be highly likely.
Upside Risks:
Downside Risks: