Content
-
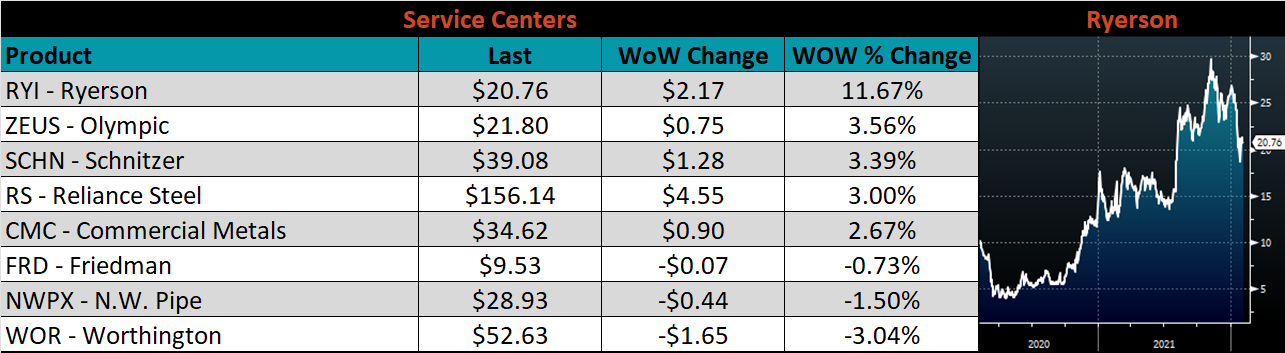
Weekly Highlights
- Market Commentary
- Upside & Downside Risks


The broader steel market continues to grapple with the counteracting forces of a strong demand outlook, and more than enough material to meet the current need. Excess inventory will remain the headline and supersede all other dynamics within the market until it is resolved, the same way the steel shortage drove the market last year. On the other hand, buyers have begun sticking their heads out of the ground. Inquiries for new material are increasing, and this shift is causing domestic producers to start pushing back in negotiations. Currently, lead times remain at their minimums and most inquiries do not make it past the quoting stage. However, as inventories start to dip and lead times push out, domestic producers will push price announcements in increments the market has never seen. This becomes especially likely when we take a step back and see what is happening with global prices. Buyers who took themselves out of the market when prices started to decline in September will enter a market that is dramatically different. As it stands, global prices pushed higher for the 4th week in a row, led by Southeast Asian prices. Imports, which were anticipated to be higher in 1Q22 than in 4Q21, are on pace to be 10% lower. The point is, while we have not found the bottom and prices are anticipated to continue falling, most of this price correction has already occurred. The downside risks contributed to this decline are being resolved and upside risks at the current curve prices should begin garnering attention.
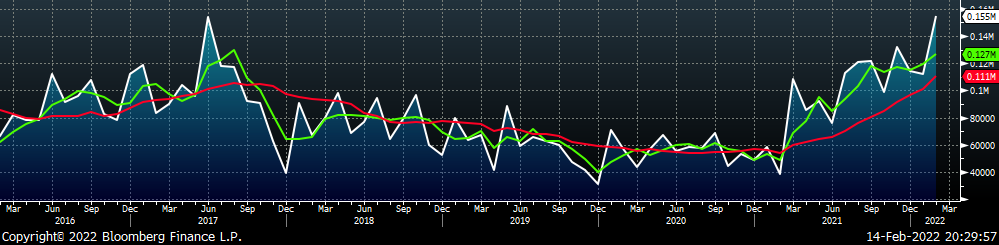
The chart below is a breakdown of the monthly purchases of flat rolled steel within the domestic market from either mills (orange) or imports (blue), with the dashed line representing the 3-month moving average. A higher percentage of import buys reflects decreased pricing power for domestic mills.
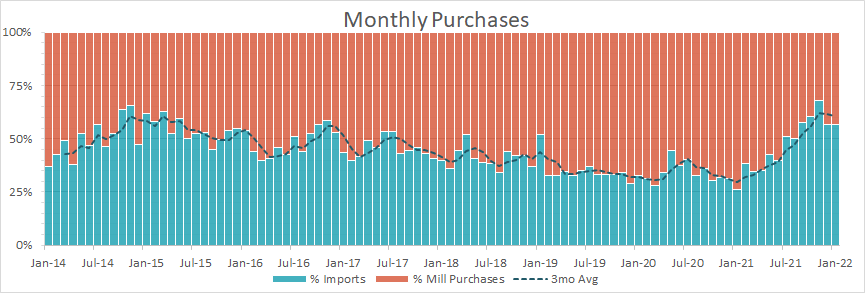
While levels for December and January are still historically elevated the current data suggests November was the point when imports had that most significant impact on pricing. While it is too early to tell, preliminary import numbers for February are down, which suggest we will see the share of imports take another step lower once this month is over. The slowdown in imports could be in part due to the recently resolved trucking/logistics problems happening at the Canadian border. After all, Canada and Mexico were responsible for nearly half of the flat rolled imports arriving in the U.S. over that last year. However, the loss of momentum in arrivals started late last year, not in February. An important question that gets to the heart of how low the domestic price will go, is how many import orders were placed for Q2 delivery, and at what price. Current orders from the global market are for June/July delivery, and as we mentioned earlier, those prices are rising, which we believe will provide support moving into Q2 as inventory continues to be consumed.
Below are the most pertinent upside and downside price risks:
Upside Risks:
Downside Risks:
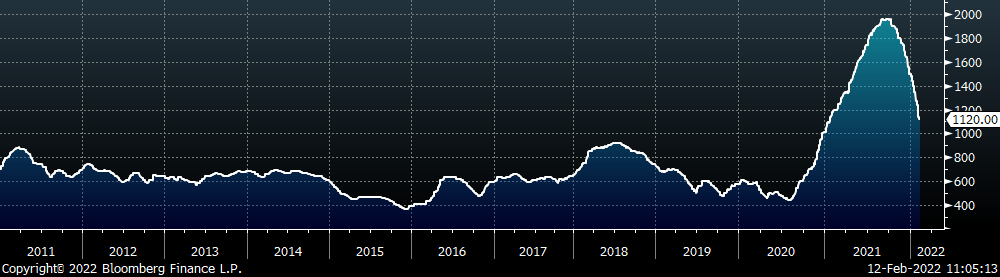
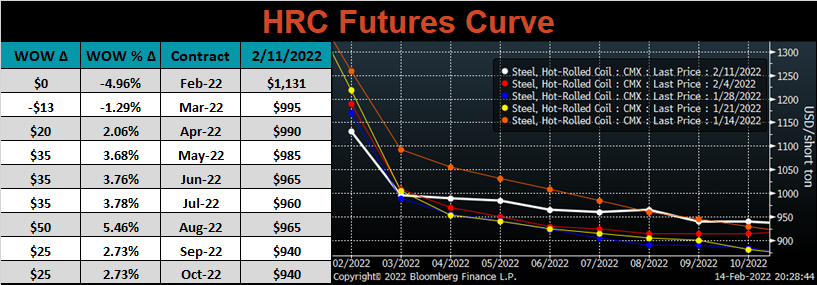
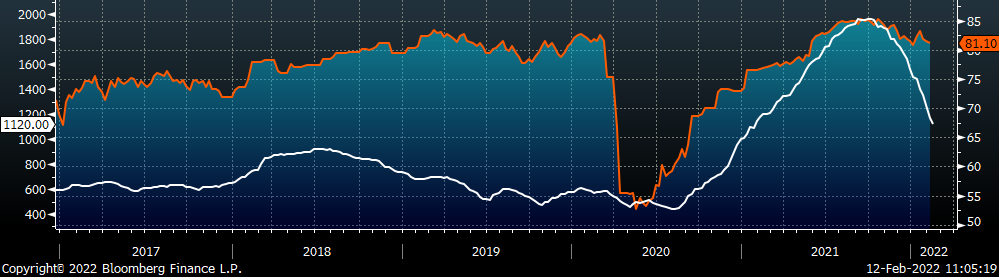
The Platts TSI Daily Midwest HRC Index decreased by another $50 to $1,120.
The CME Midwest HRC futures curve is below with last Friday’s settlements in white. The entire curve printed higher, most significantly in the back.
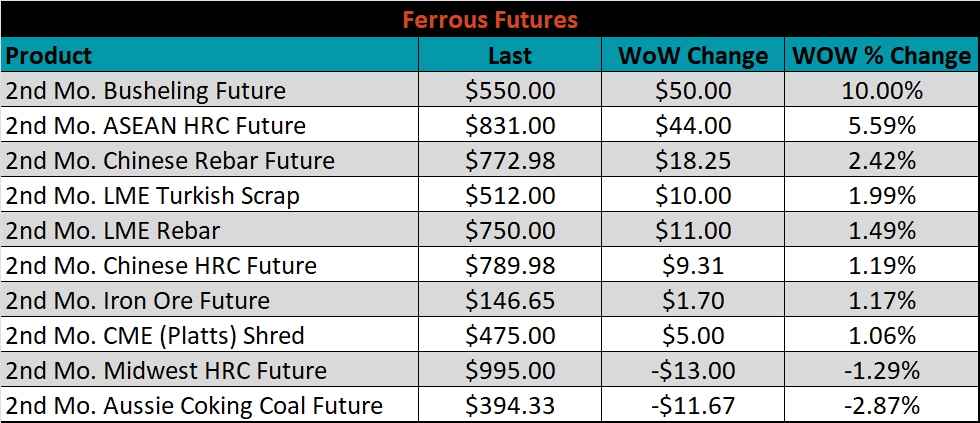
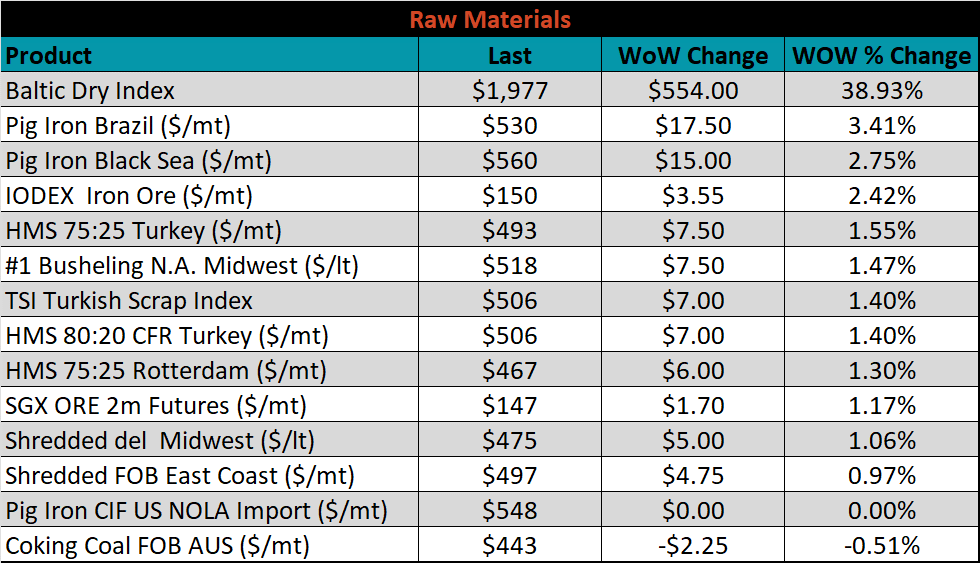
March ferrous futures were mixed. Midwest busheling gained 10%, while Aussie coking coal lost 2.9%.
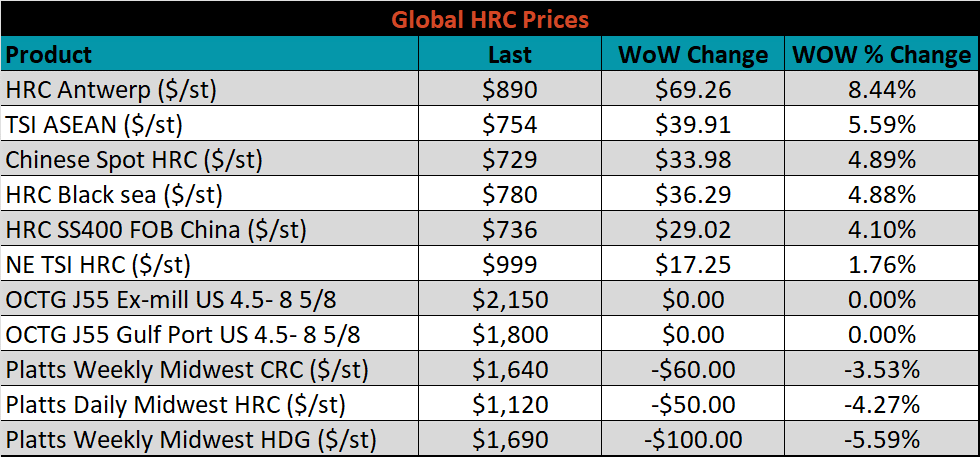
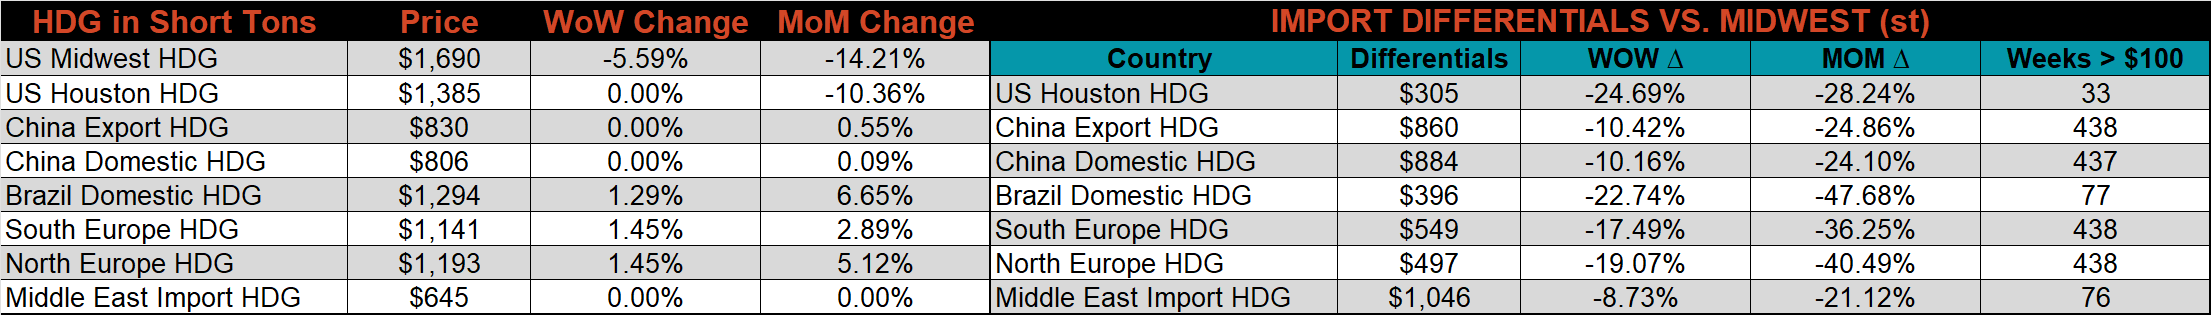
Global flat rolled indexes were mixed. Antwerp HRC rose 8.4%, while Midwest HDG was down 5.6%.
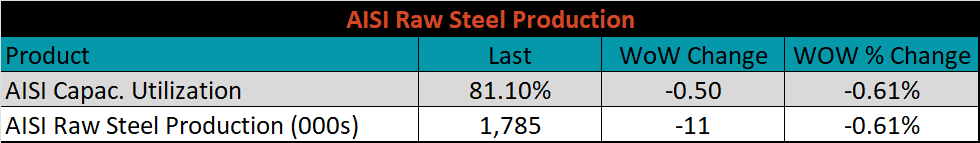
The AISI Capacity Utilization was down another 0.5% to 81.1%. Capacity Utilization remains significantly elevated for how rapidly steel prices are falling. Mills keeping elevated levels of production is a sign that they see the current inventory surplus as only a temporary obstacle for the remainder of 2022.
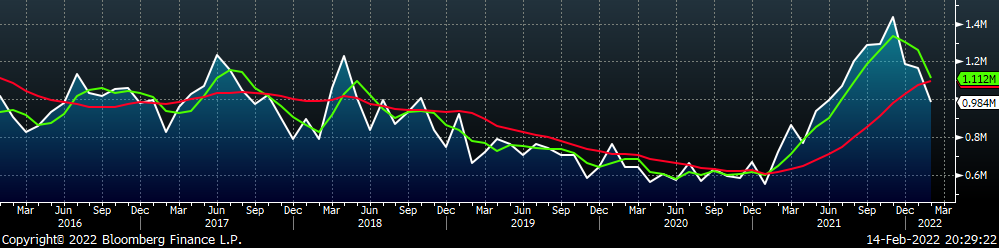
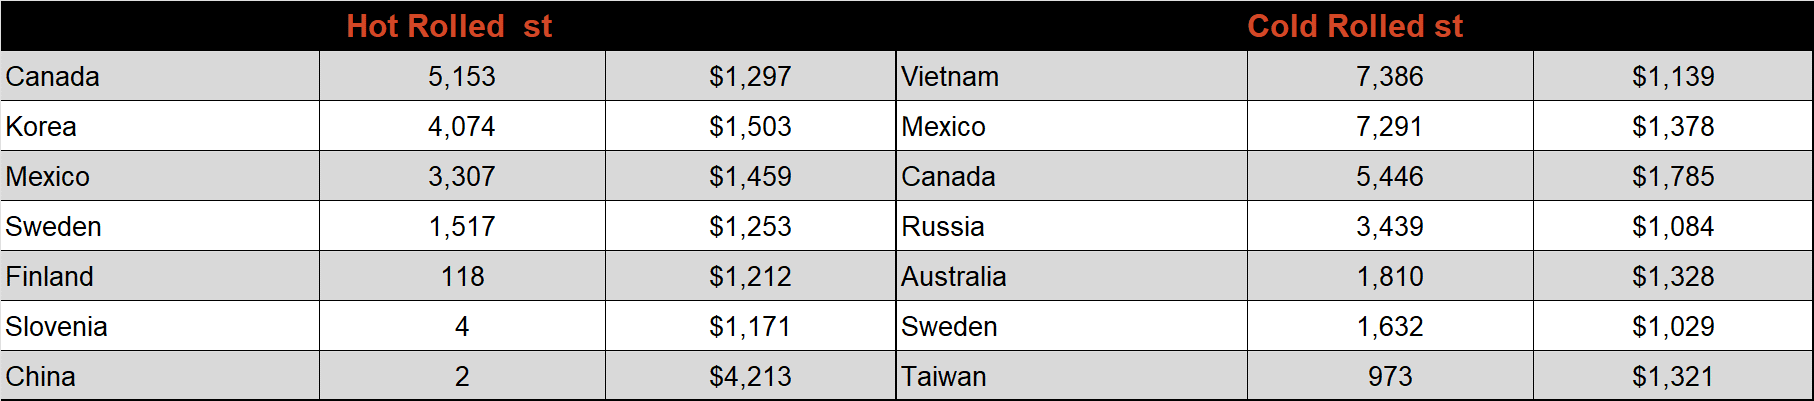
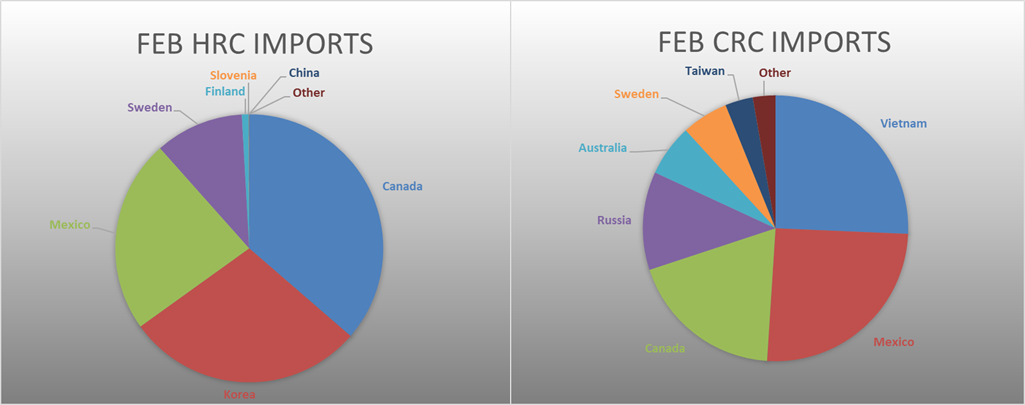
February flat rolled import license data is forecasting a decrease of 184k to 984k MoM.
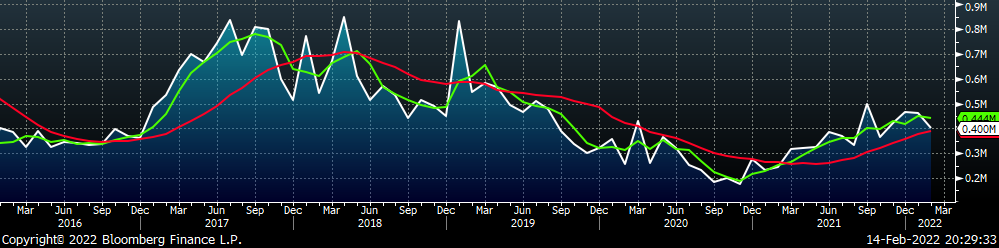
Tube imports license data is forecasting a decrease of 64k to 400k in February.
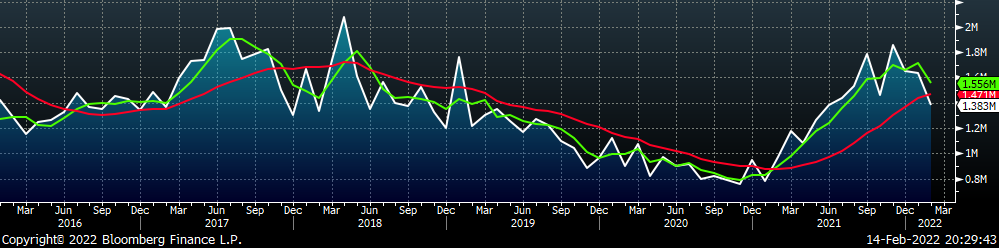
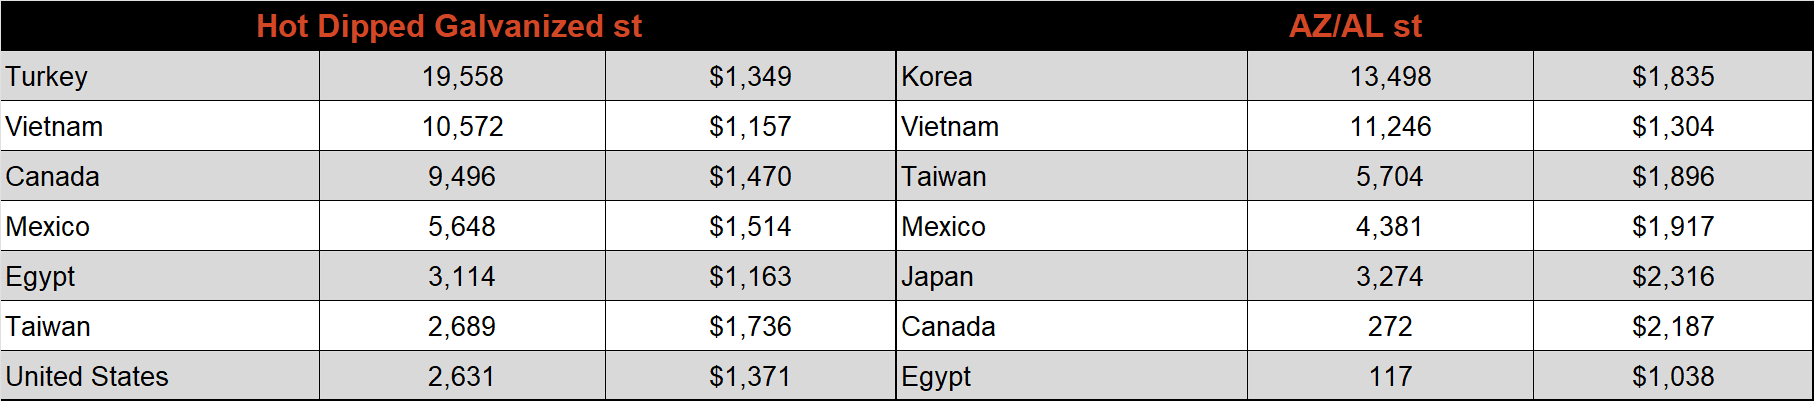
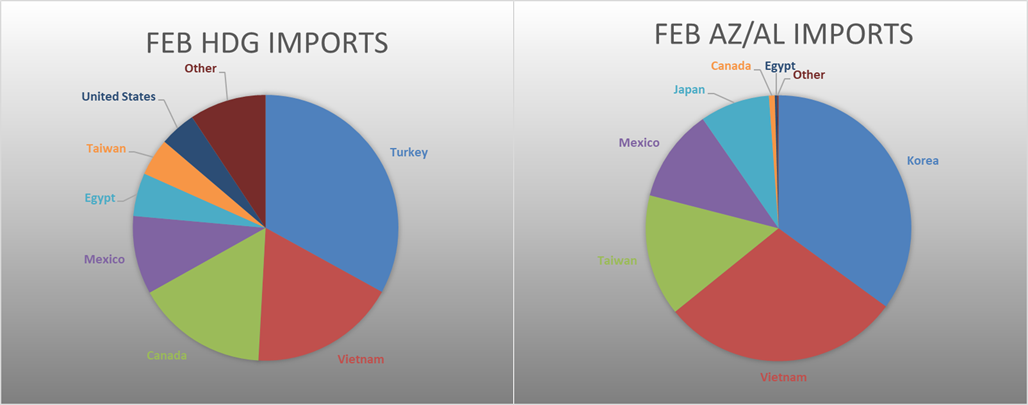
February AZ/AL import license data is forecasting an increase of 43k to 155k.
Below is February import license data through February 7th, 2022.
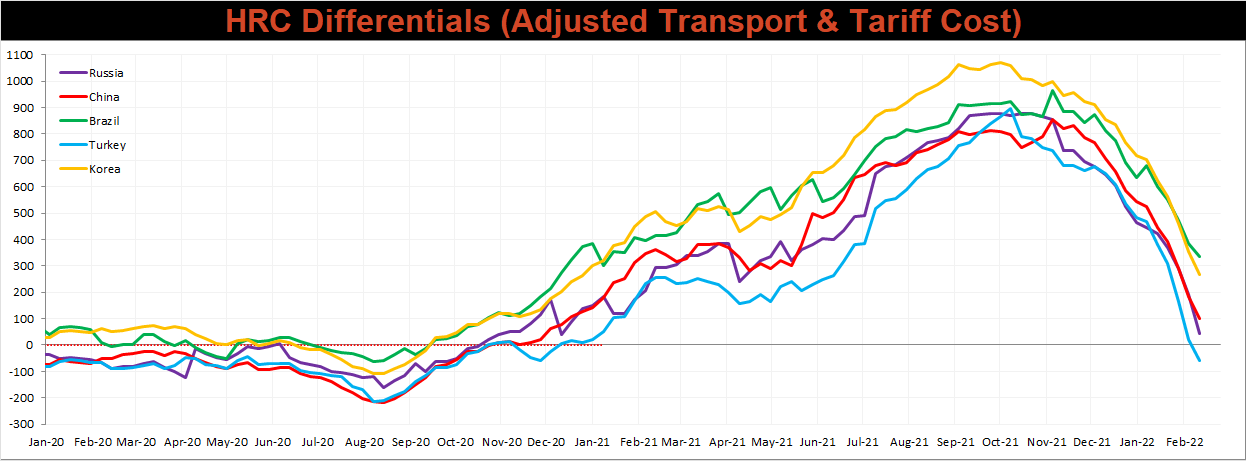
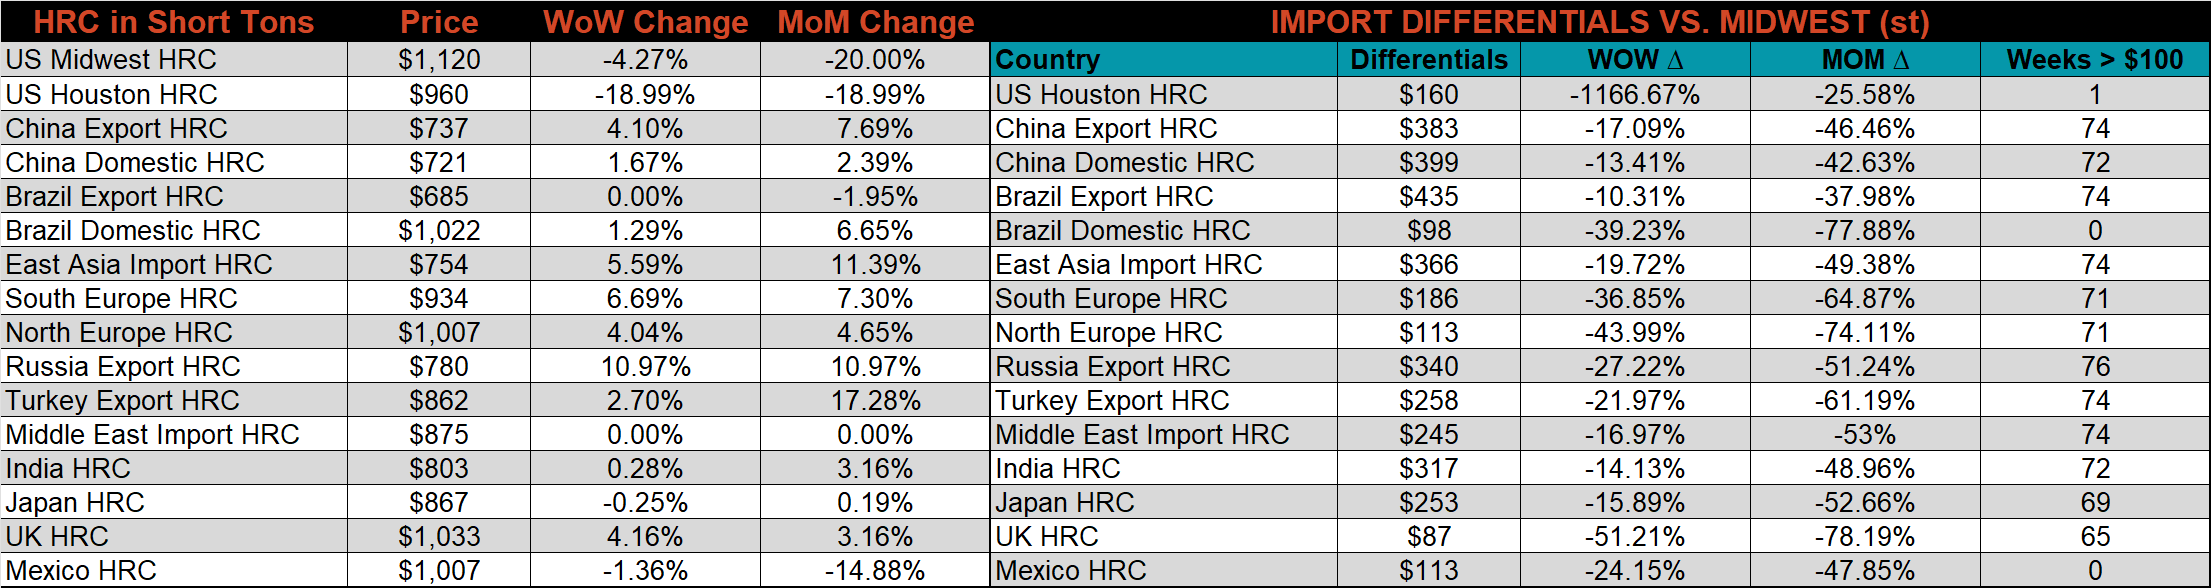
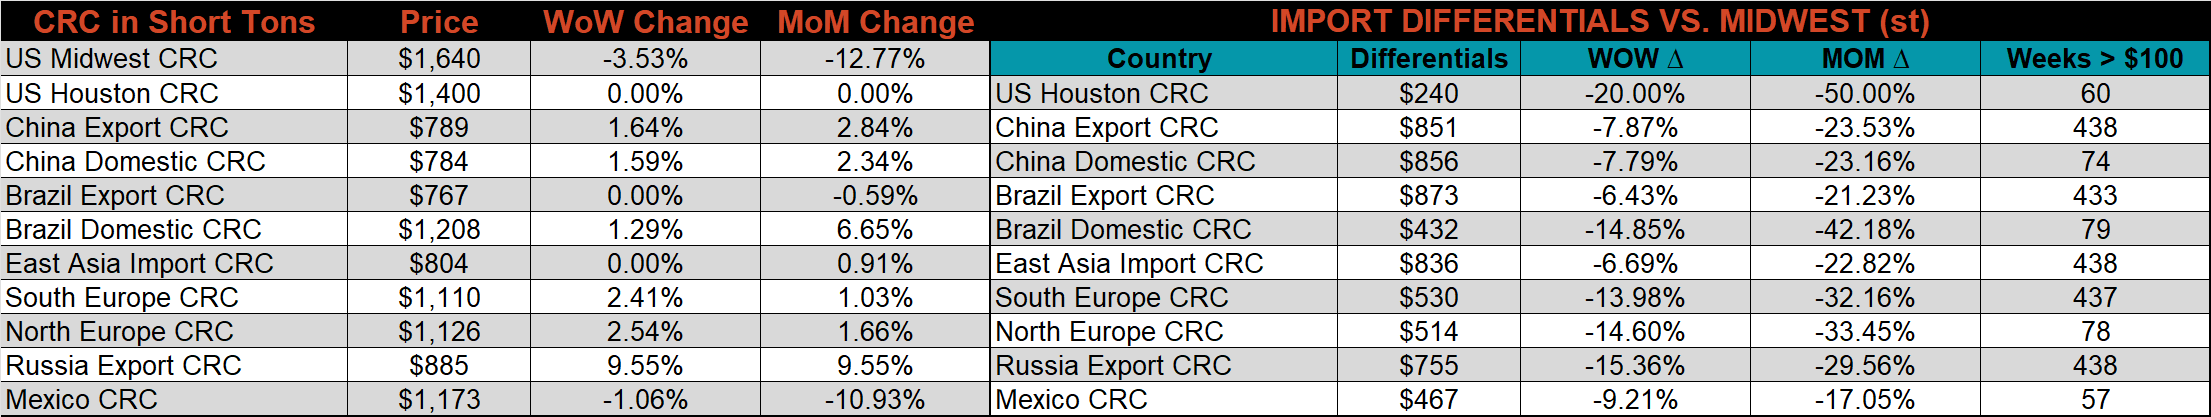
Below is the Midwest HRC price vs. each listed country’s export price using pricing from SBB Platts. We have adjusted each export price to include any tariff or transportation cost to get a comparable delivered price. All the watched countries differentials decreased again this week, as the domestic price continued to decrease.
SBB Platt’s HDG, HRC and CRC pricing is below. The Midwest HDG, HRC, and CRC prices were down 5.6%, 4.3%, and 3.5%, respectively. Outside of the U.S., the Russian HRC and CRC export prices were up, 11%, and 9.6%, respectively.
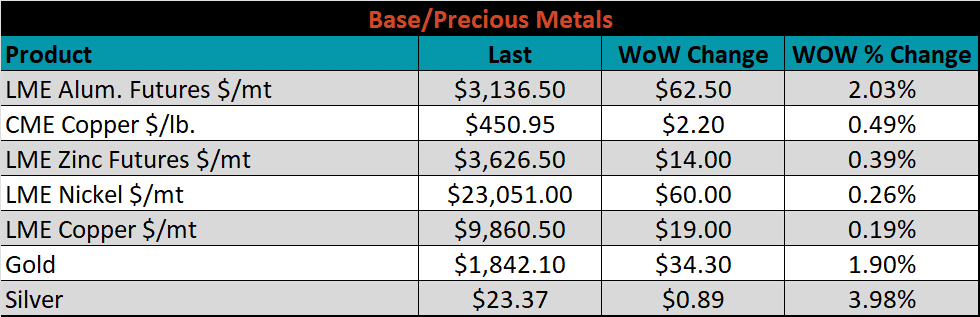
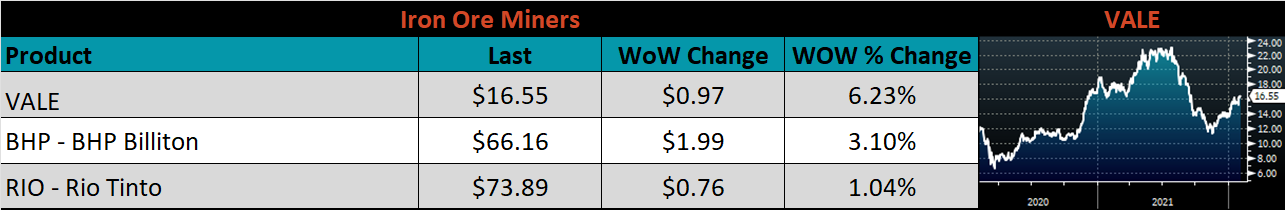
Raw material prices were mostly higher, led by Brazil pig iron, up 3.4%.
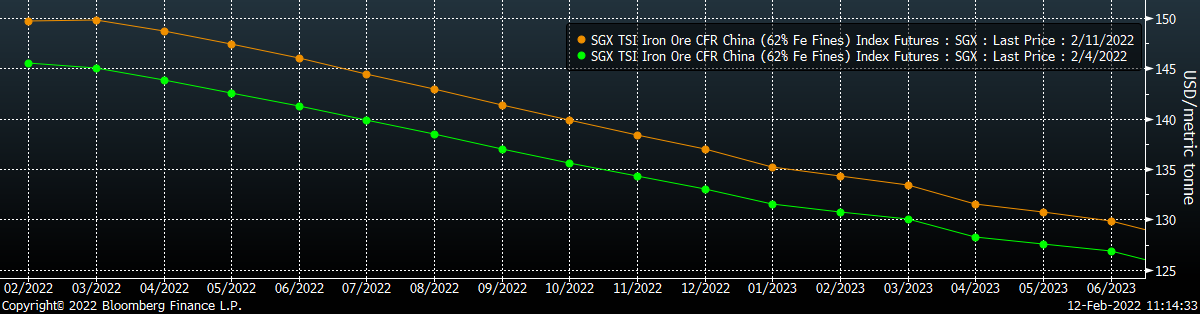
Below is the iron ore future curve with Friday’s settlements in orange, and the prior week’s settlements in green. Last week, the entire curve was shifted higher at all expirations.
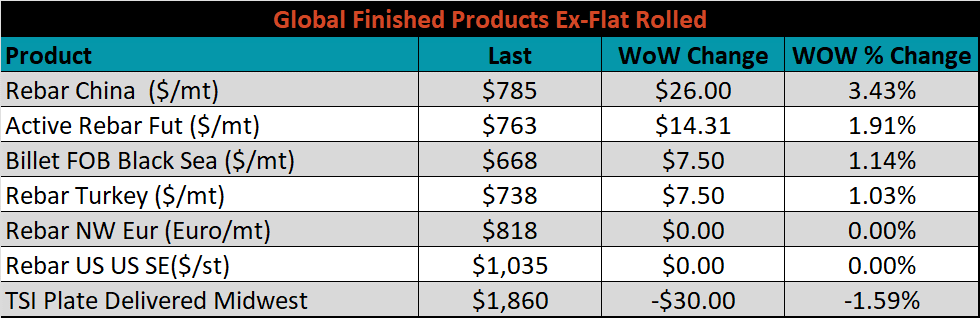
The ex-flat rolled prices are listed below.

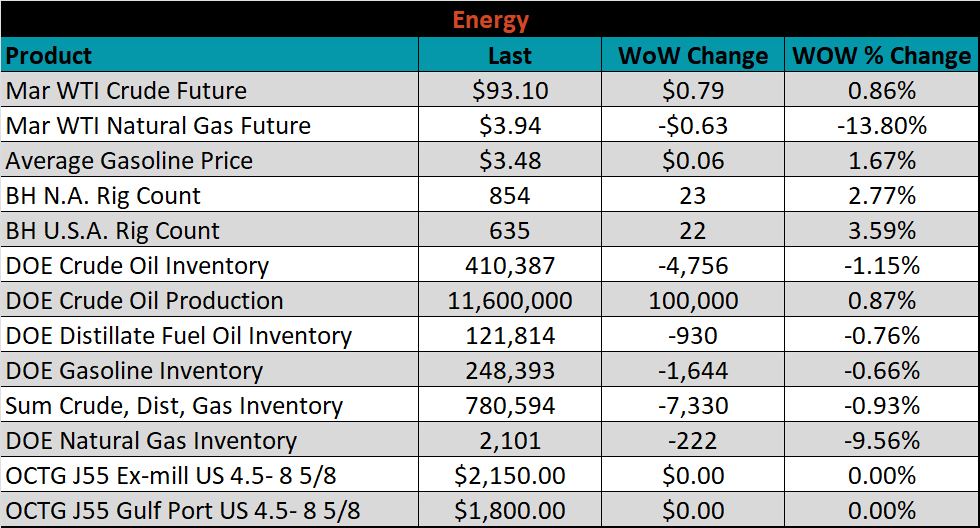
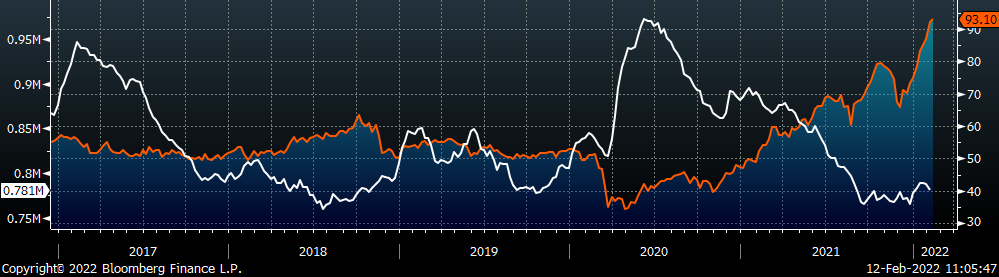
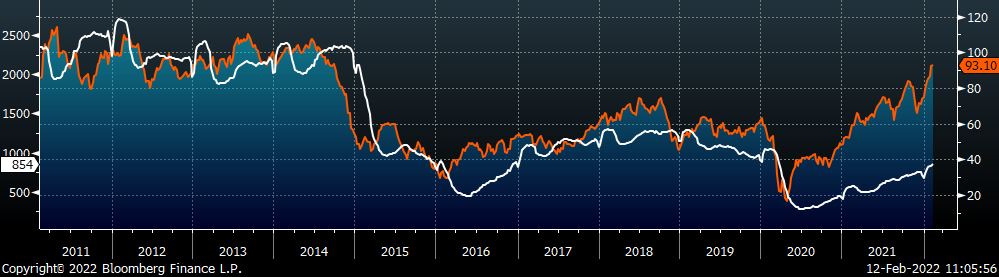
Last week, the March WTI crude oil future gained another $0.79 or 0.9% to $93.10/bbl. The aggregate inventory level was down 0.9%, while crude oil production increased to 11.6m bbl/day. The Baker Hughes North American rig count was up by another 23 rigs, and the U.S. rig count was up 22 rigs.
The list below details some upside and downside risks relevant to the steel industry. The bolded ones are occurring or highly likely.
Upside Risks:
Downside Risks: