Content
-
Weekly Highlights
- Market Commentary
- Risks


Last week was relatively quiet with continued steady interest in quoting and purchase orders from FGM customers. Regarding flat rolled price direction, there remains more questions than answers and we remain cautious and risk-averse.
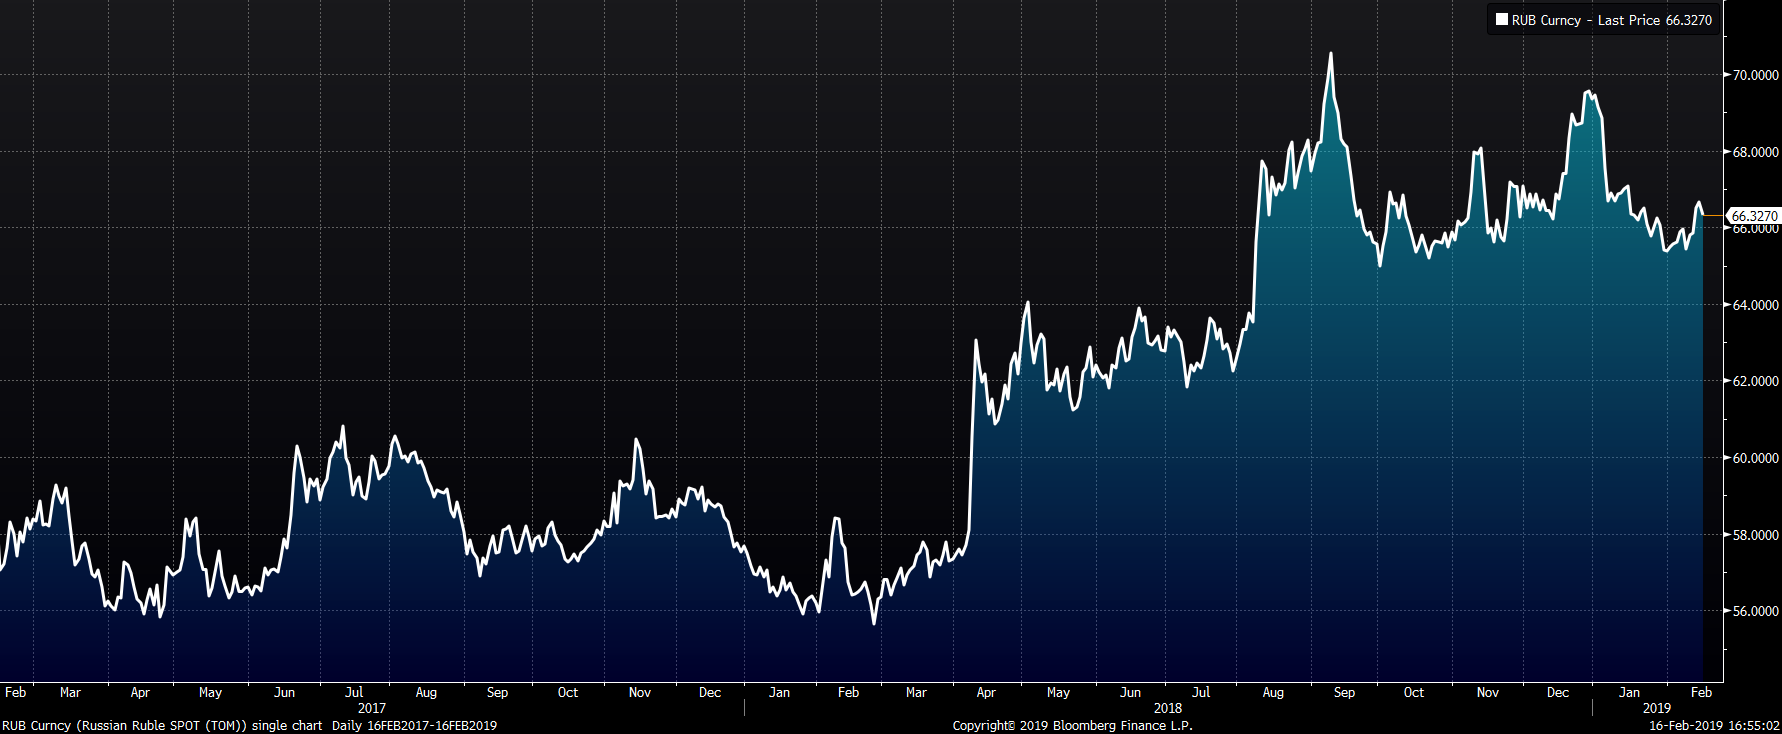
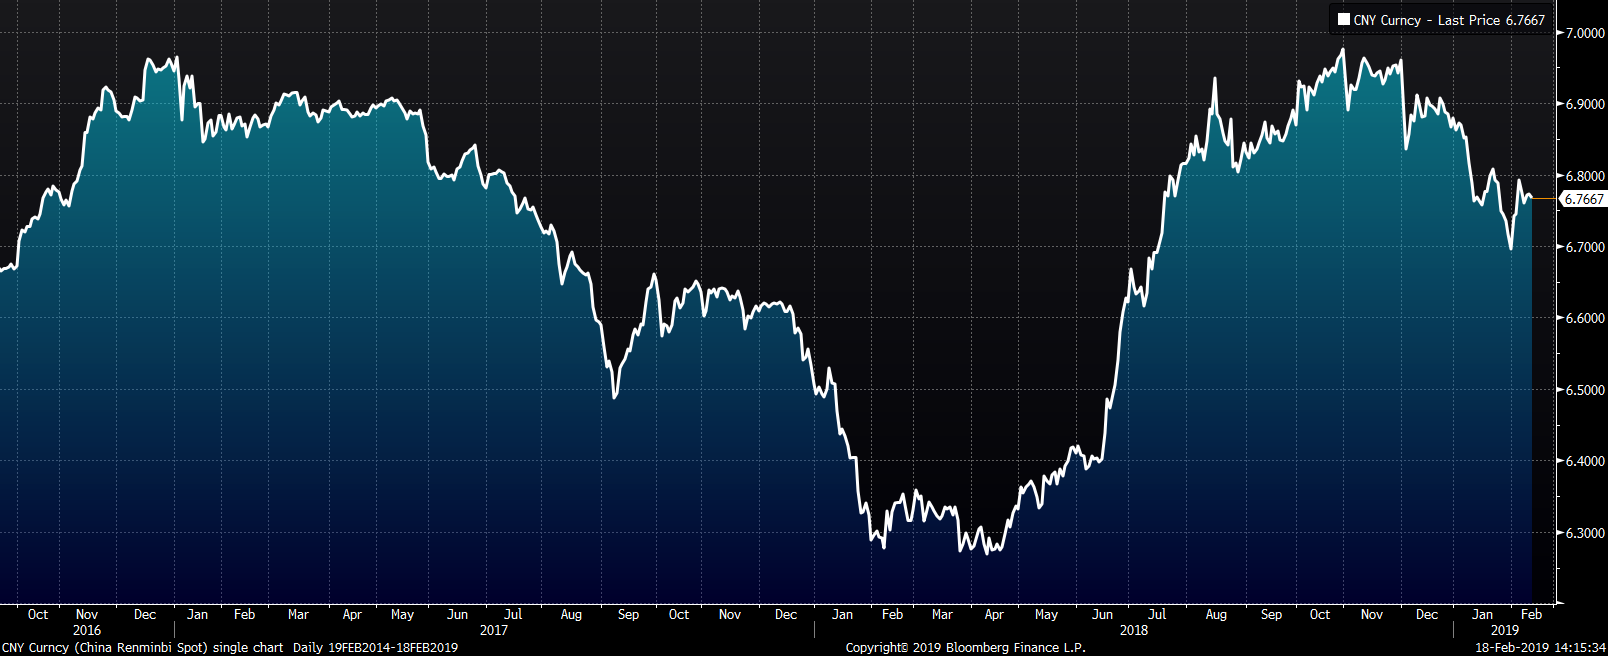
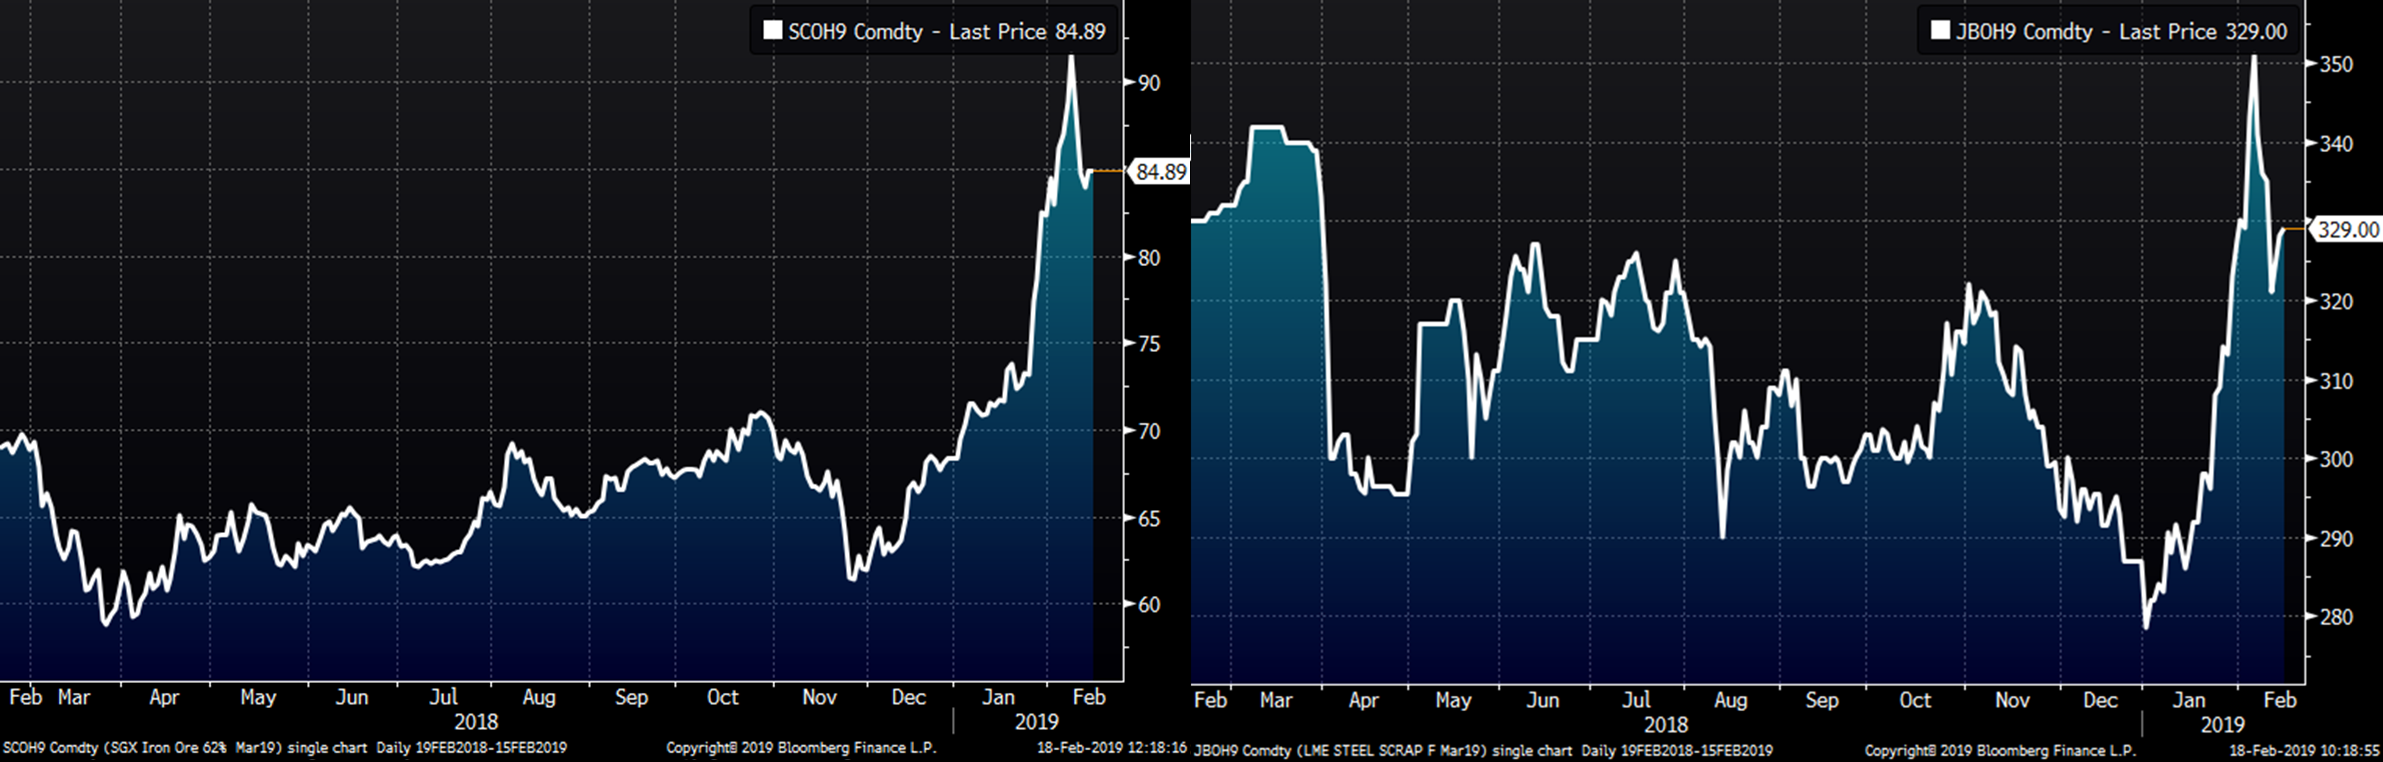
China’s return from the Chinese New Year holiday failed to produce any follow through in iron ore, which was down heavily on the week. Nevertheless, at $85/t, iron ore remains at very strong levels. Scrap prices followed iron ore lower. Trade talks between the U.S. and China continue without any concrete results. However, the Chinese yuan has appreciated in recent weeks perhaps indicating China’s expectation of a resolution or at the very least a delay to the March 1 deadline for another tariff increase.
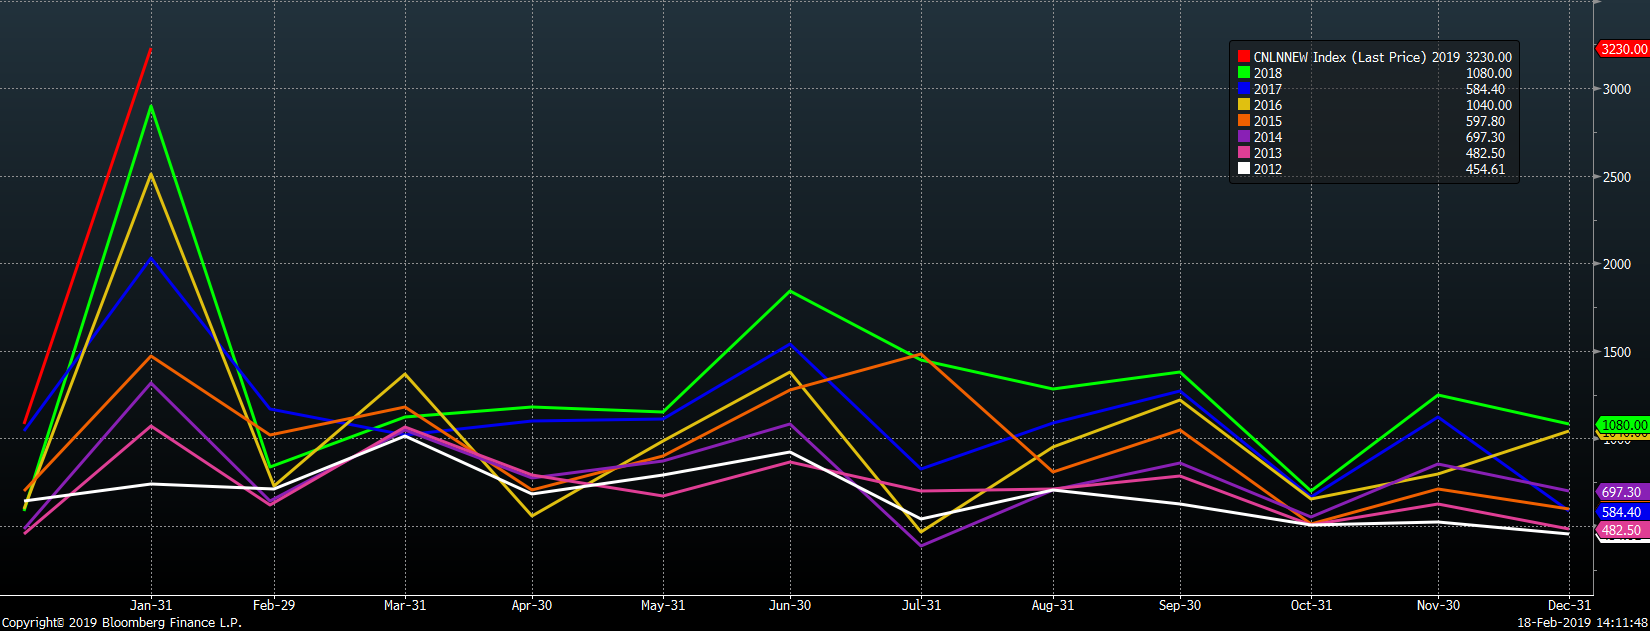
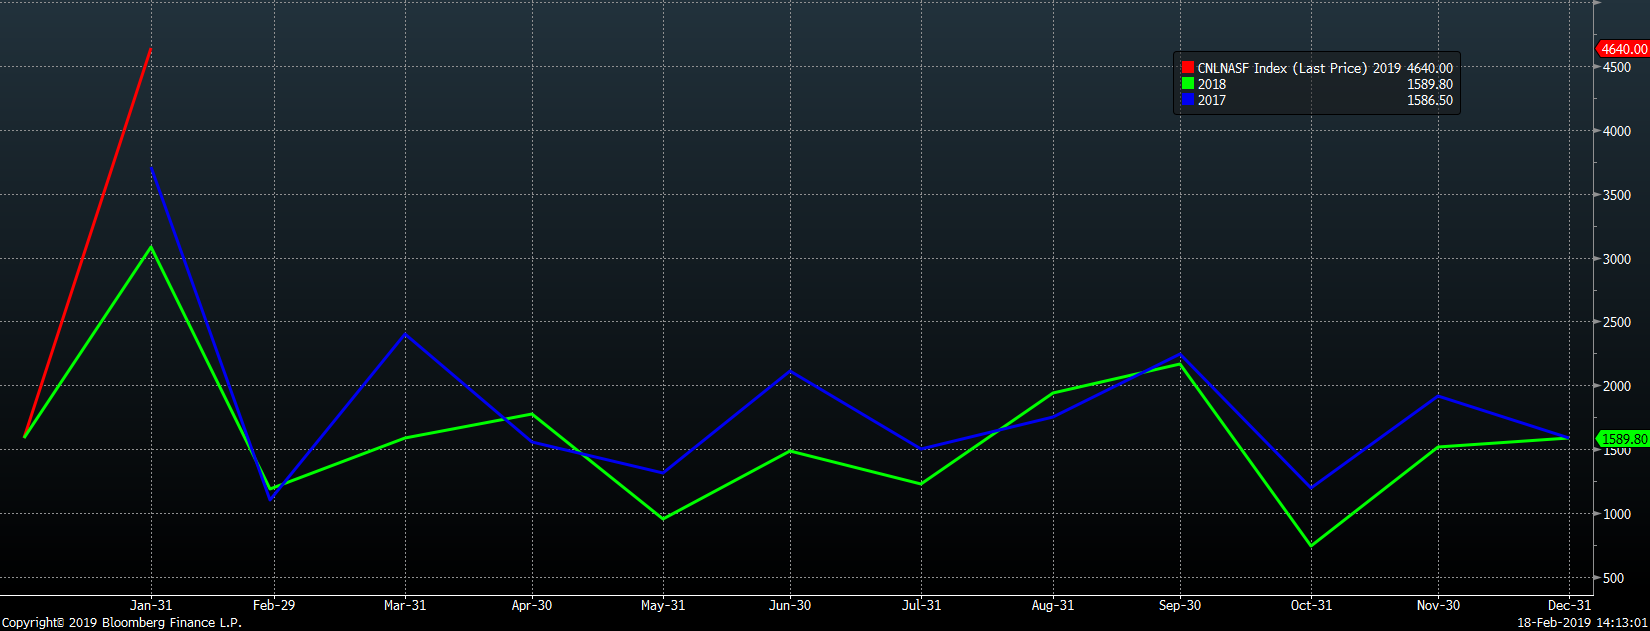
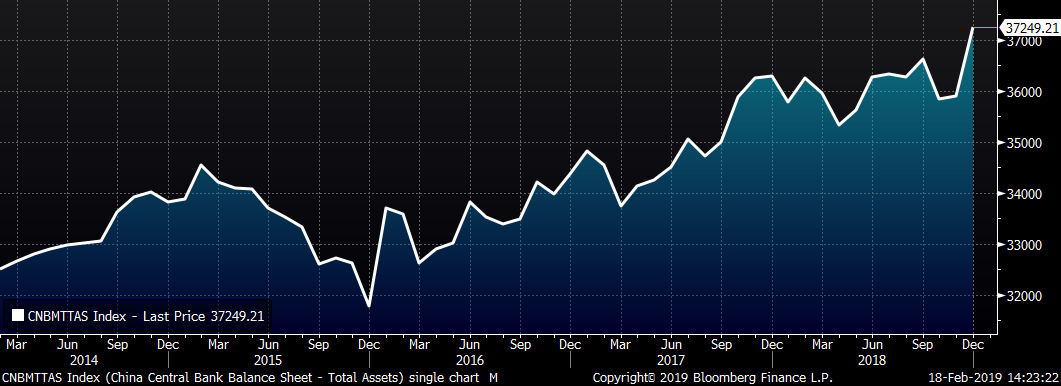
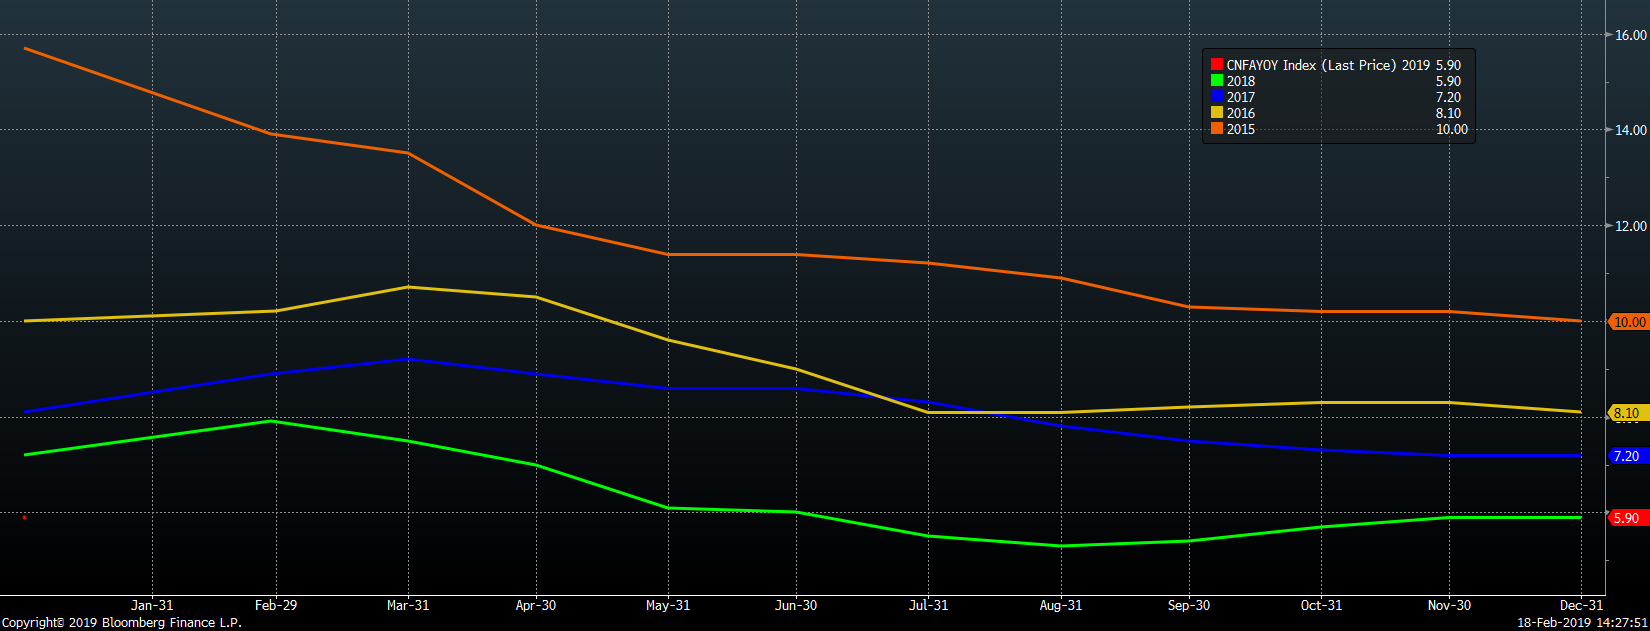
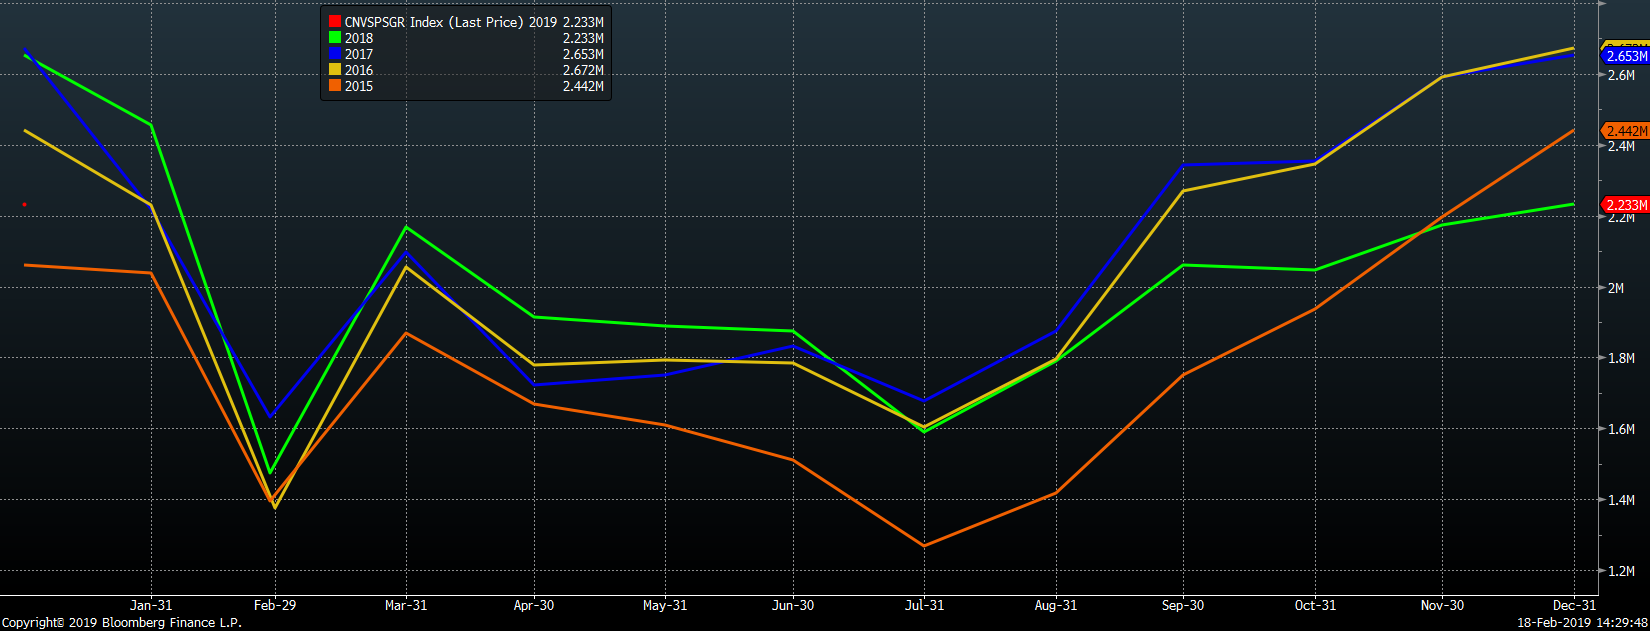
China has proactively fought the trade war induced drag on their economy on a number of fronts. Last week, January new yuan loans and aggregate financing data exceeded expectations as the P.B.O.C. continues to provide ample liquidity to the Chinese economy. Both charts compare monthly data on a YoY basis. 2019 data is in red.
The P.B.O.C. continued to increase assets on its balance sheet through December.
However, fixed asset investment grew at its slowest YoY rate for the month of December back to at least 1998 (when records started) and remains subdued below 6%.
China’s December auto sales fell to the lowest level in years (green).
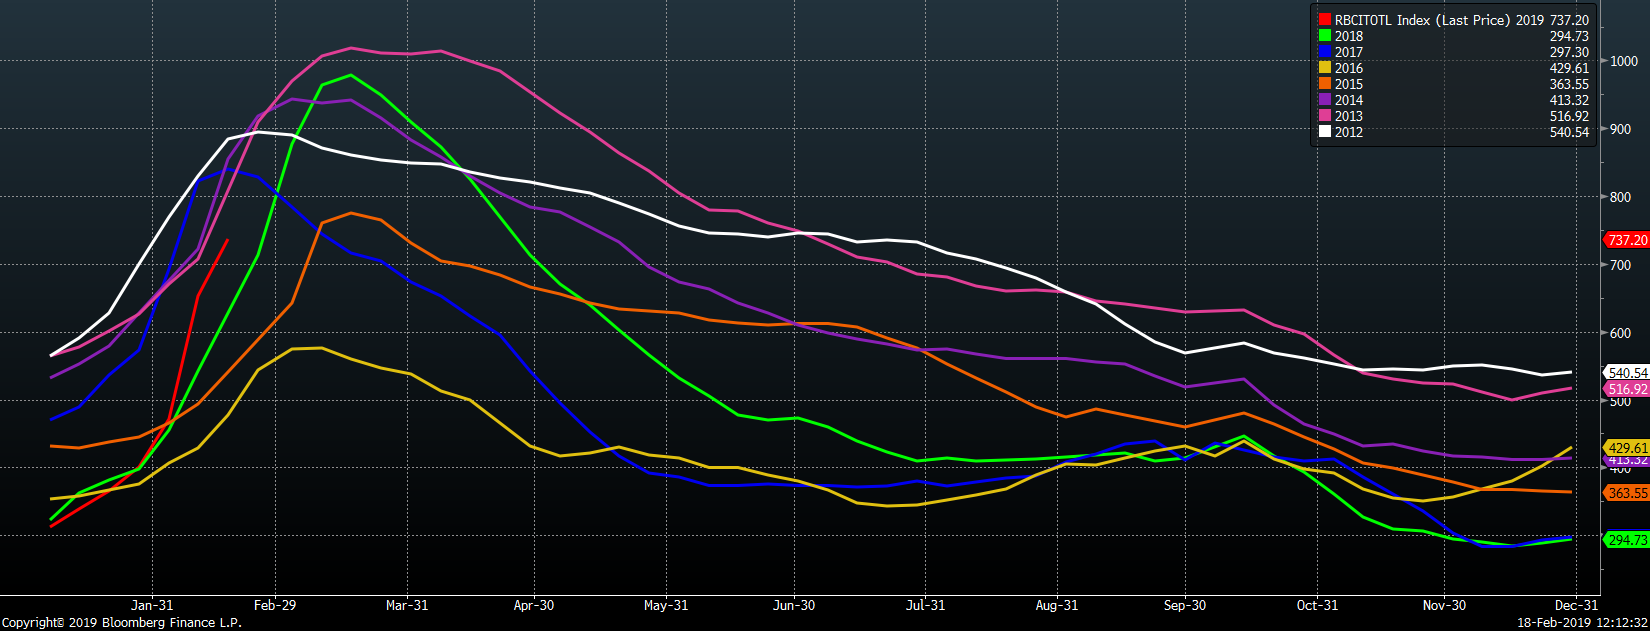
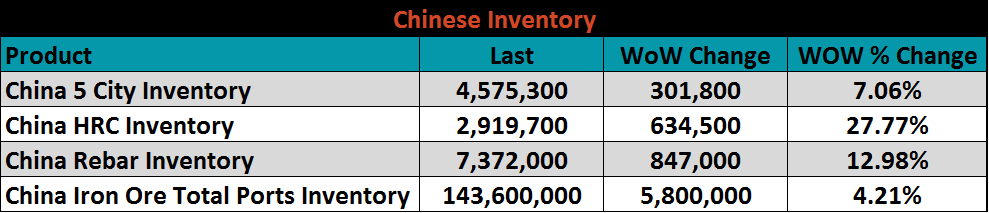
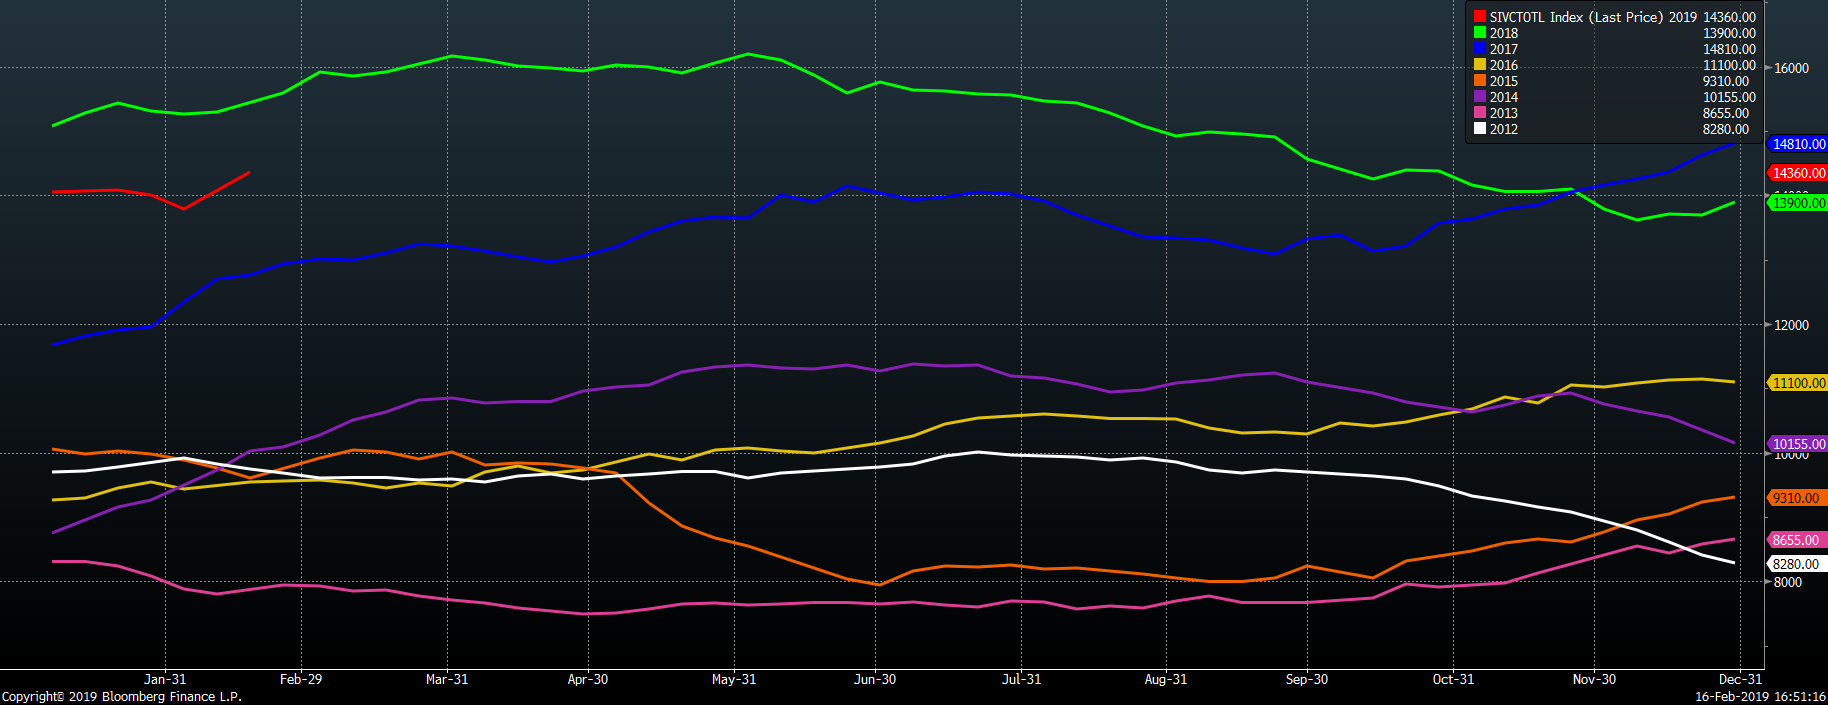
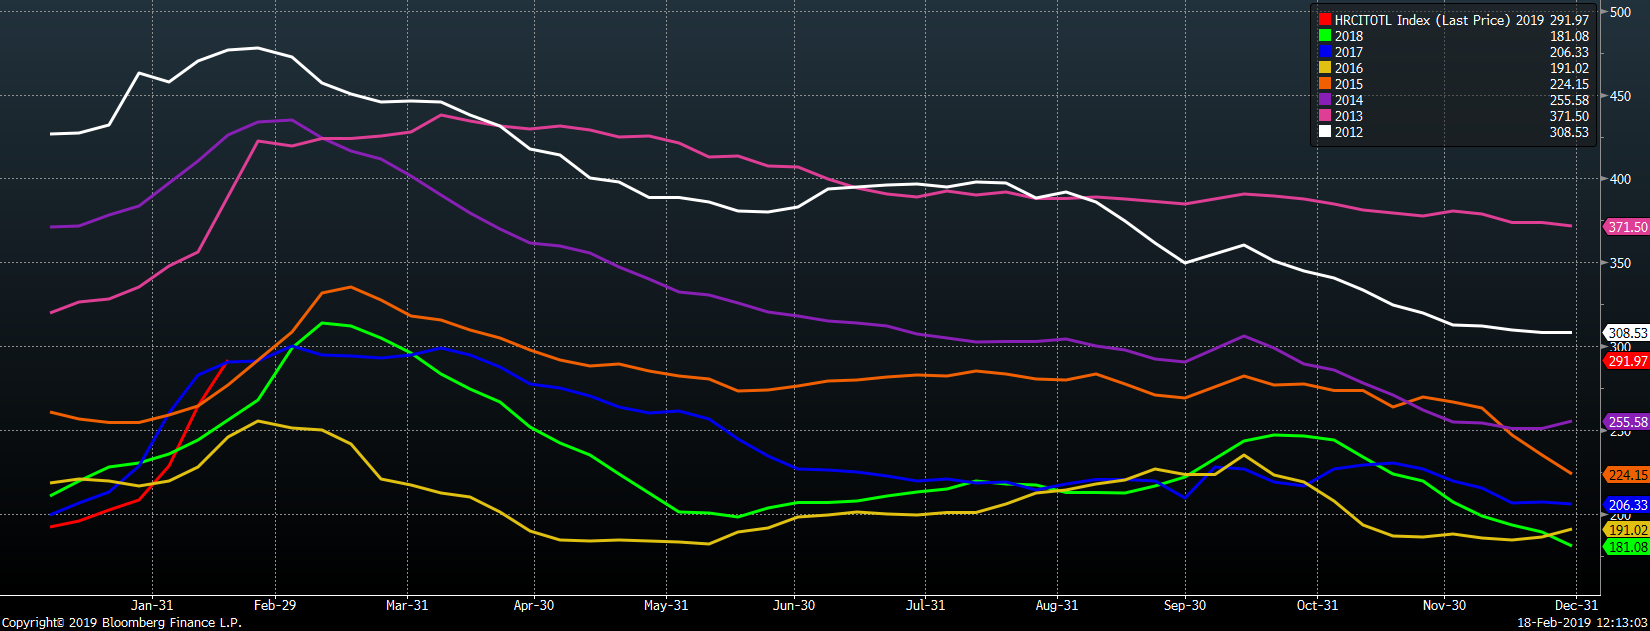
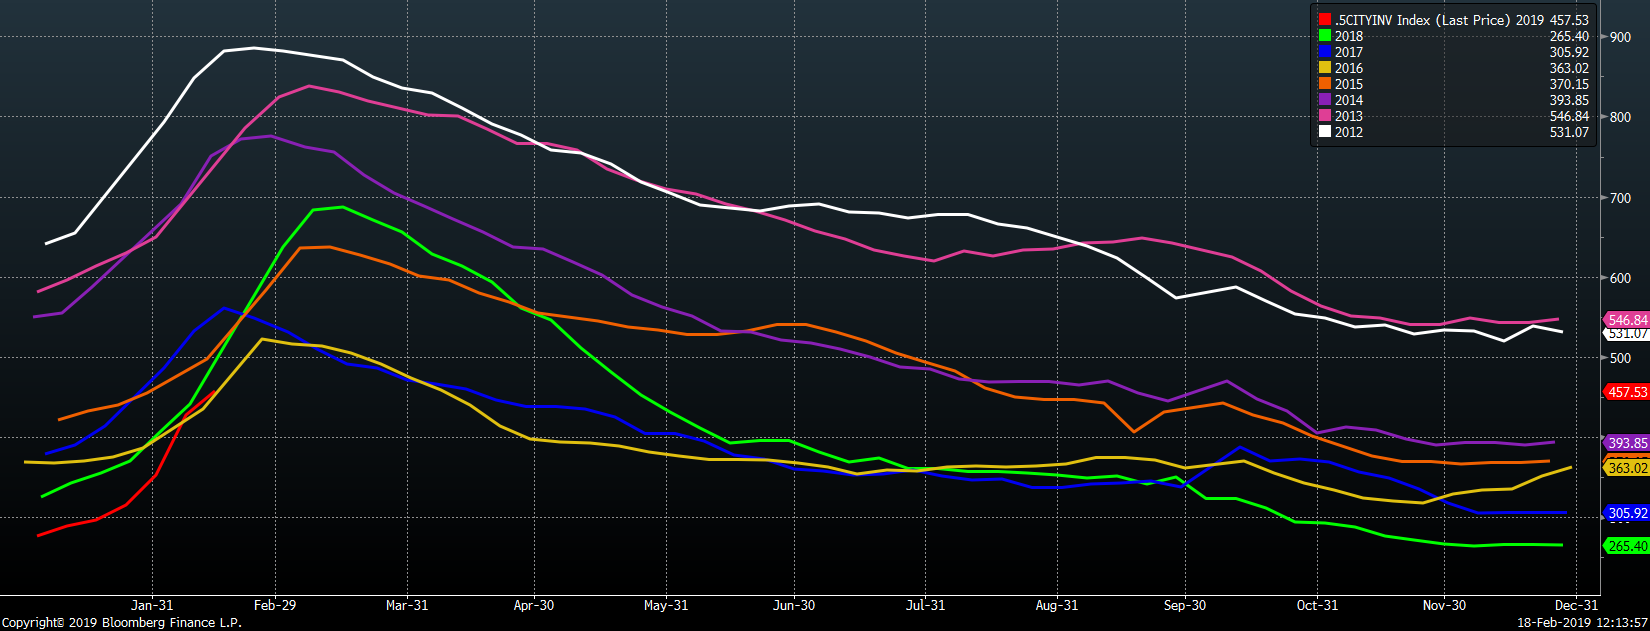
Chinese finished steel inventory levels (red) exceeded those seen this week in 2015, 2016 and 2018. 2019 HRC inventory is in line with this same week in 2018, while rebar inventory still trails the level it was at this week in 2018.

Taken together, these charts show liquidity and dovish monetary policy has been administered to stimulate the Chinese economy. However, fixed asset investment and auto sales fail to see a material pick up. This begs the question of whether the recent rally in iron ore, rebar and HRC futures is forecasting an economic rebound in these steel intensive industries or if it is simply a speculative rally fueled by increased liquidity and momentum.
U.S. import licenses continue to point to subdued import levels and pricing differentials inclusive of the tariffs look prohibitive creating a tighter supply situation in Q2 and Q3.
Last week’s report presented these two questions:
Last week’ report showed:
The MSCI reports January service center shipments and inventory this week. Typically, months-on-hand falls sharply in January due to rebounding shipments. One caveat is the last two days of January were hit with the polar vortex, which may have slowed shipments. Inventory changes in January are less black and white than shipments. Service centers struggled through the second half of 2018 taking in higher priced steel in a rapidly falling price environment. Most continued to be in a destocking mood in January with some in jeopardy of breaching covenants with their financiers. Service center destocking increased the pressure on domestic mills order books, which might be on the rebound in February as service centers look to max out volume on index-based deals, especially those deals discounted to the index. Keep an eye on lead times to see how much of an effect this has in this new environment of increased capacity. Recent economic data indicates steel demand has been slowing. In addition, steel buyers have been very price sensitive.
At current tariff inclusive levels, import differentials are unattractive, which historically results in strong domestic price gains to come. However, has the increased domestic production capacity and inventory levels seen at the mill and distributor level mitigated some of this effect? How much has this additional capacity changed this calculus?
Also, the uncertainty regarding the Bicameral Congressional Trade Authority Act of 2019 (there were no developments regarding the legislation last week) could be a drag on purchase orders for if it is passed and tariffs on Canada, Mexico and the E.U. are reversed, a sharp price correction is certain. This uncertainty is likely to leave the industry in a more risk-averse mode.
Pay close attention to Chinese finished steel and iron ore prices. If they reverse course, the import window will open back up sending domestic flat rolled prices lower.
The following issues provide the foundation of our view:
Upside Risks:
Downside Risks:
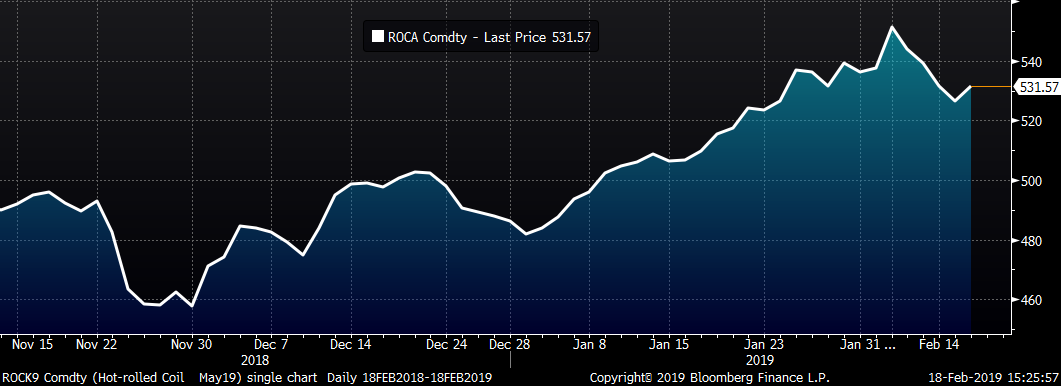
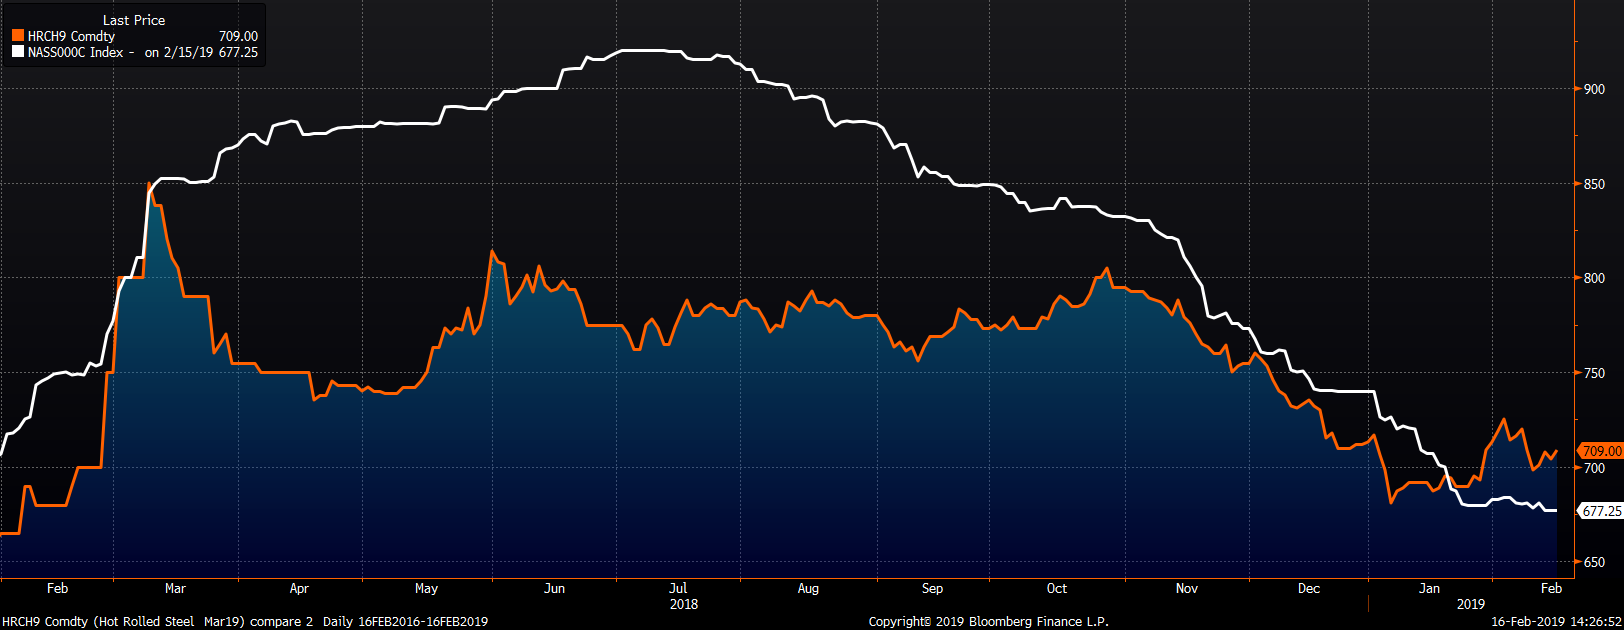
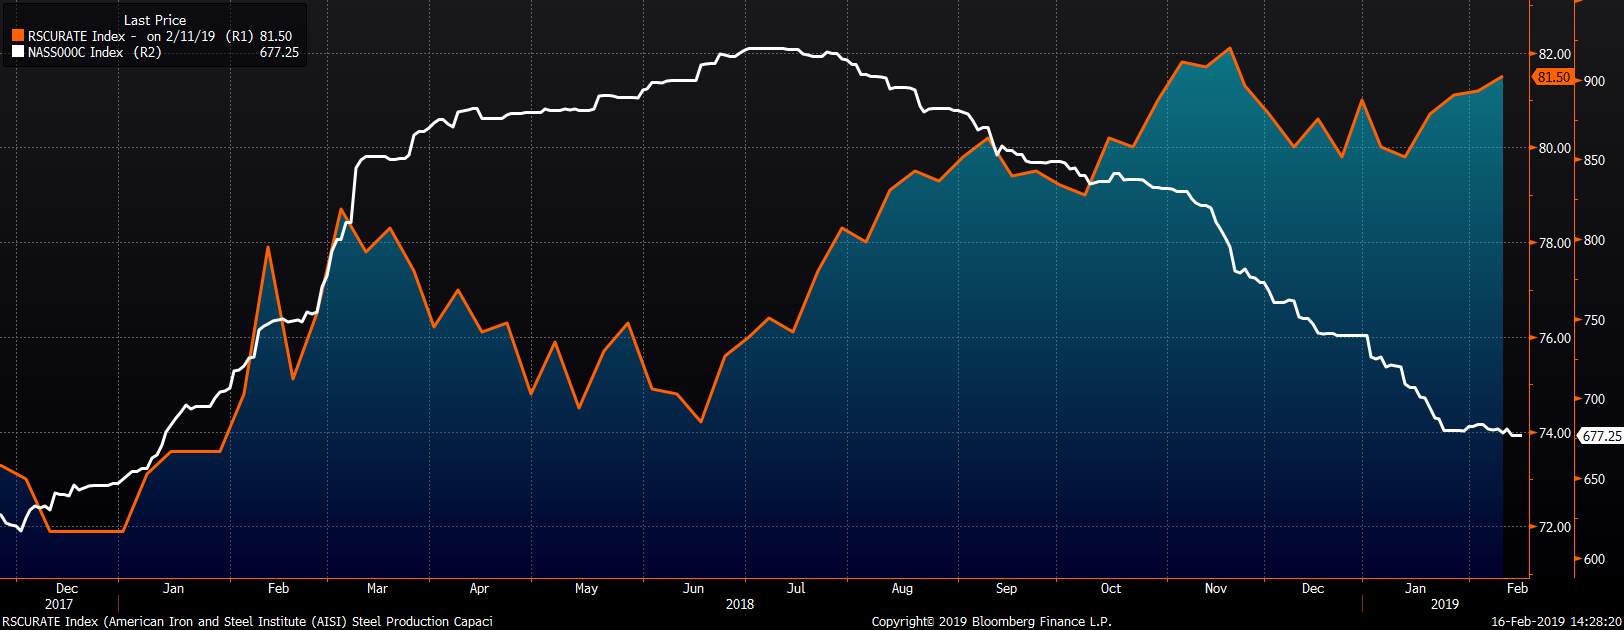
The March CME HRC was unchanged at $709 while the Platts TSI Daily Midwest HRC Index was down $3.75 to $677.25.
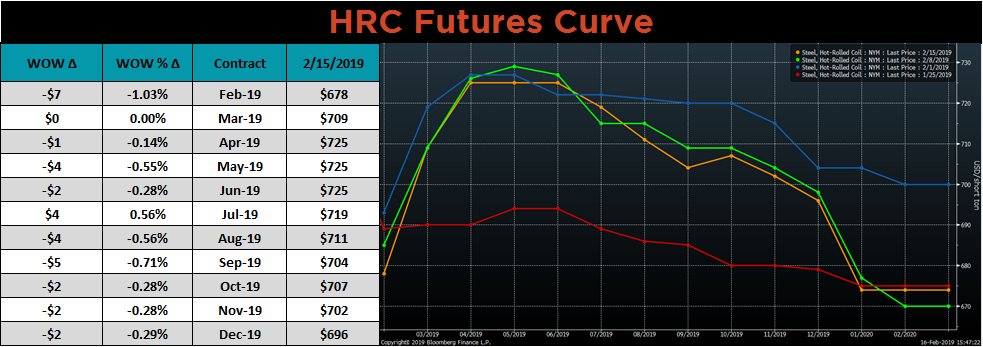
The CME Midwest HRC futures curve shown below with last Friday’s settlements in orange.
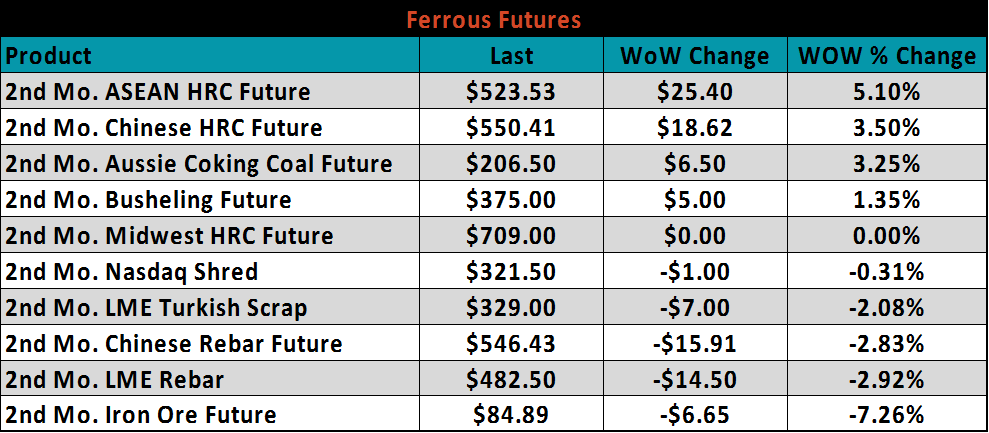
March ferrous futures are listed below. Iron Ore lost 7.3%, while Asian HRC futures rallied.
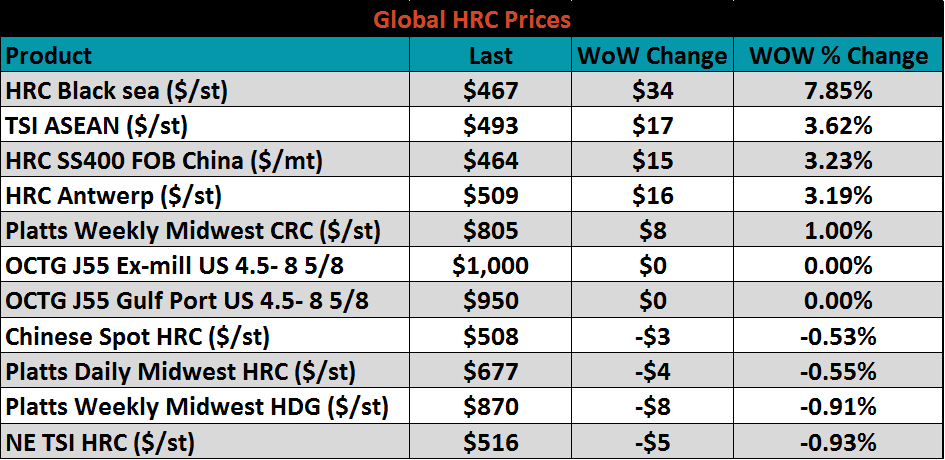
Flat rolled indexes were mixed, but the gains were significantly larger than the losses.
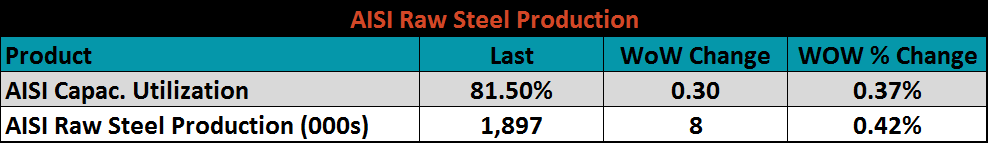
The AISI Capacity Utilization Rate increased to 81.5%.
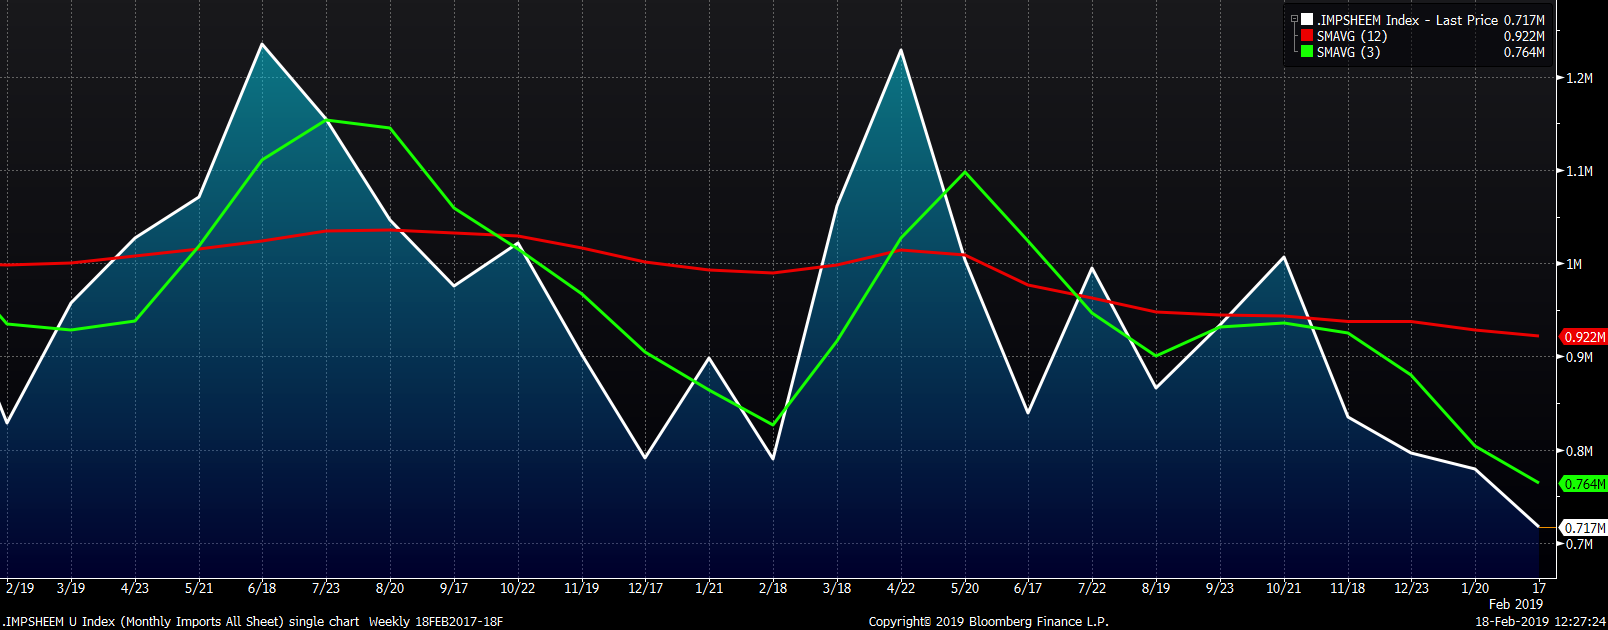
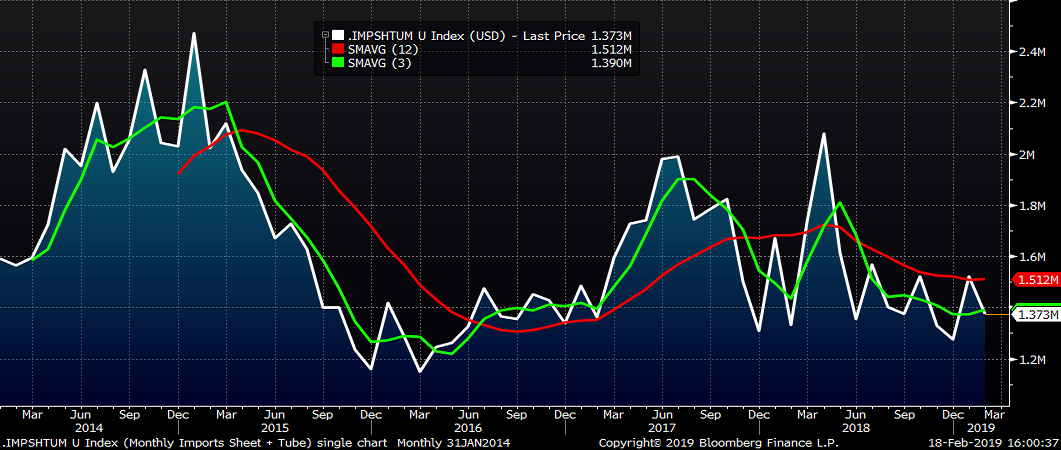
February flat rolled import licenses are forecast to fall 62k tons MoM to 717k while January flat rolled import licenses are forecast to fall 17k MoM tons to 779k.

February tube import license data is forecasted to fall to 656k tons MoM.
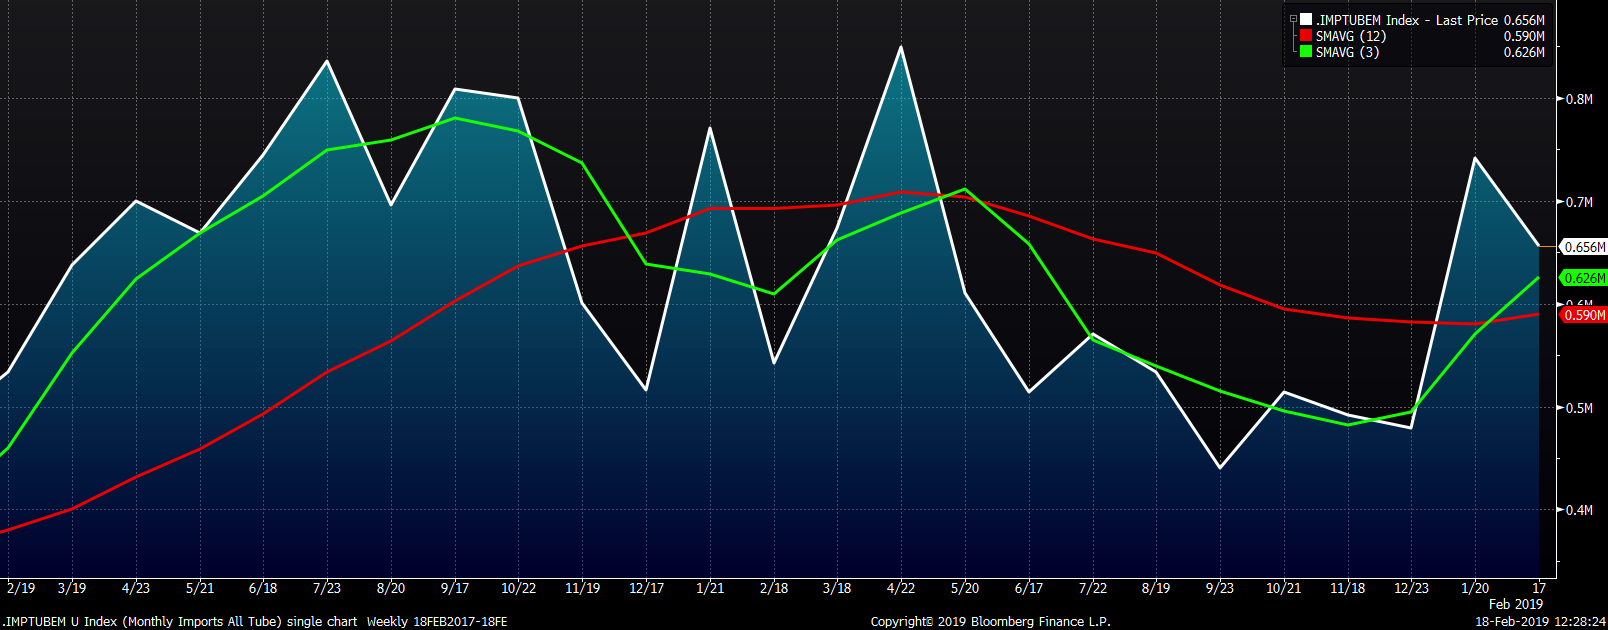
The combined flat and tube import license forecast looks to fall almost 150k tons in February after a 240k MoM increase forecast in January due to a big increase in tubular products, much of which was imported from Korea.
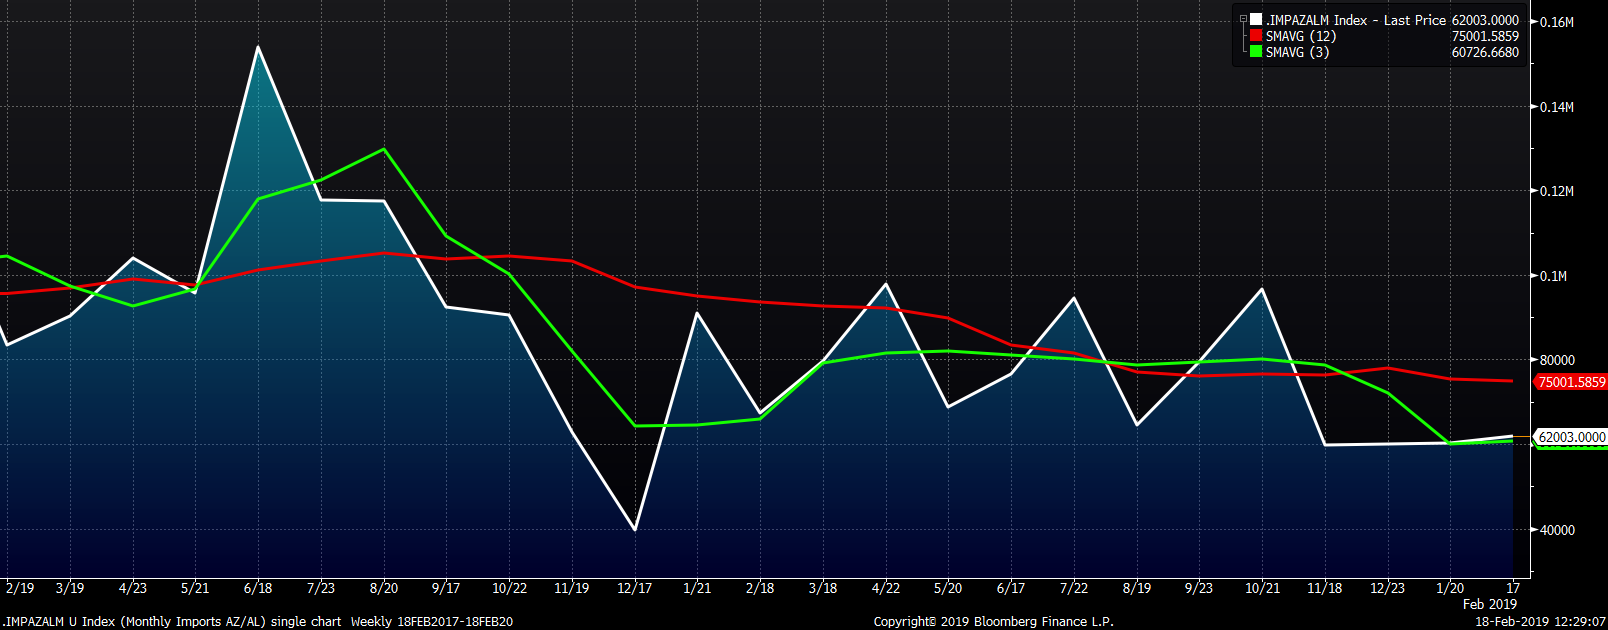
AZ/AL import licenses have become well entrenched around 60k with February licenses forecast at 62k. This would be the fourth consecutive month with galvalume imports around 60k.
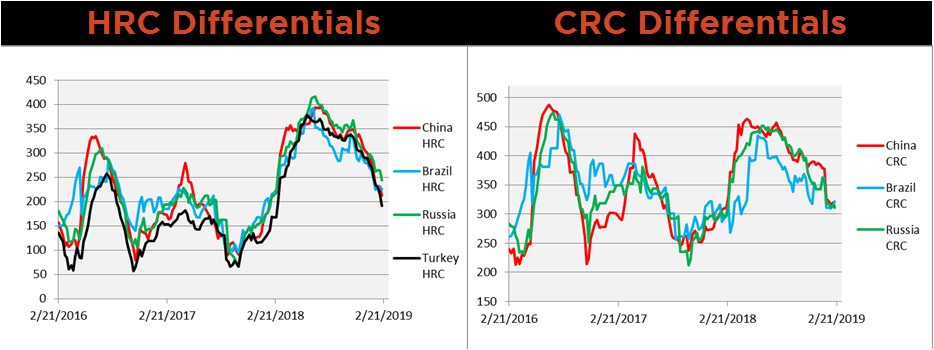
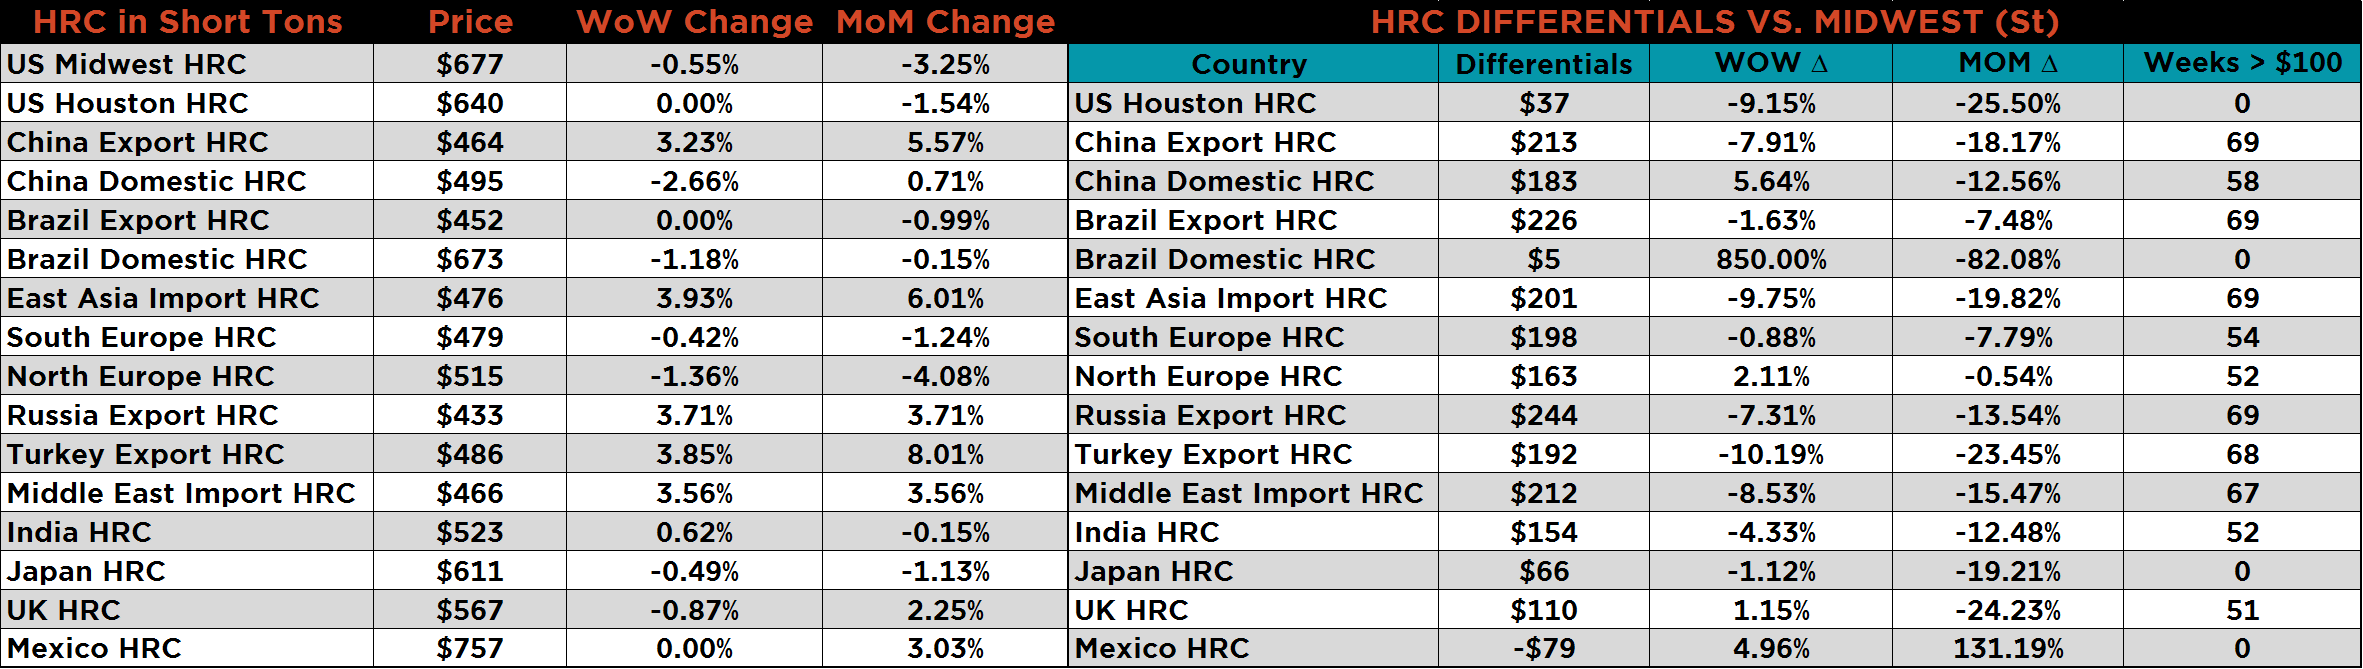
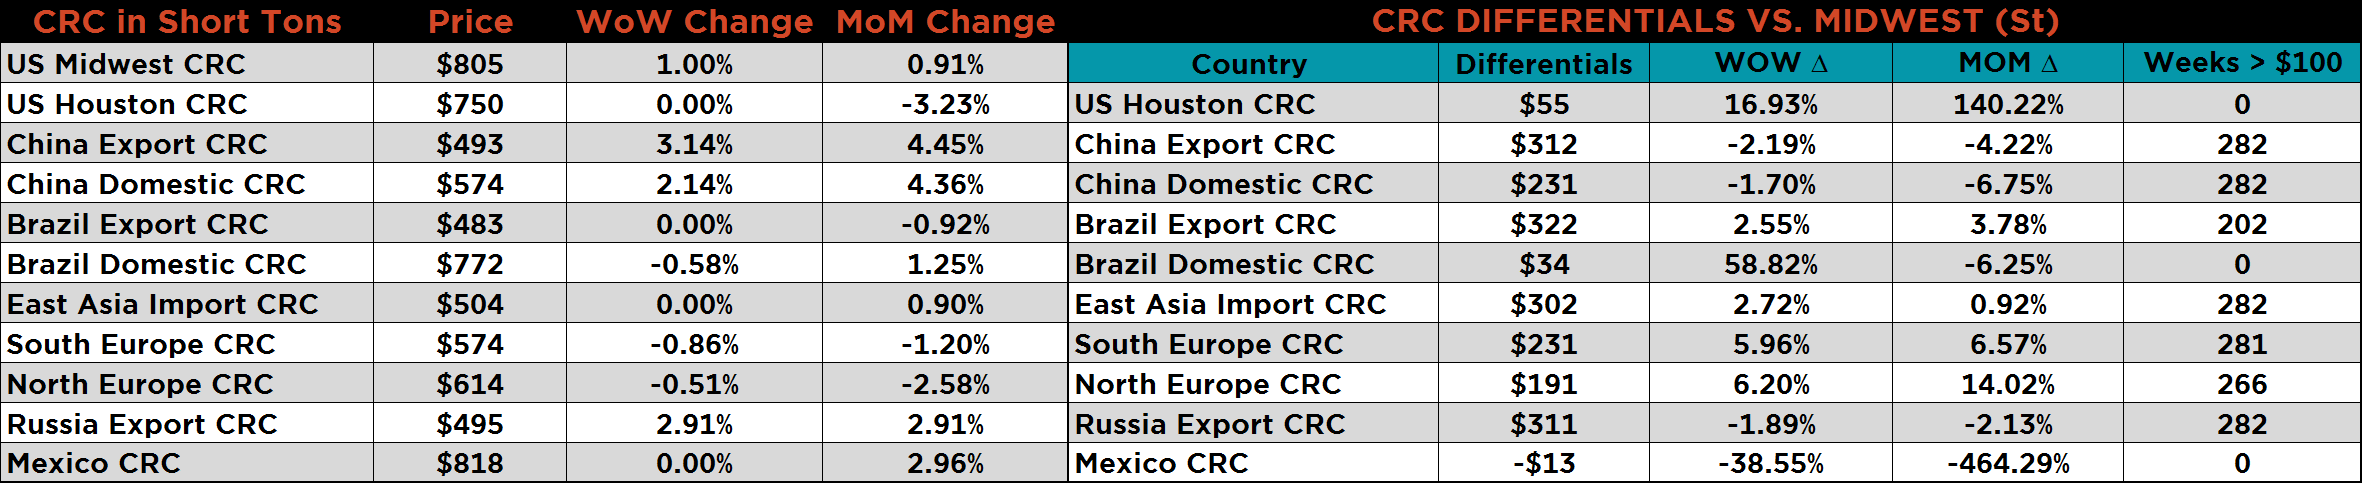
Below are HRC and CRC Midwest vs. each country’s export price differentials using pricing from SBB Platts. Import differentials continued to compress with Midwest HRC moving lower, while China, Russia and Turkish HR continued higher following led by the iron ore rally.
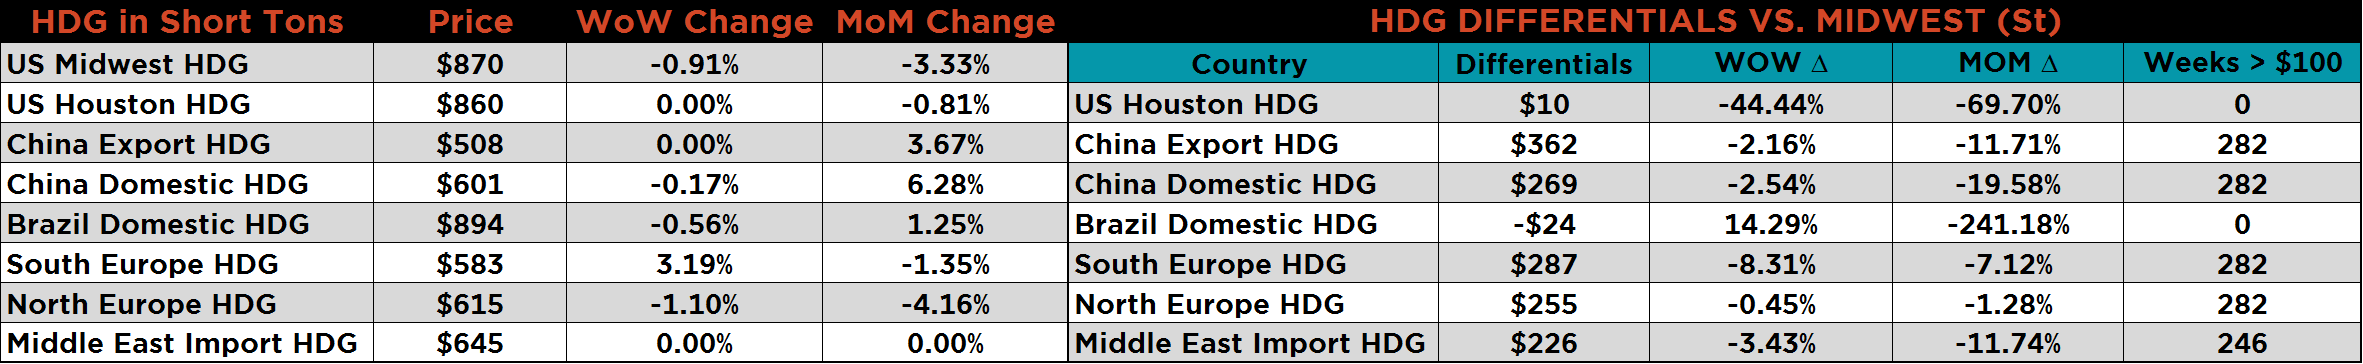
SBB Platt’s HRC, CRC and HDG WoW pricing is below. Midwest HRC moved to new recent lows, CR gained 1% and HDG dropped by 1%. Chinese, Russian and Turkish HR export prices saw nice gains while East Asian HR Import gained almost 4%. Chinese and Russian CR and HDG in Southern Europe also saw gains.
Iron ore and scrap prices reversed course last week as China returned from holiday. There were gains in pig iron, coal and busheling, a lagged result of the previous week’s increases in ore and scrap.
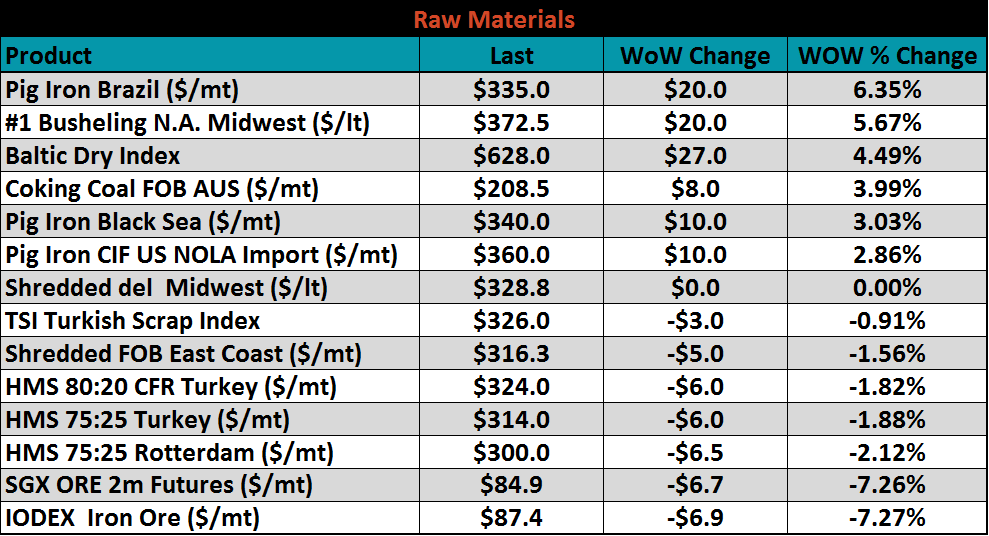
The March SGX iron ore future lost $6.70 to $84.90 while the March Turkish scrap future lost $7 to $329.00.
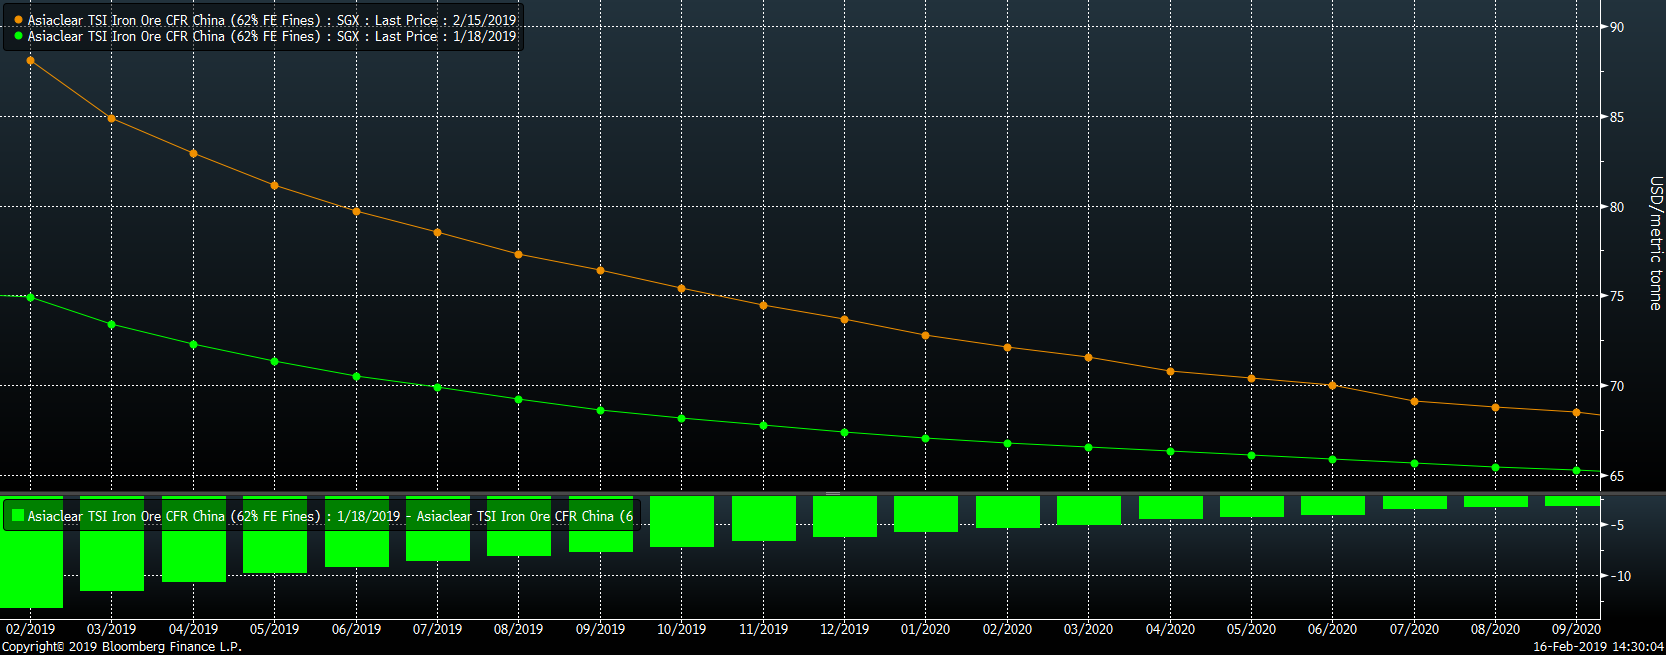
The SGX iron ore futures curve has continued to rally significantly with the front of the curve steepening.
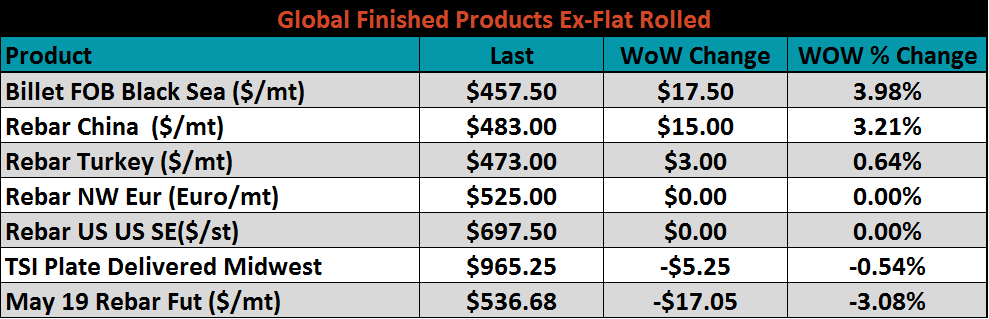
Ex-flat rolled prices shown below. Black Sea billet and Chinese rebar gained 4% and 3.2%, respectively. The May Chinese rebar future fell 3.1%.
Below are inventory levels for Chinese finished steel products and iron ore. Finished steel inventory levels are building per seasonal norms. The hot rolled and rebar inventory levels have exceeded this week’s level from 2015, 2016 and 2018.


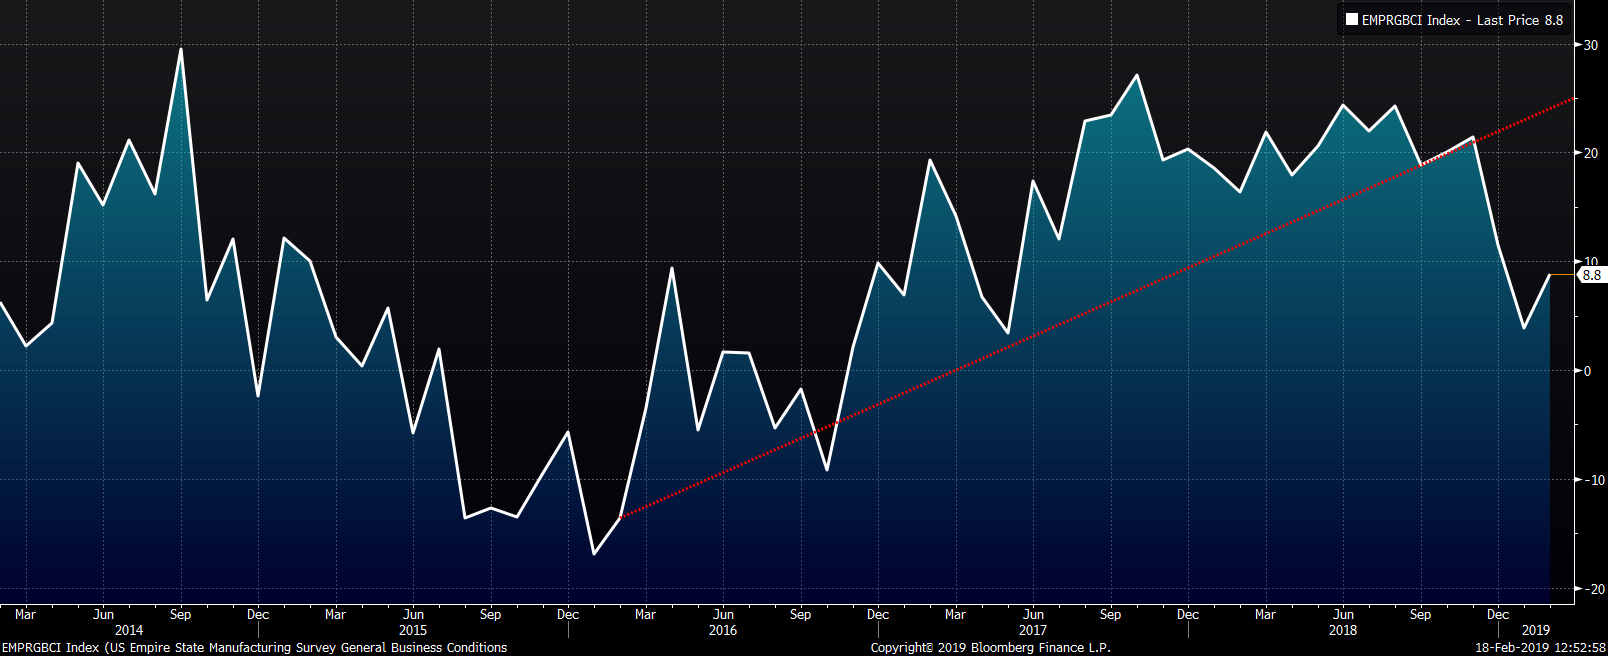
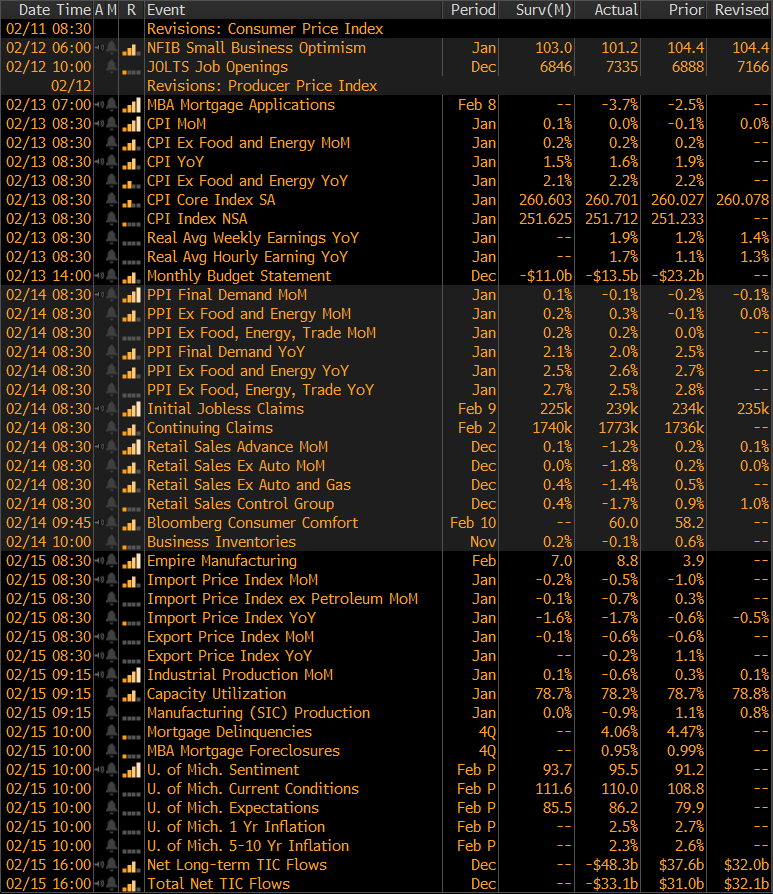
The February Empire Manufacturing Report rebounded adding 4.9 points to 8.8 and beat expectations.
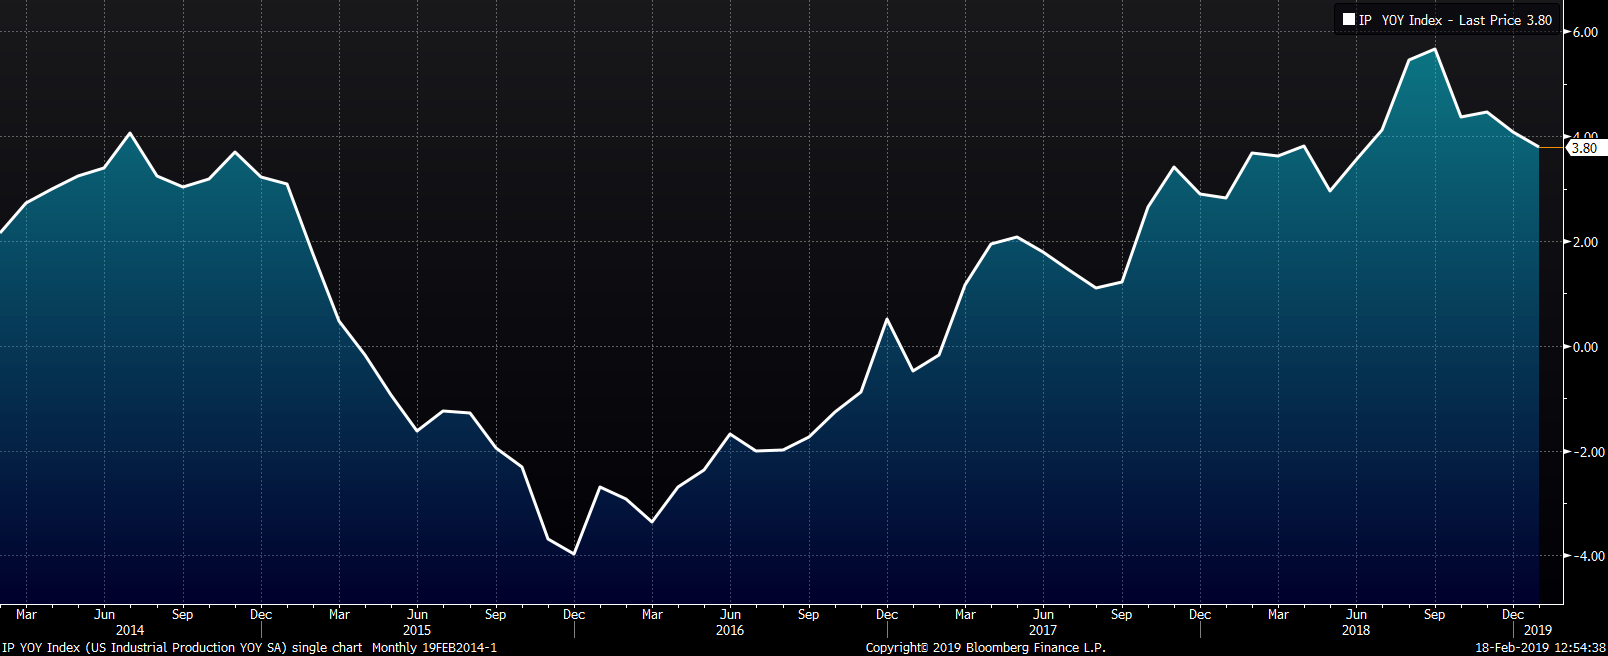
January U.S industrial production was down 0.6% MoM and December’s 0.3% MoM gain was decreased to 0.1%. YoY industrial production growth slowed to 3.8% in January.
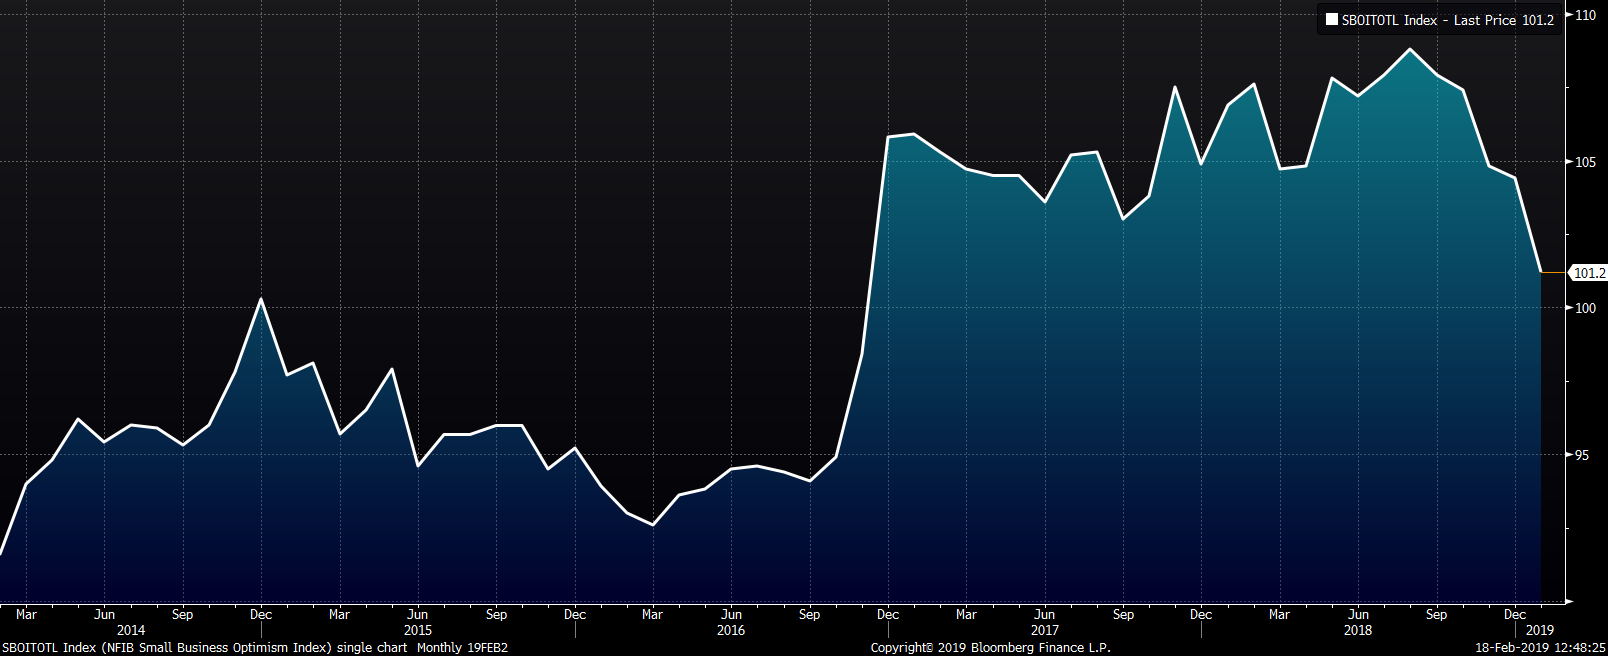
The January NFIB Small Business Optimism Index printed down 3.2 points to 101.2 missing expectations of 103.0. This is the lowest level the index has seen since November 2016.
The rest of last week’s economic data is to the right. The January CPI Ex-Food and Energy rose 2.2% YoY, just ahead of expectations for a 2.1% YoY increase. The PPI Ex-Food and Energy increased 2.6% YoY, down from 2.7% in December, but higher than the 2.5% expectations. December retail sales all fell sharply and significantly missed expectations.
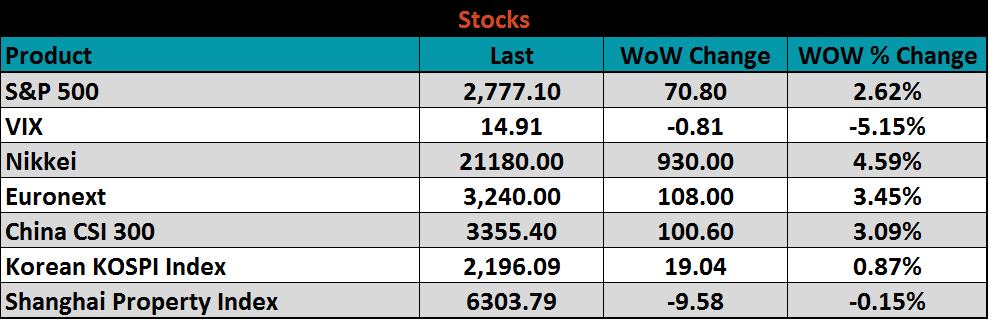
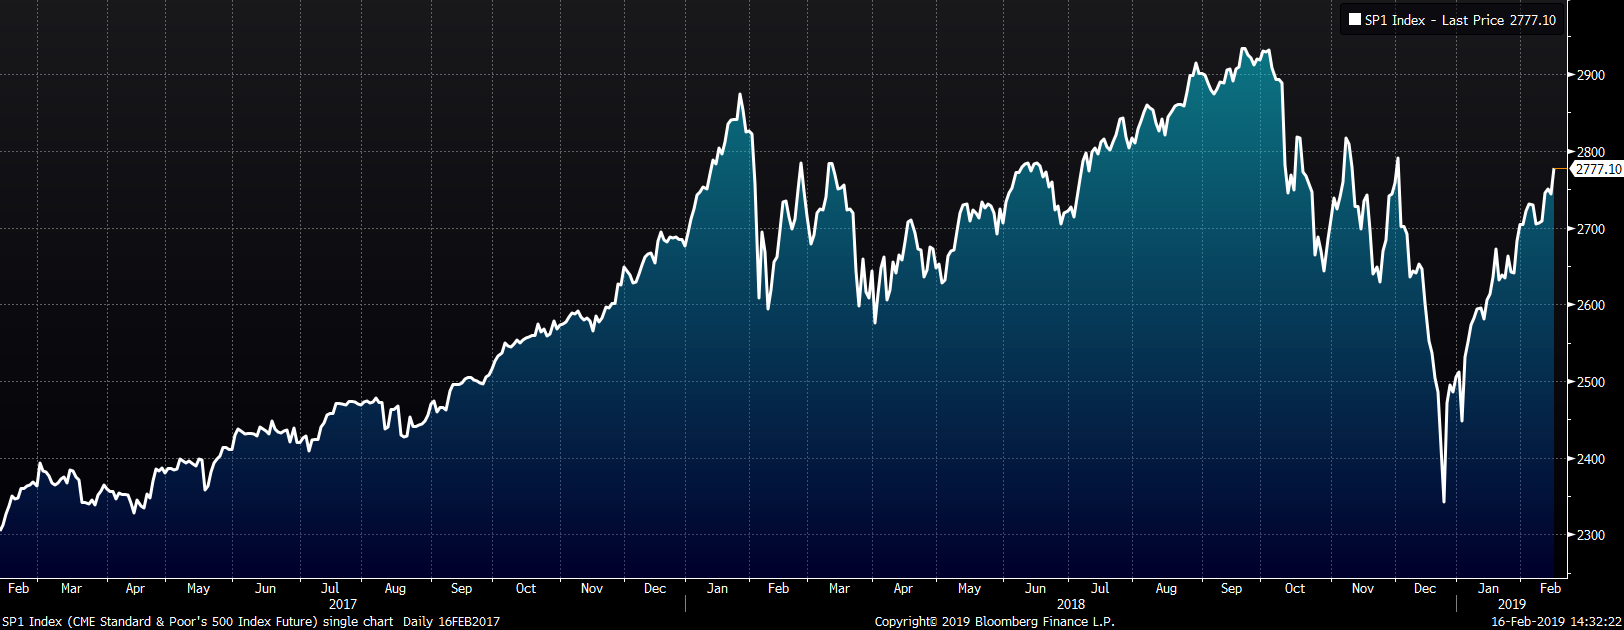
The S&P 500 was up 2.6%. Stock markets in Europe, Japan and China saw solid gains in excess of 3% for the week.
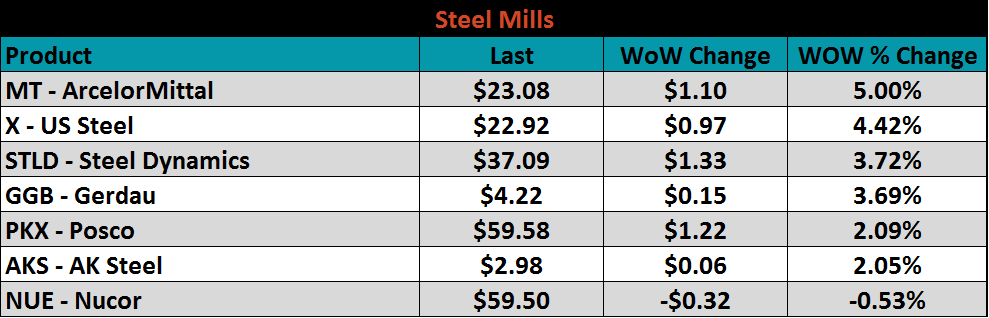
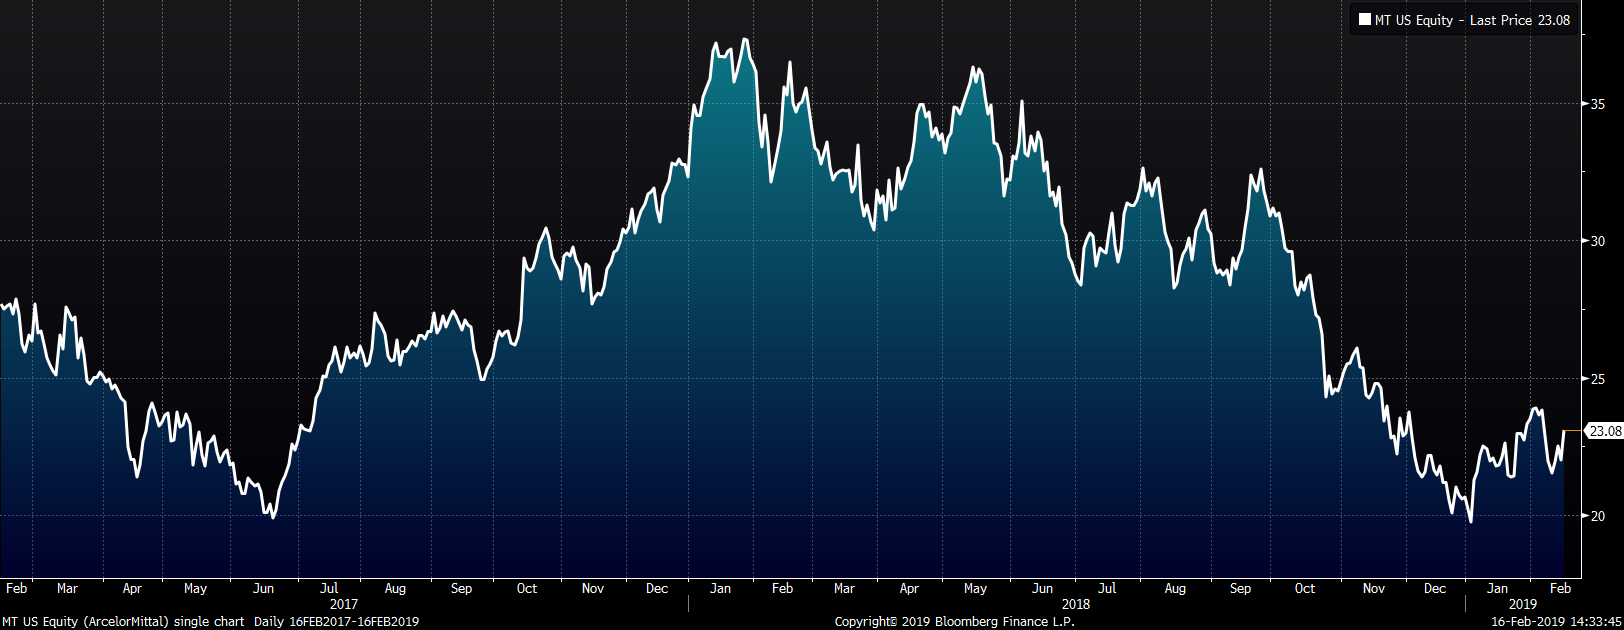
Steel mill stocks were mostly higher last week led by ArcelorMittal’s 5% gain.
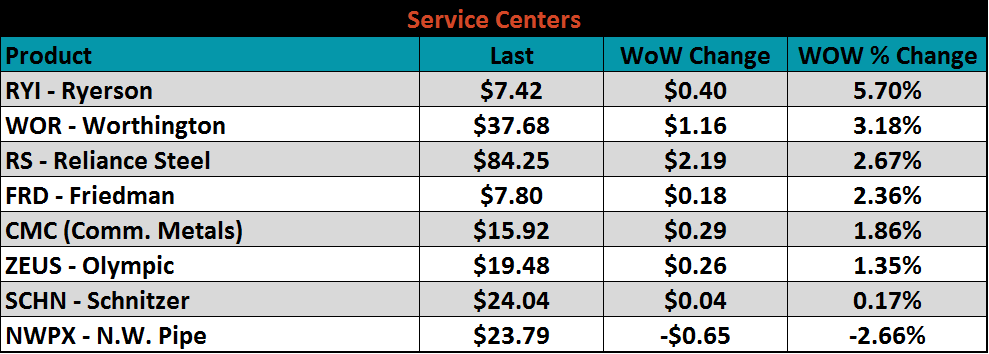
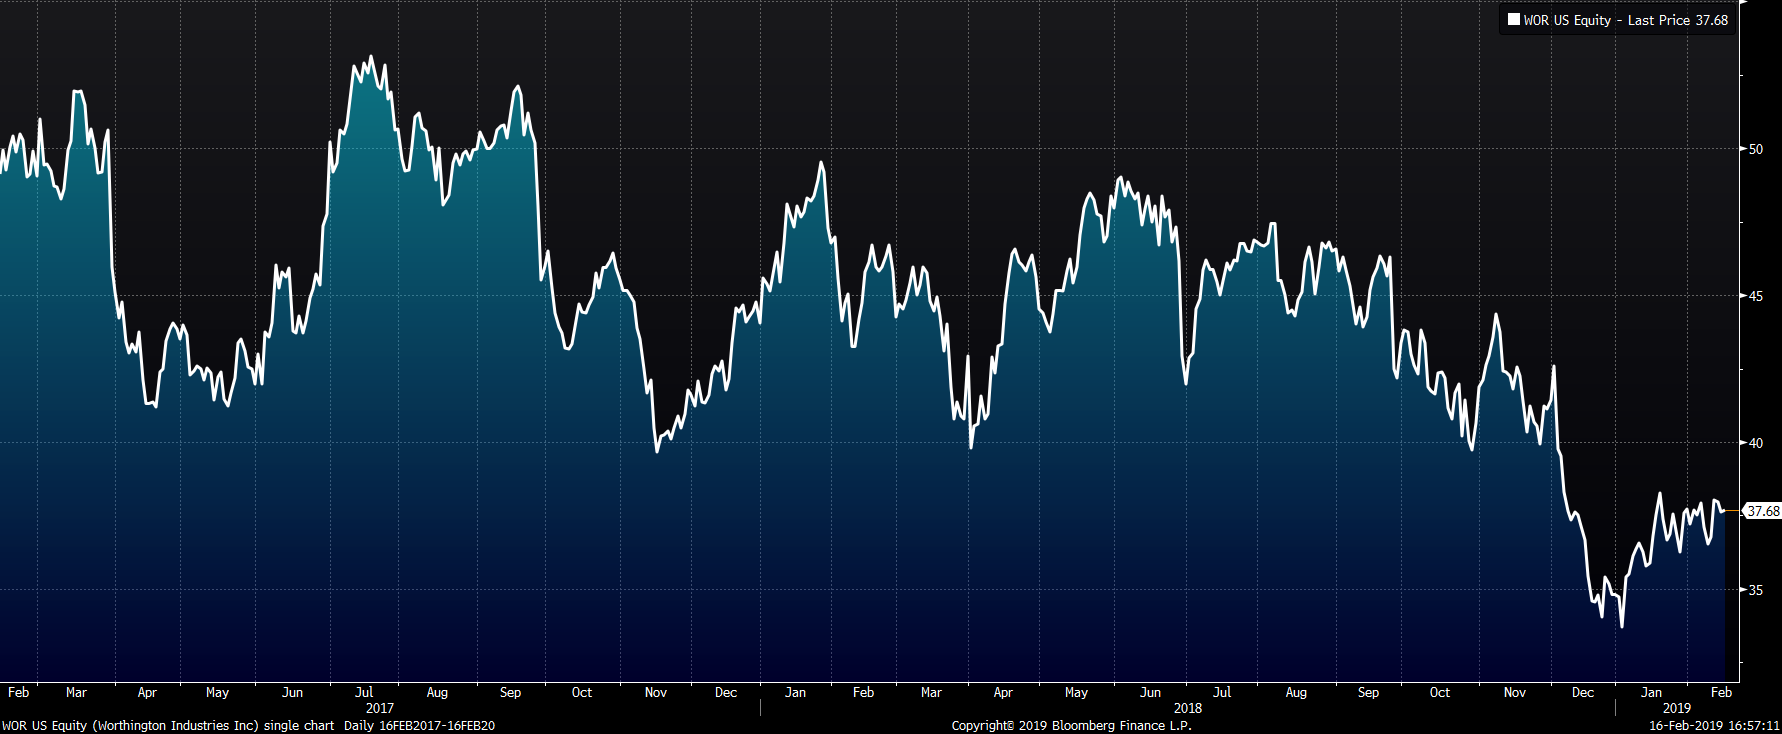
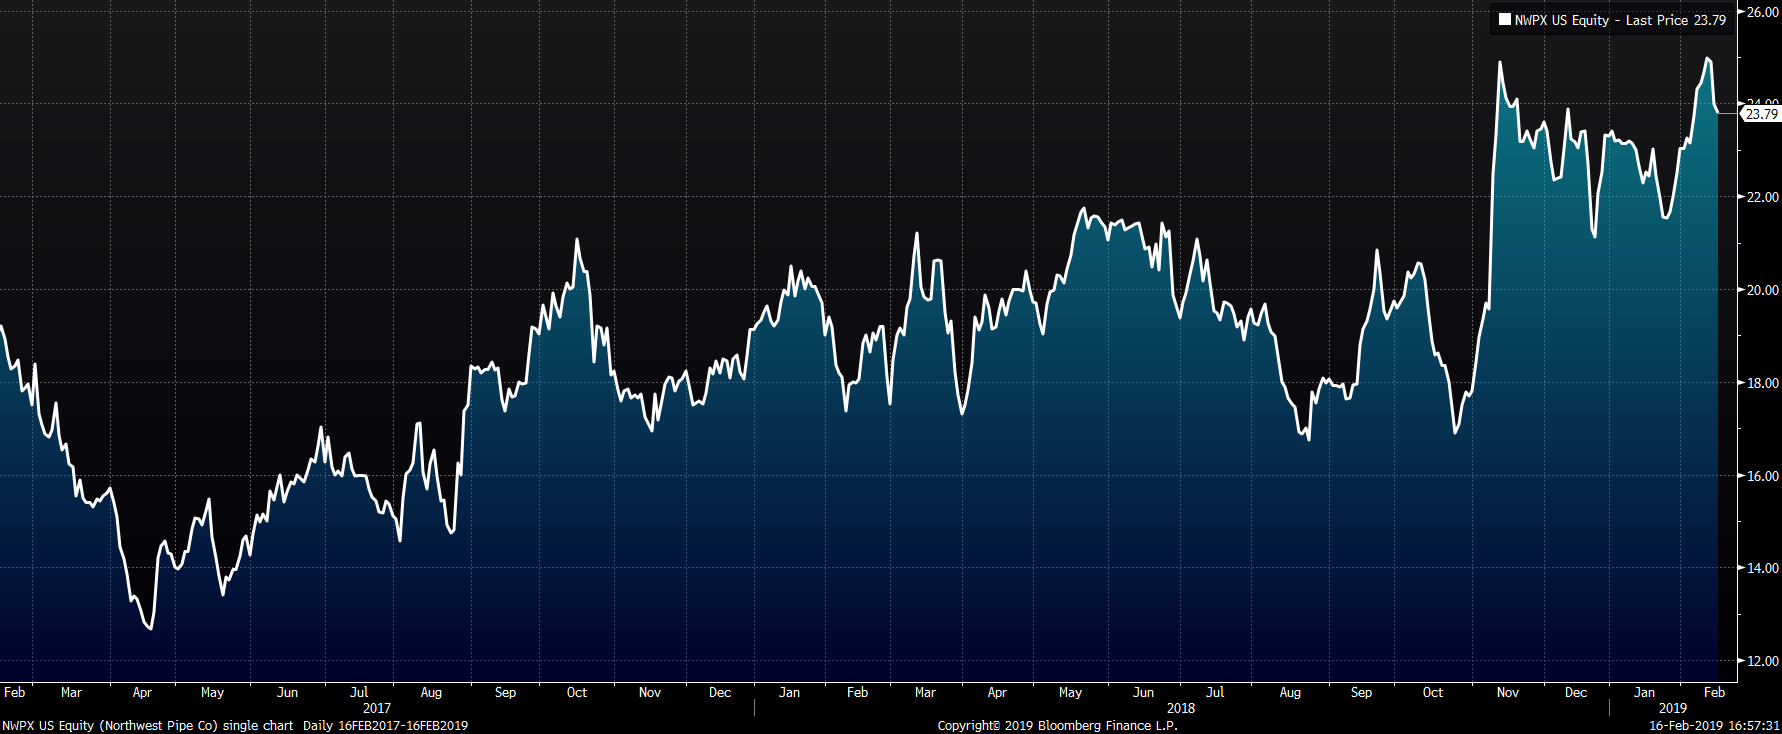
Service center stocks were mostly higher. Worthington was up 3.2%, while Northwest Pipe was down 2.7%.
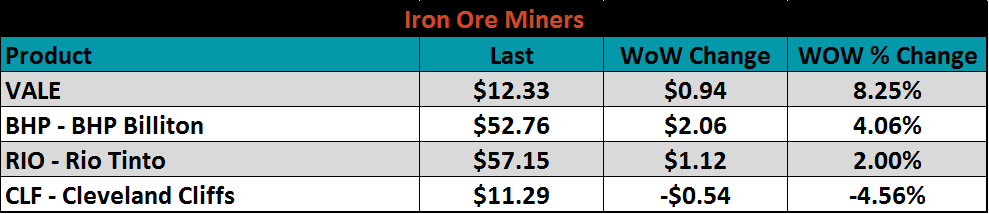
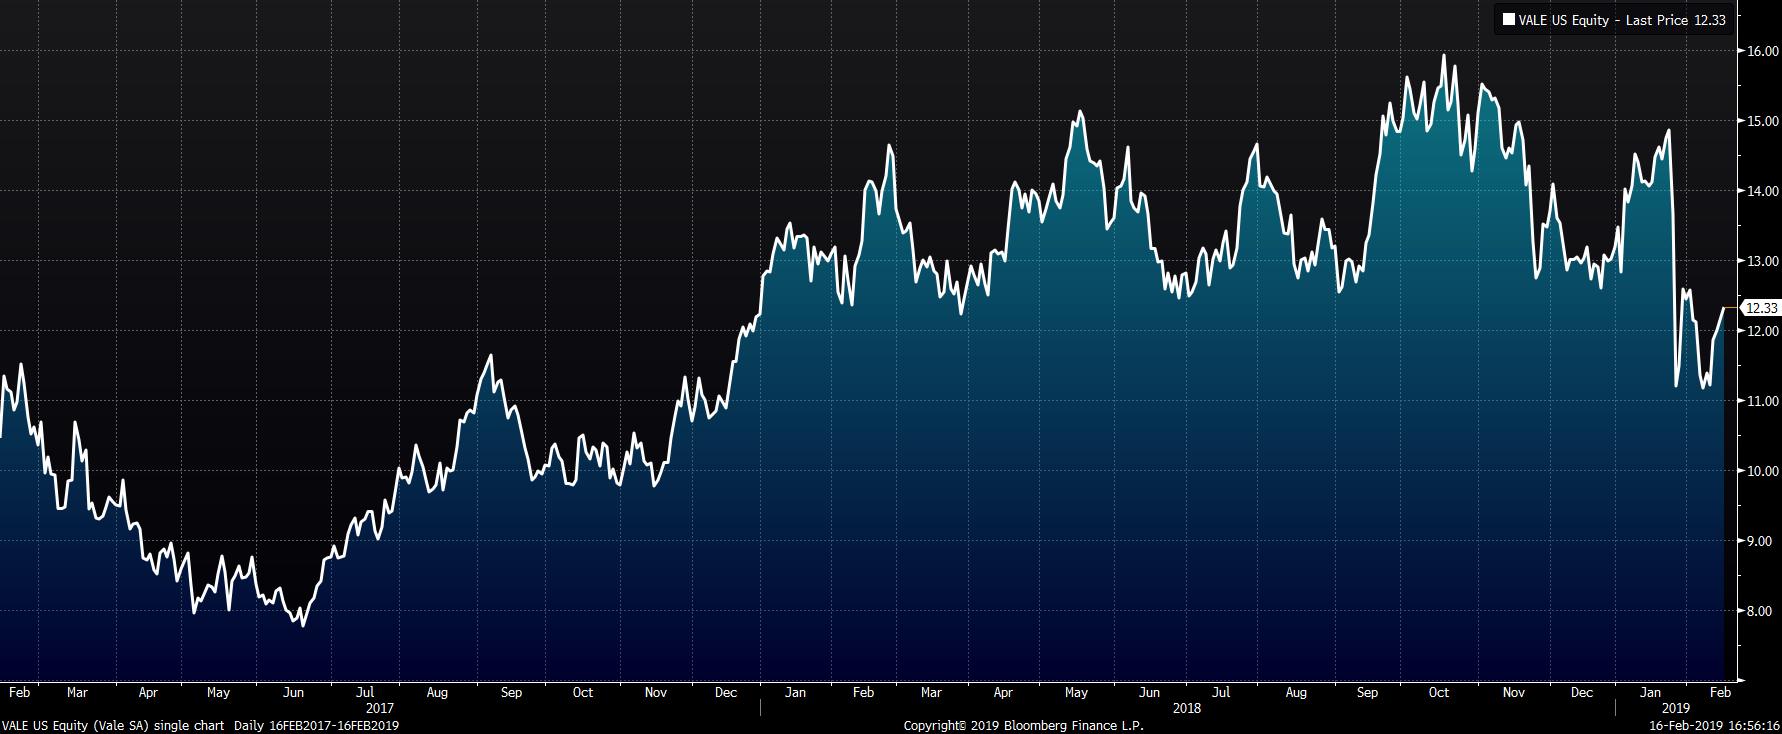
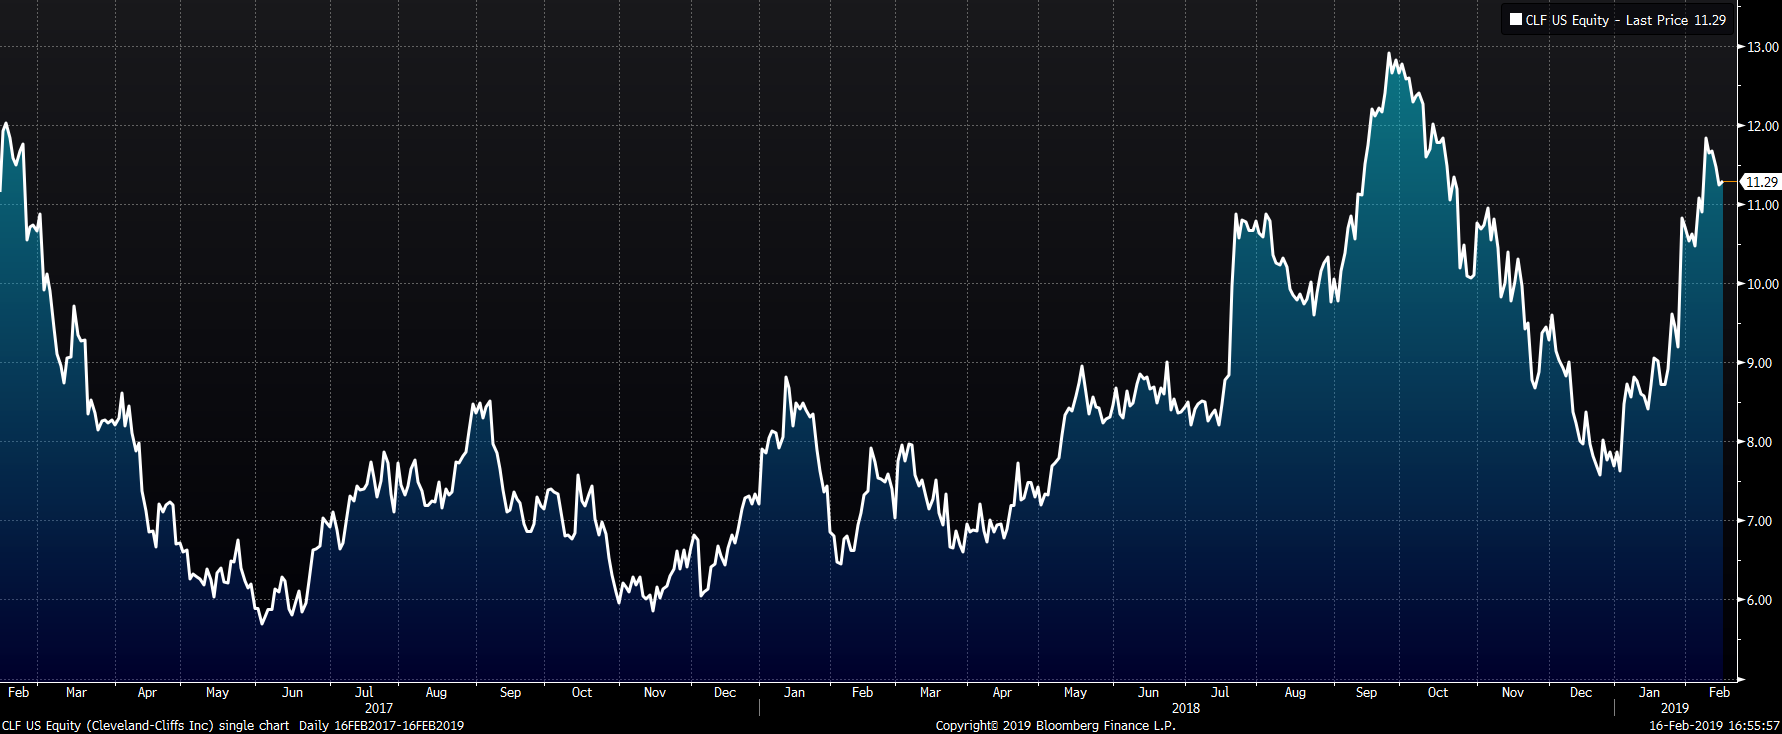
Mining’s stocks are listed below. Vale was up 8.3% bouncing back after multiple weeks of losses, while Cleveland Cliffs fell 4.6%.
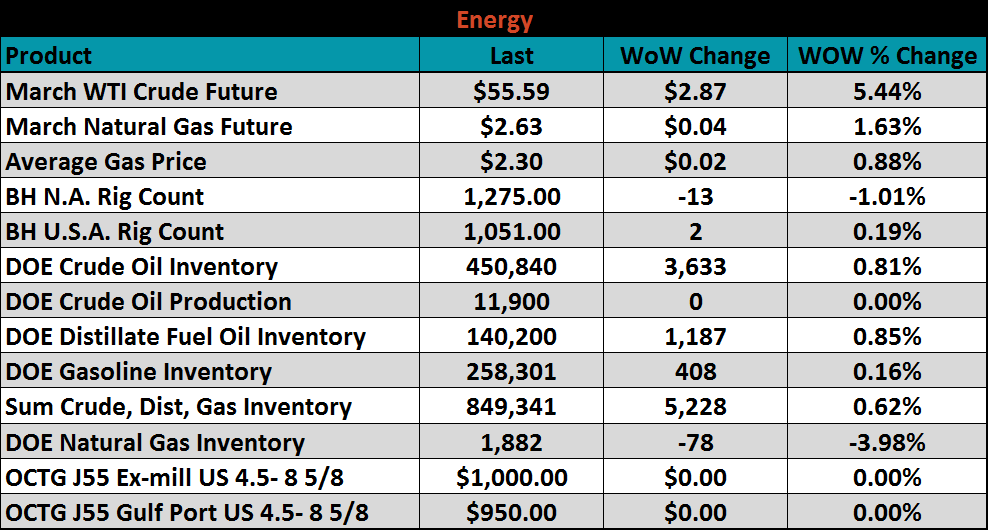
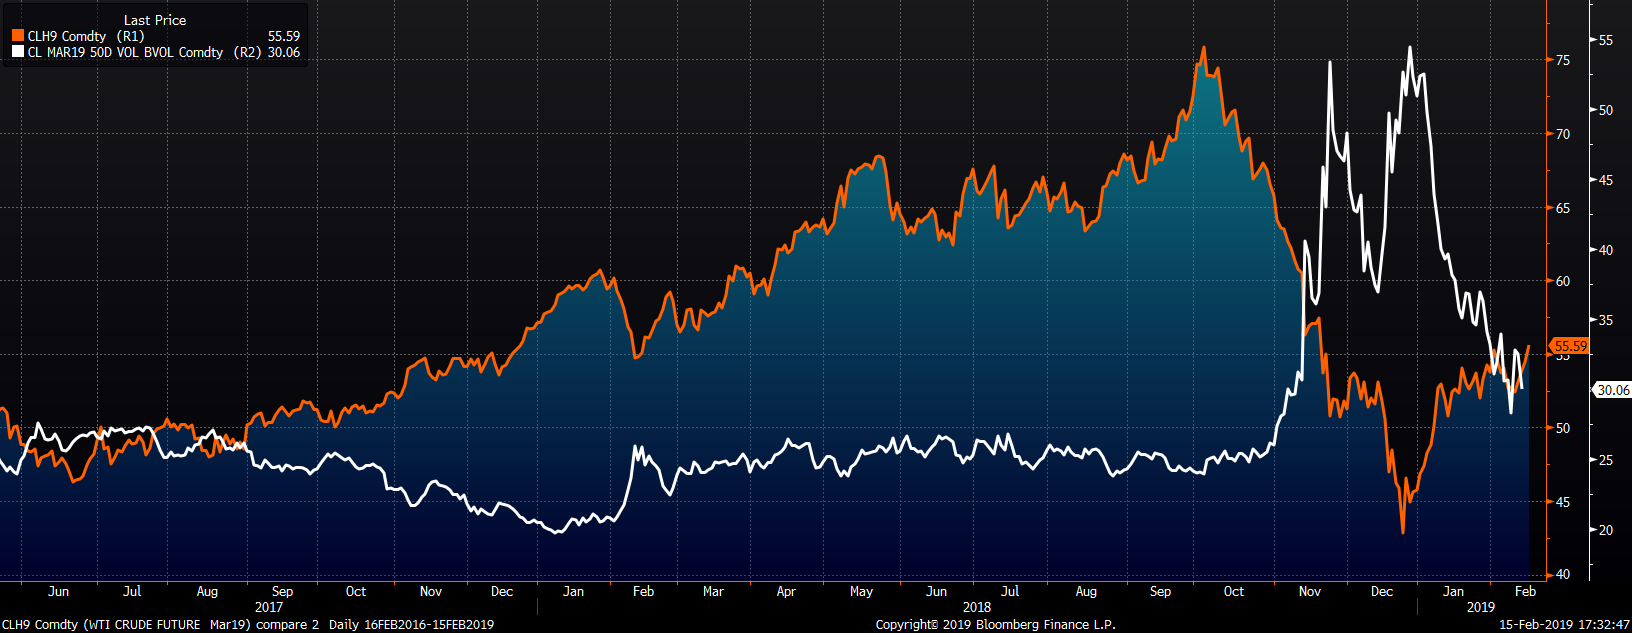
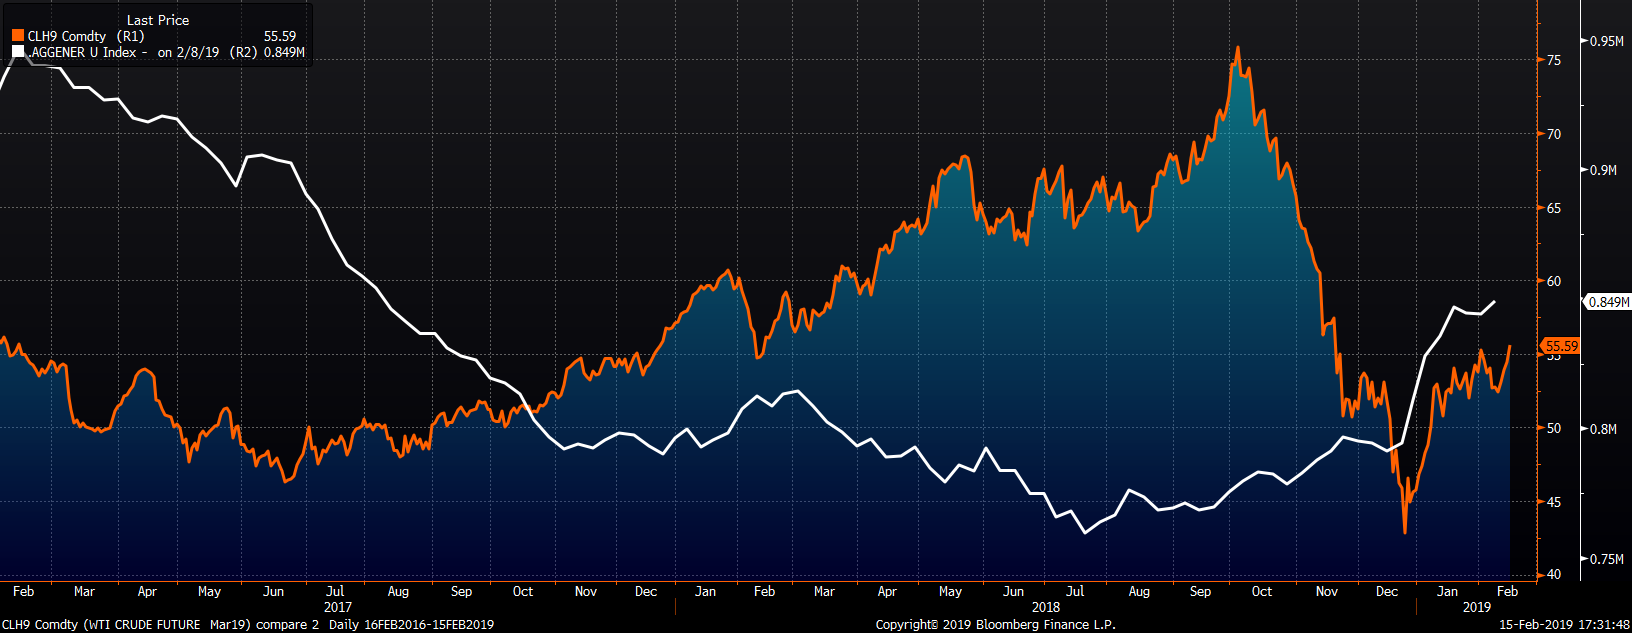
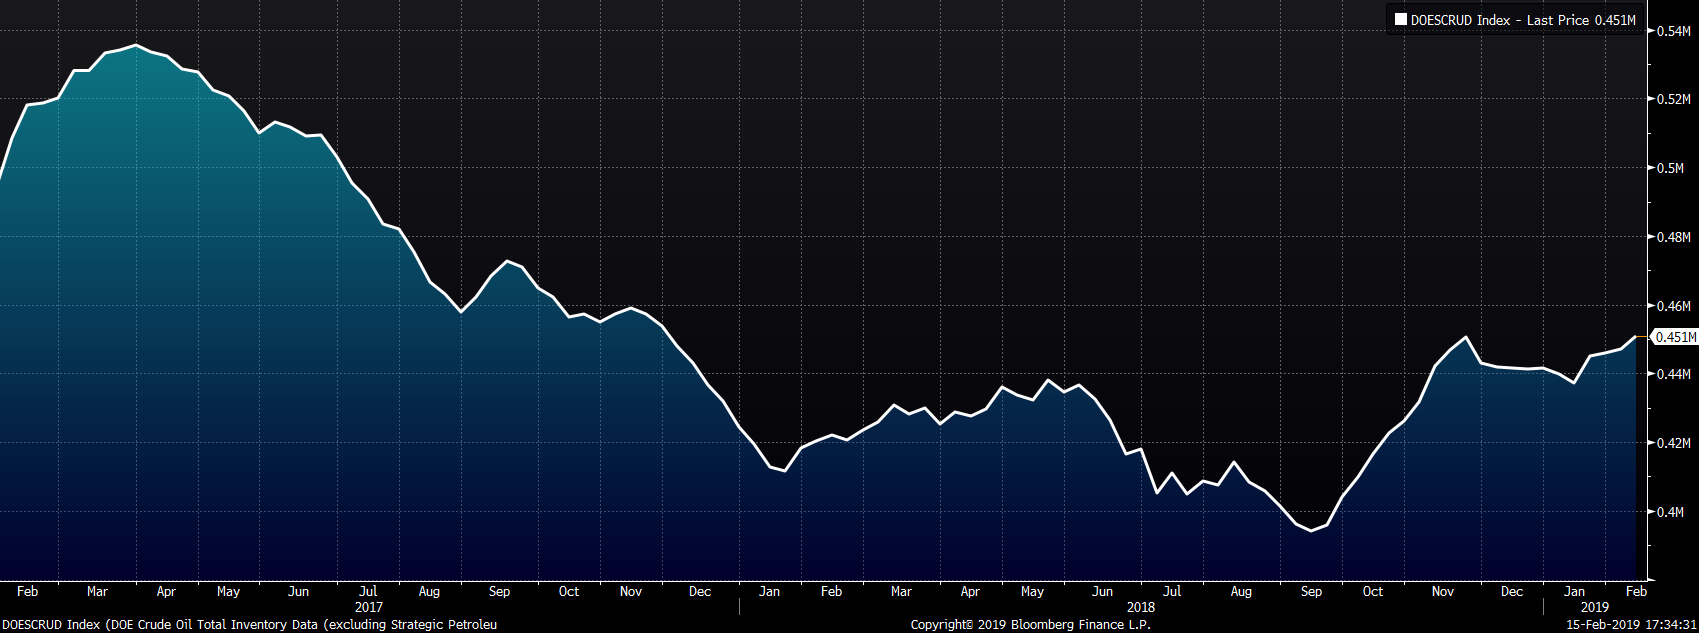
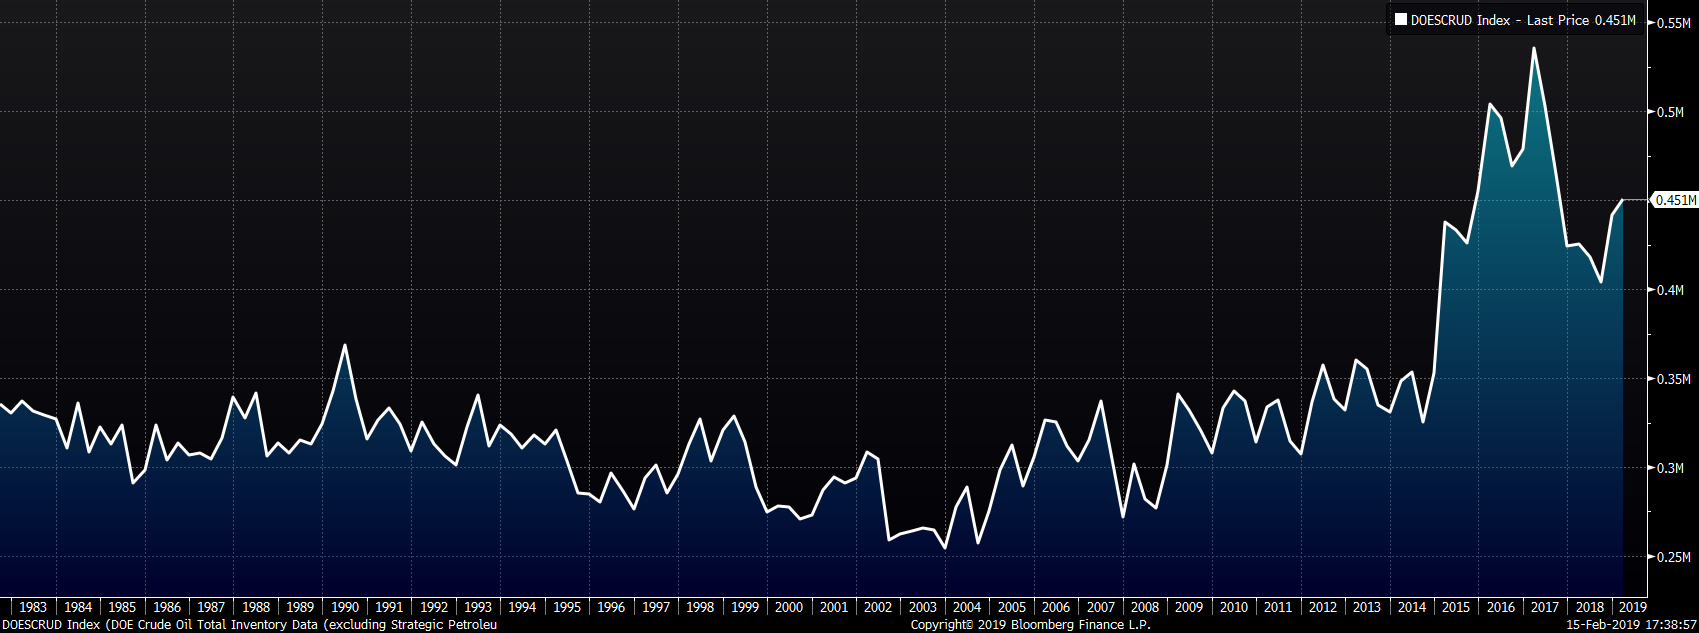
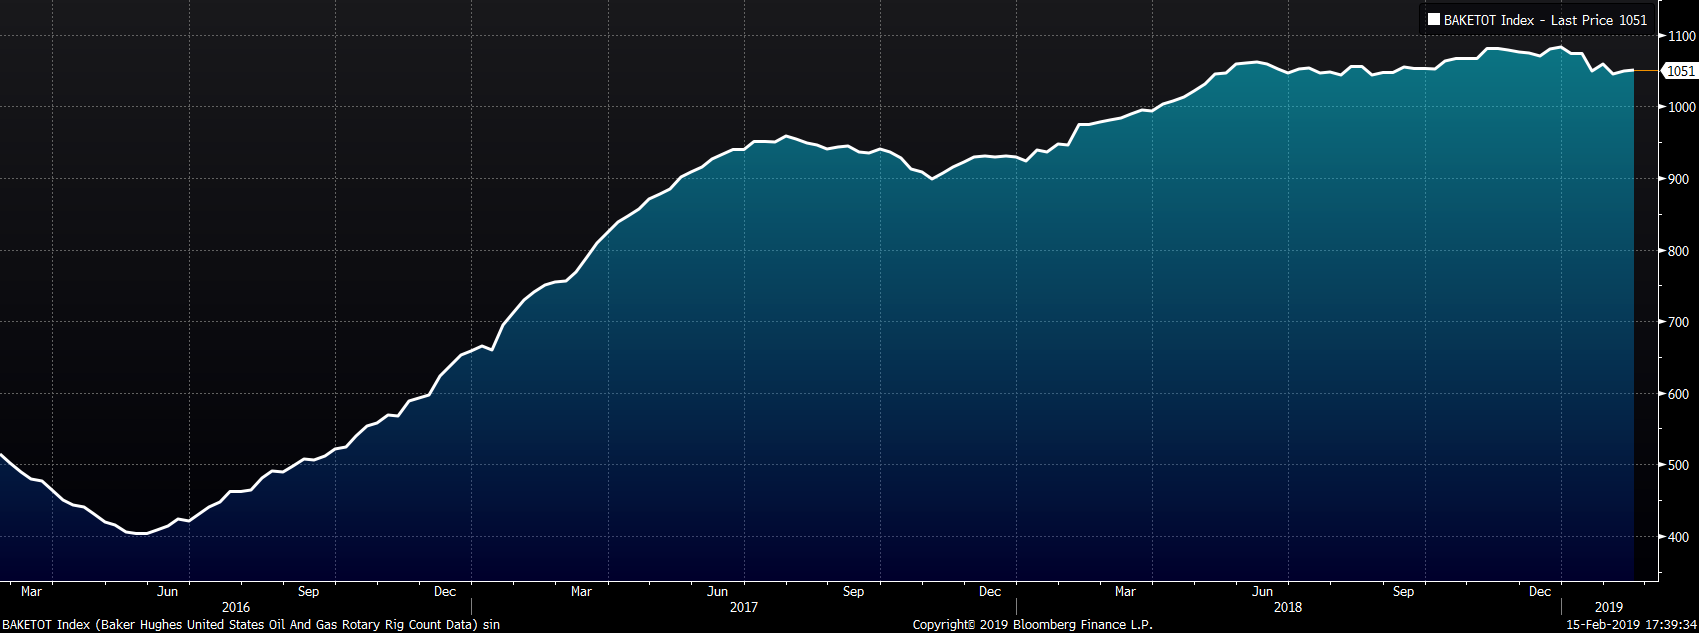
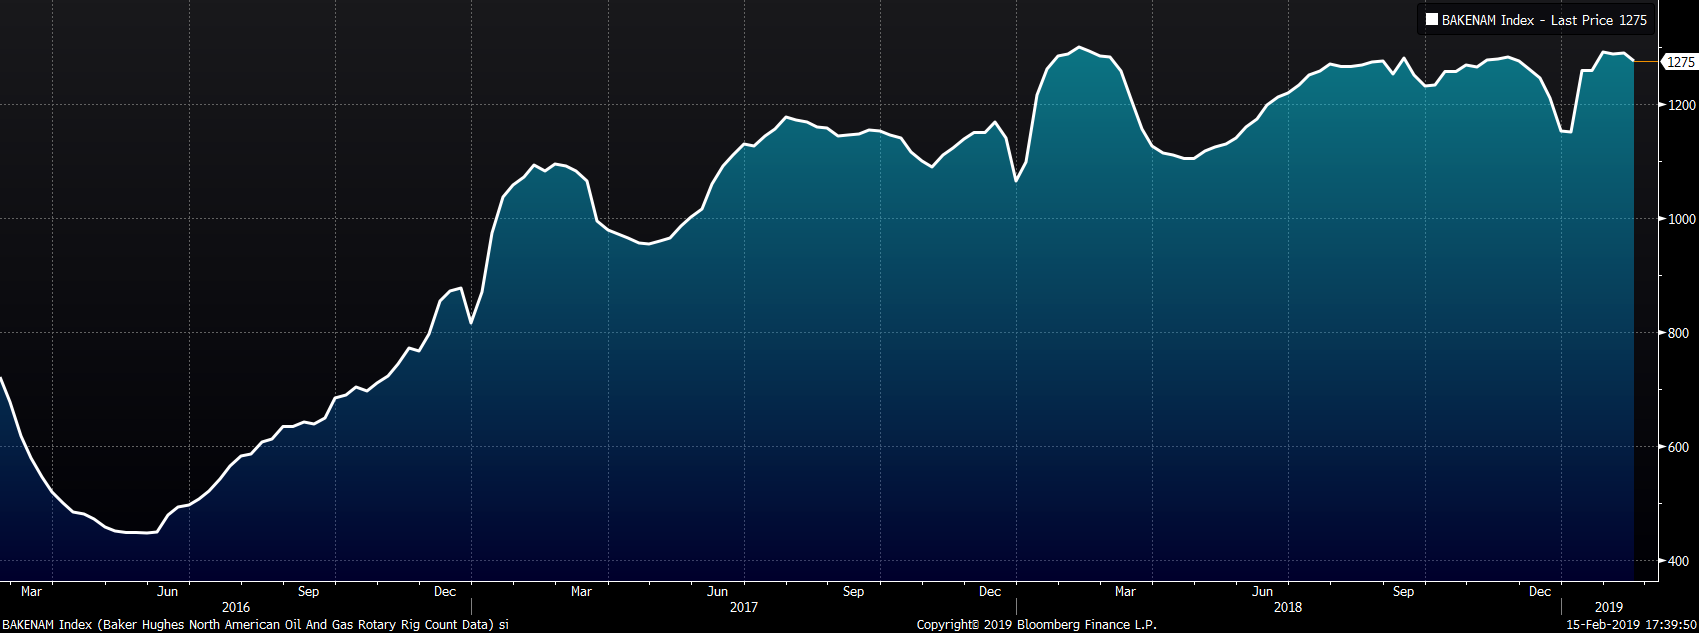
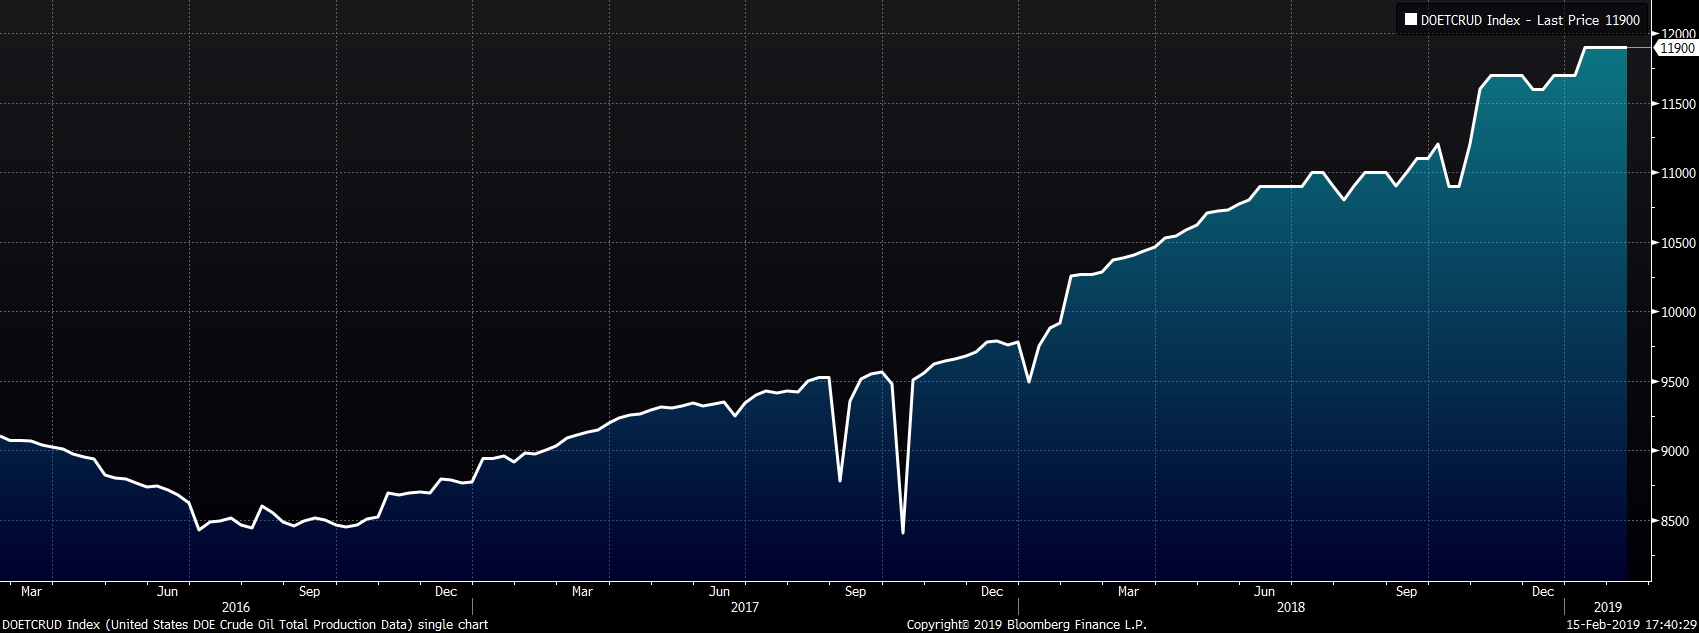
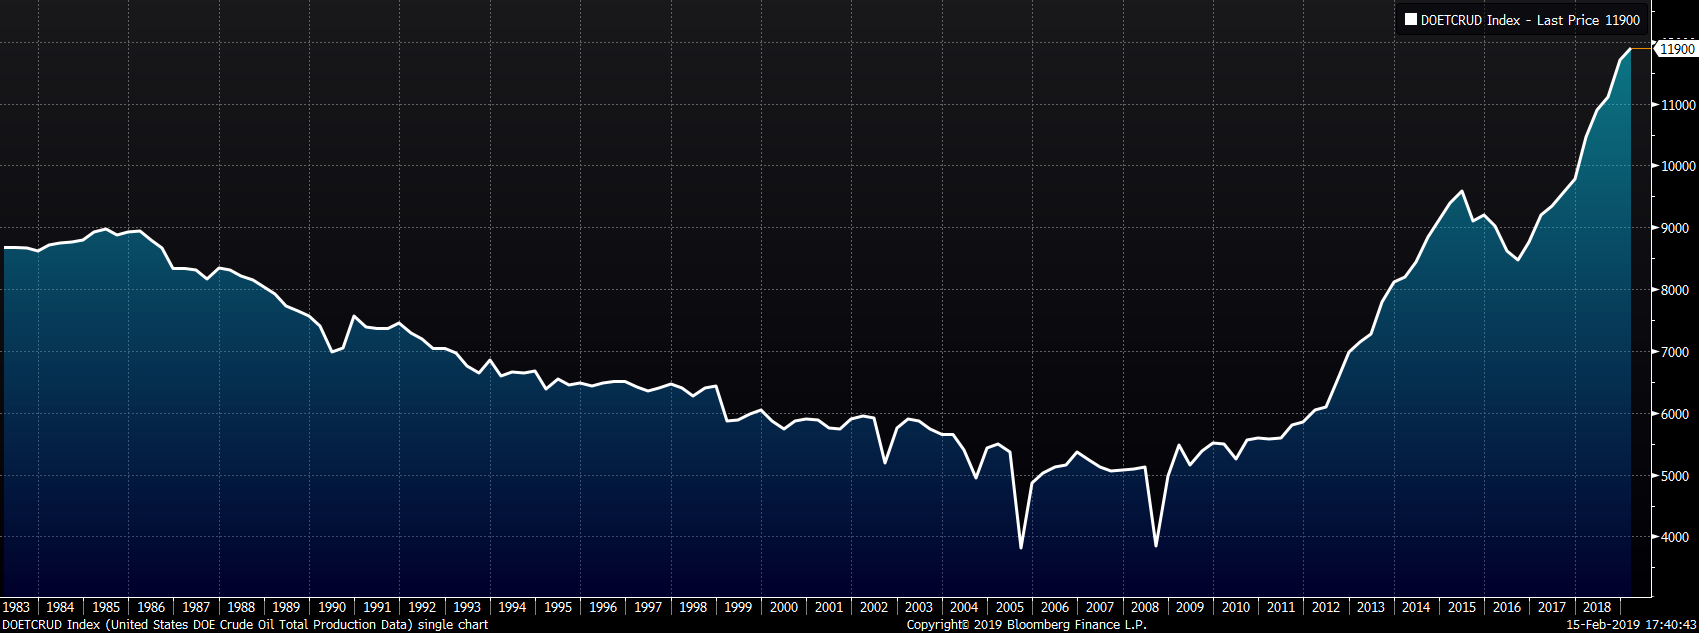
Last week, the March WTI crude oil future gained $2.87 or 5.4% to $55.59/bbl. Crude oil inventory was up 0.8% while distillate and gasoline inventories rose 0.9% and 0.2%, respectively. The aggregate inventory level rose 0.6%. Crude oil production remains at 11.9m bbl/day. The U.S. rig count added 2 rigs, while the North American rig count lost 13 rigs. The March natural gas future gained $0.04 or 1.6% to $2.63/mmBtu. Natural gas inventory fell 4%.
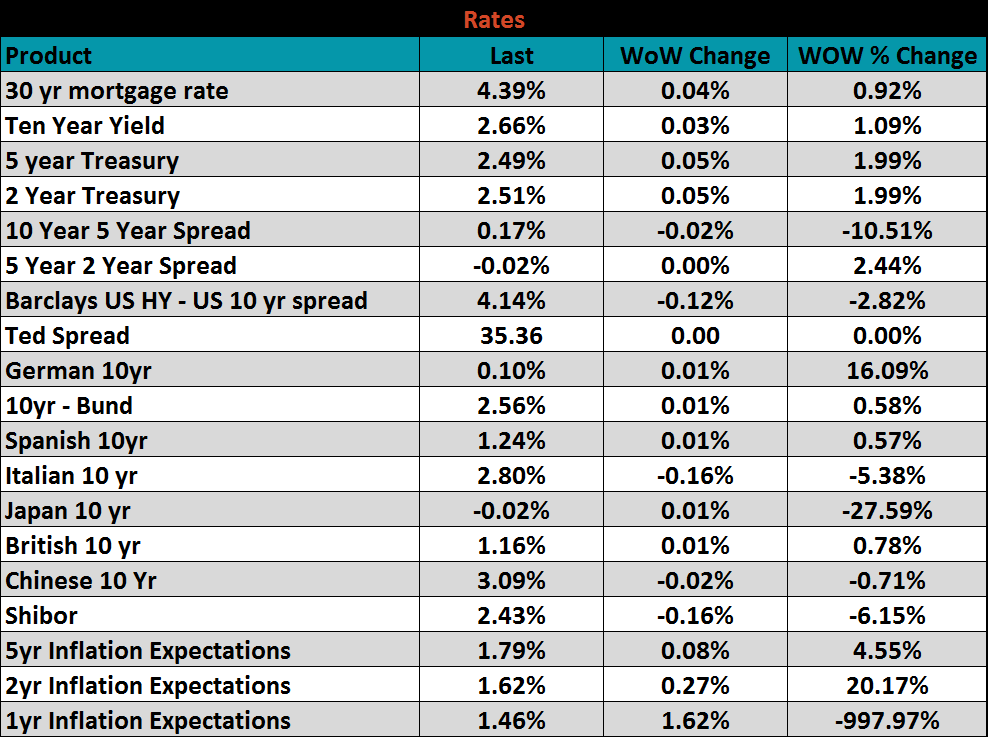
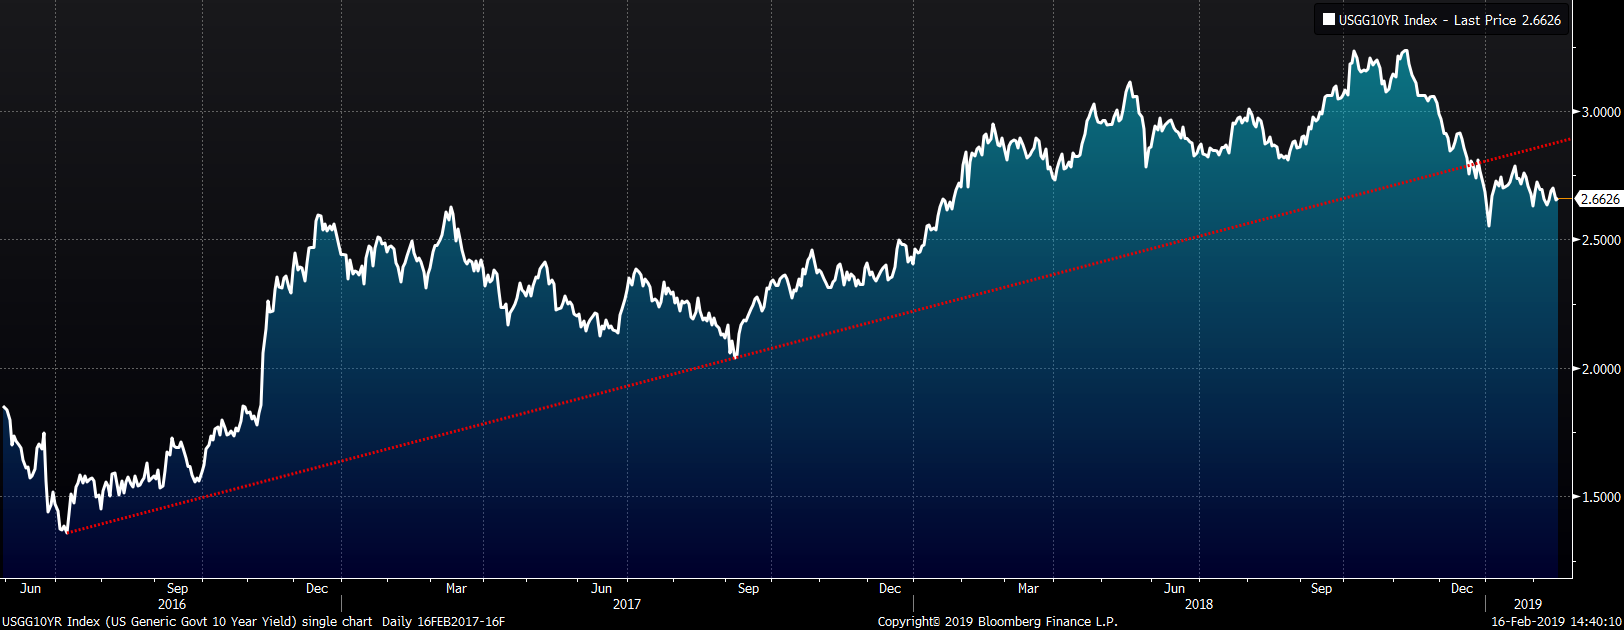
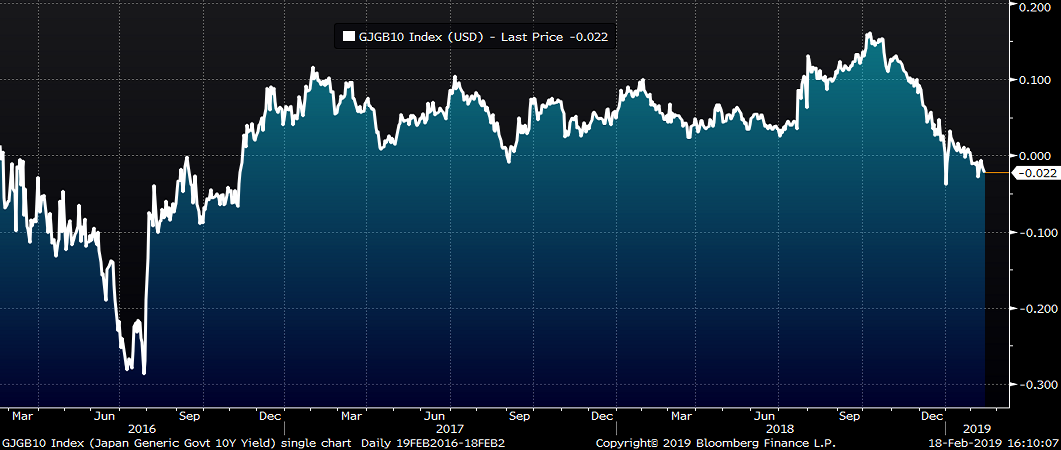
The U.S. ten-year treasury yield was up three basis points closing the week at 2.66%. The 2-year Treasury Yield settled two basis points above the 5-year yield. The yield on the Japanese 10-year bond fell to -0.02%, the first time the rate has gone negative since November 2016.
The list below details some upside and downside risks relevant to the steel industry. The orange ones are occurring or look to be highly likely.
Upside Risks:
Downside Risks: