Content
-
Weekly Highlights
- Market Commentary
- Risks


While the rate of price increases in the HRC market has slowed over the past few weeks, strength in the spot market persists, and the recent winter weather across the country is likely to support higher prices for longer. Weather related delays and power availability caused several mills across the southern United States to slow or halt production, further compounding the operational and transportation difficulties that the steel market had already been experiencing for months. This disruption, in one of the tightest steel markets in at least a decade, will put mills further behind in their order books and extend this record rally. This week, we will dive into the energy market, where the winter storms had a significant impact on supply, demand and of course, prices.
Freezing temperatures across the Southern U.S. wreaked havoc on the energy and transportation infrastructure needed to produce oil and gas, causing increased demand for power and heat that was not available. Wells, pipelines and storage facilities became inoperable, compounding the effects of the undersupplied energy market. While the crisis from this weather is hopefully a short-term, temporary incident, this is not dissimilar from the broad factors driving the steel market recently – elevated demand at a time when supply and production are limited. We have also seen the same dynamics, and commented on them in this report, across multiple other industries and commodity products. The below chart shows the Platts TSI Midwest HRC price in white and the front month rolling WTI Crude Oil future in orange.

Over the past 4 years, the two prices have reacted similarly, but have not shown a perfect correlation as energy is only one segment of domestic steel demand. Moreover, since oil prices adjusted lower at the end of 2014, the steel demand from the energy industry has represented a smaller percentage of overall demand. However, as oil prices continue to increase, it is likely that steel demand from the energy industry will grow. This relationship, fluctuating steel demand from the energy industry as oil prices change, can be seen in the chart we include on a weekly basis showing crude oil prices and rig counts. While recent gains in HRC price have significantly outpaced increases in oil prices, continued gains in energy prices will cushion any decline in the robust steel demand driven by changes in consumer spending from the pandemic. Additionally, the effects of this weather not only affect oil production, but also steelmaking and transportation. If the steel price was thought to be nearing a tipping point before these storms, this most certainly pushes out the timeline of an eventual price peak, allowing for even higher prices ahead.

Below are the most pertinent upside and downside price risks:
Upside Risks:
Downside Risks:

The Platts TSI Daily Midwest HRC Index decreased by $0.25 to $1,199.75.

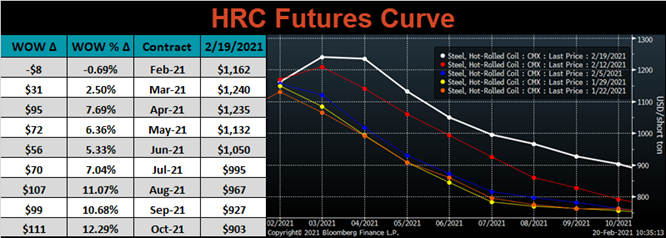
The CME Midwest HRC futures curve is below with last Friday’s settlements in white. Last week, the entire curve shifted higher, most significantly in the later expirations. The flattening curve represents the market realizing that prices could be high for a longer period of time. However, there is still a near $300 spread (backwardation) 8 months out.
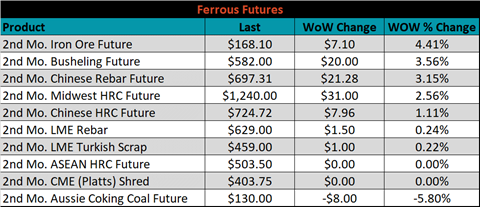
March ferrous futures were mixed. Iron ore gained 4.4%, while Aussie coking coal lost another 5.8%.
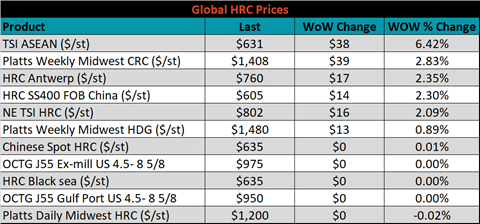
Global flat rolled indexes were unchanged or mostly higher, led by TSI ASEAN HRC, up 6.4%.
The AISI Capacity Utilization rate increased 1.7% to 76.9%.


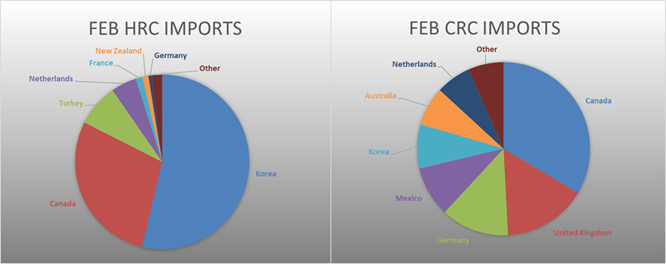
February flat rolled import license data is forecasting an increase of 71k to 660k MoM.

Tube imports license data is forecasting an increase of 49k to 279k in February.


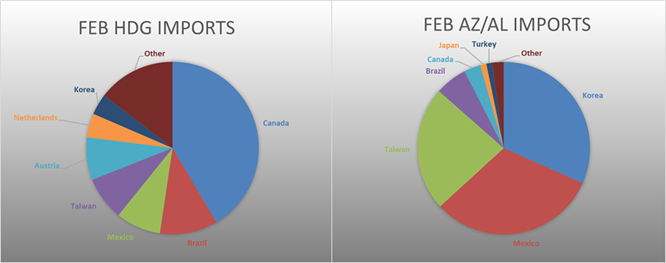
February AZ/AL import license data is forecasting a decrease of 6k to 44k.

Below is January import license data through February 16, 2021.


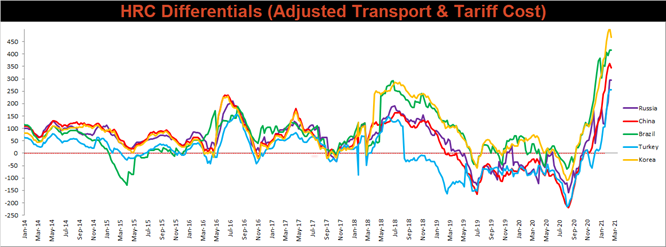
Below is the Midwest HRC price vs. each listed country’s export price using pricing from SBB Platts. We have adjusted each export price to include any tariff or transportation cost to get a comparable delivered price. The watched countries differentials all decreased, with the U.S. HRC price slightly lower and global prices showing moderate strength.
SBB Platt’s HRC, CRC and HDG pricing is below. The Midwest CRC and HDG prices were up 2.8% and 0.9%, respectively, while the HRC price was essentially flat. Globally, the East Asian HRC import price was up, 6.4%.


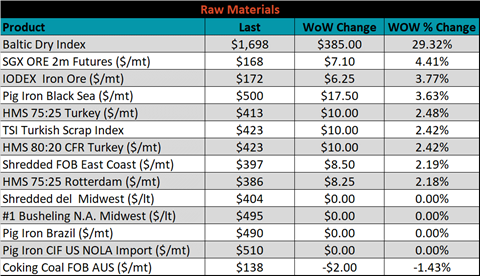
Raw material prices were mostly higher, led by iron ore futures, which gained another 4.1%, while Aussie coking coal was down another 1.4%.
Below is the iron ore future curve with Friday’s settlements in orange, and the prior week’s settlements in green. Last week, the entire curve increased further.

The ex-flat rolled prices are listed below.


Below are inventory levels for Chinese finished steel products and iron ore. HRC and Rebar inventories continue to increase dramatically while the 5-city inventory was not updated again due to the Lunar New Year. Iron ore inventories increased as well but remains at the lowest seasonal level of the last 6 years.


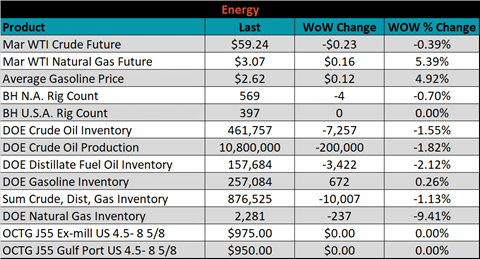
Last week, the March WTI crude oil future lost $0.23 or 0.4% to $59.24/bbl. The aggregate inventory level was down 1.1% and crude oil production decreased to 10.8m bbl/day. The Baker Hughes North American rig count was down 4 rigs, and the U.S. rig count was unchanged.


The list below details some upside and downside risks relevant to the steel industry. The orange ones are occurring or look to be highly likely. The upside risks look to be in control.
Upside Risks:
Downside Risks: