Content
-
Weekly Highlights
- Market Commentary
- Risks


Over the last week, fundamentals in the domestic ferrous market strengthened. We saw prices stabilize, with many of the spot indexes sitting at or above the $570 level. Sentiment in the market also improved with the forward curve moving higher by $15-20, raw material prices strengthening and encouraging manufacturing data releases. Below is a chart comparing the regional manufacturing reports to the national ISM PMI index.
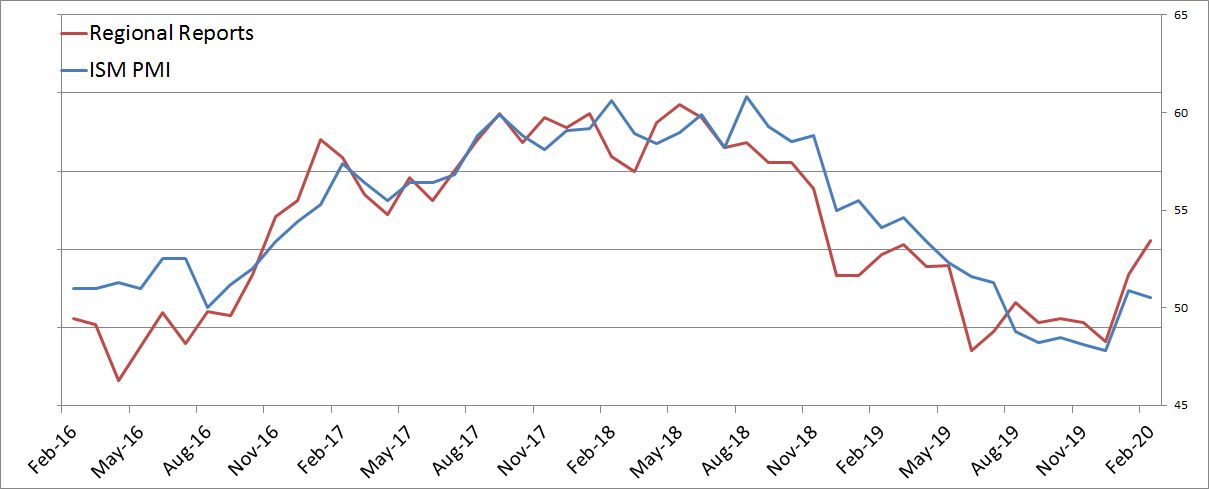
With four of the six regional reports released for February (and market expectations for the remaining two reports), the index of regional reports shows further recovery is expected in next week’s national PMI report. This is an indicator that manufacturing demand is continuing to strengthen from the low levels in the second half of 2019. This bodes well for the ferrous pricing outlook, especially with low inventory levels across the supply chain.
So with the above constructive fundamental backdrop, why are prices not moving higher? If you have followed other financial markets over the last few days, you have seen the hysteria around the recent spread of the coronavirus outside of China. Fear of the virus spreading further and the associated demand destruction has swept headlines and pressured most risk assets. Moreover, there is an extreme amount of uncertainty surrounding the virus about diagnoses accuracy, vaccines and duration. If this panic turns into a pandemic and last for several weeks or months, we will see the effects in the domestic steel market, specifically the automotive supply chain. If automakers cannot get necessary parts from abroad, it will halt production, leaving a sizable gap in steel demand. This will leave the market oversupplied and weigh on prices, despite otherwise strong fundamentals.
Effects of the coronavirus pose a risk within the steel market, even though prices have not reacted accordingly. However, there also is upside risk should coronavirus fears subside quickly. Fortunately, the market has the ability to hedge this risk, in both directions depending on business type, through the forward curve.
Below are the most pertinent upside and downside price risks:
Upside Risks:
Downside Risks:
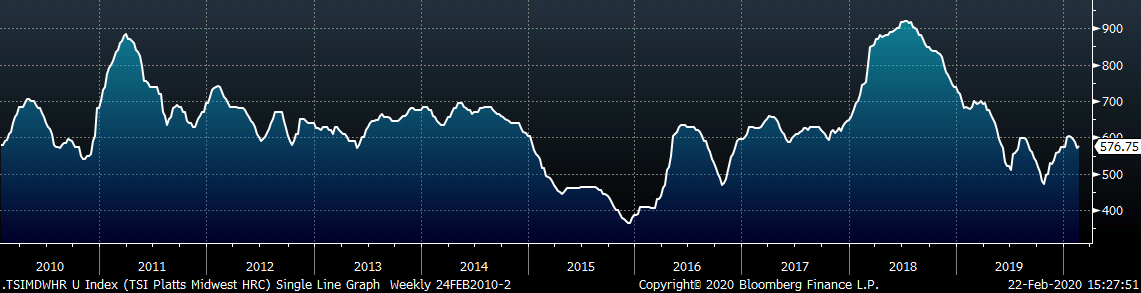
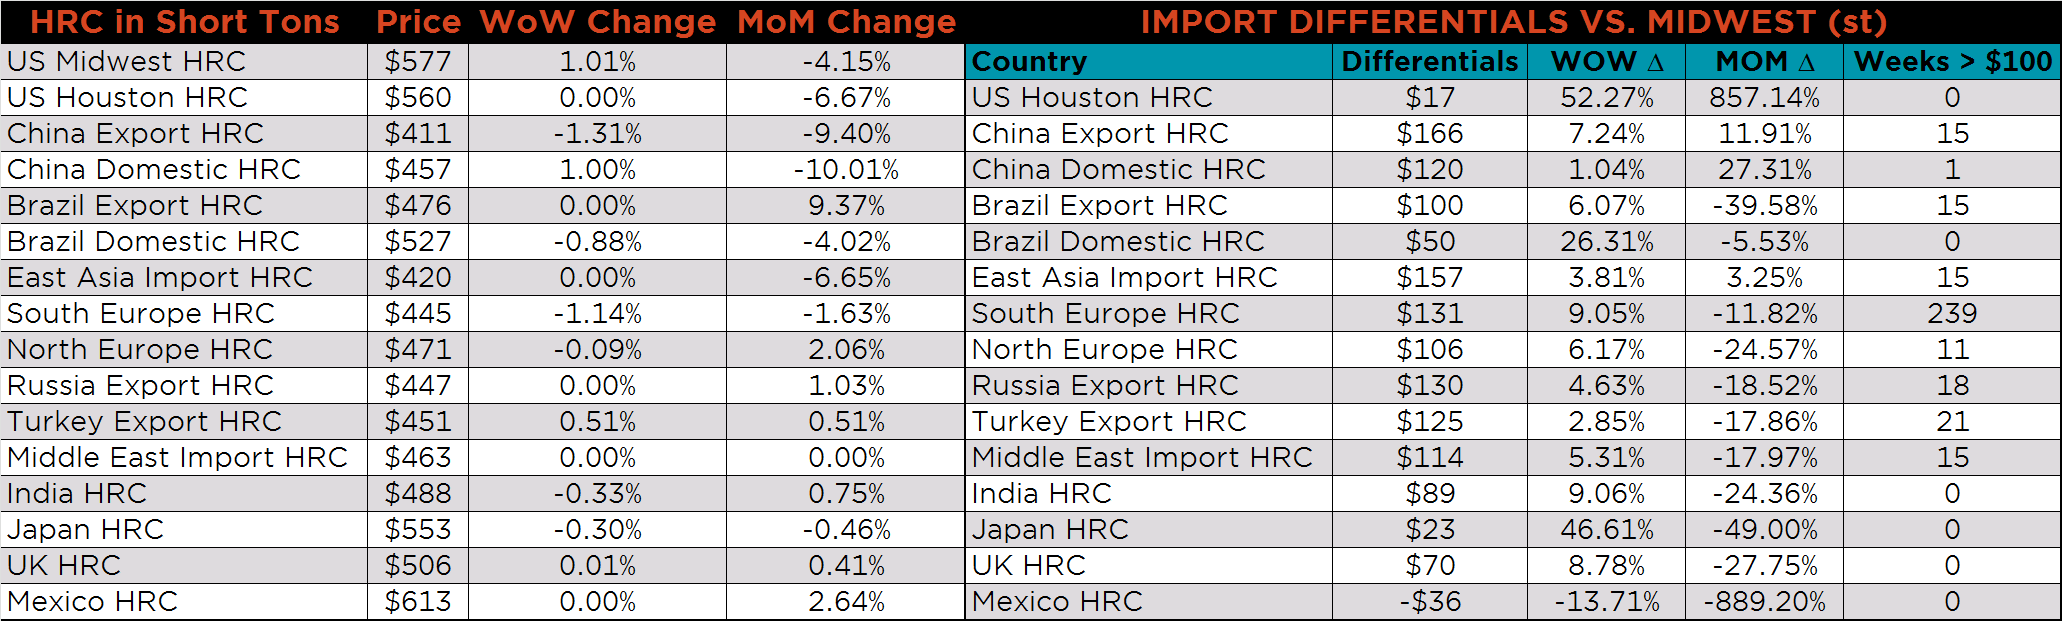
The Platts TSI Daily Midwest HRC Index was up $5.75 to $576.75.
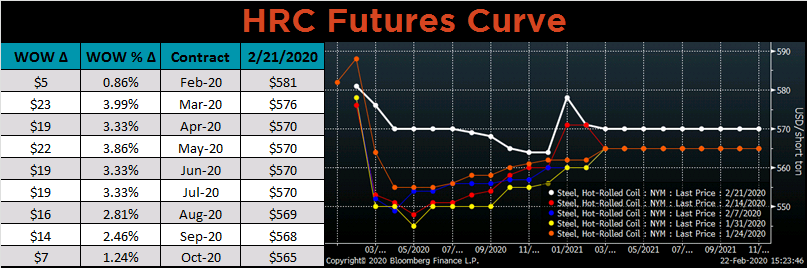
The CME Midwest HRC futures curve is below with last Friday’s settlements in white. The entire curve shifted higher, most significantly in the front.
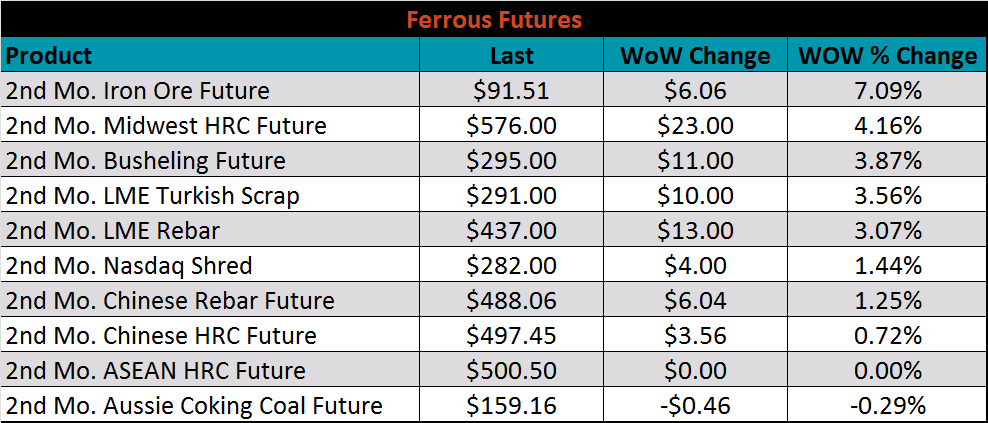
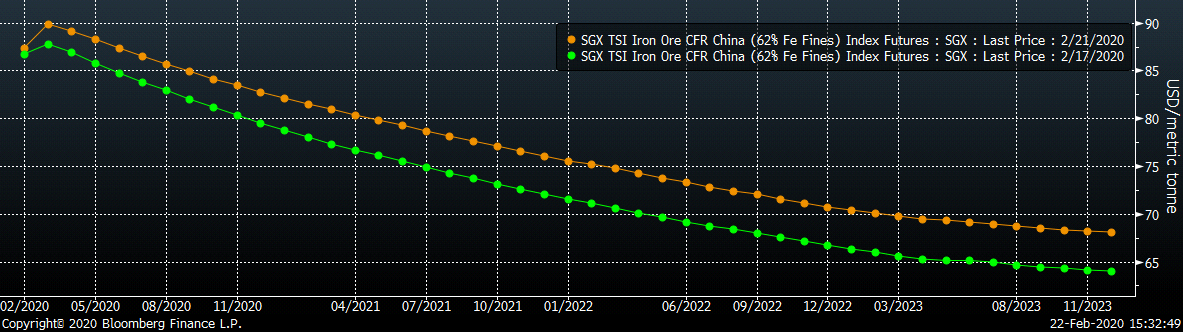
March ferrous futures were all higher. The iron ore future gained 8.9%.
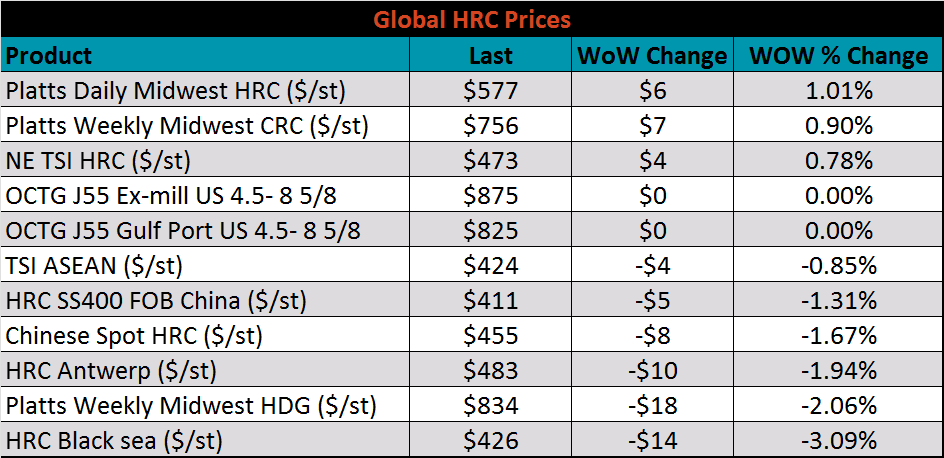
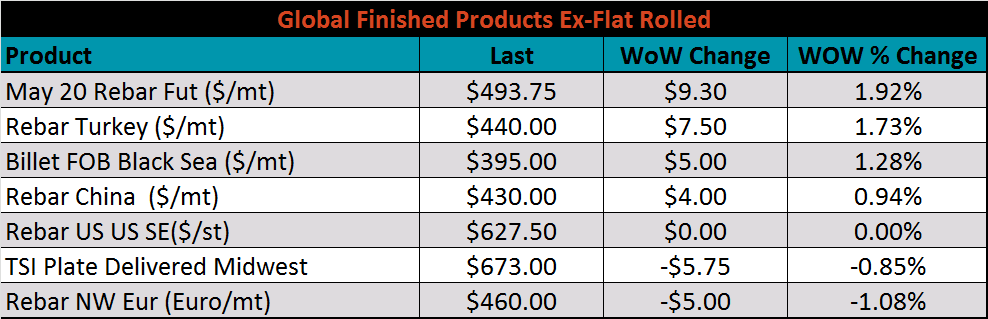
The global flat rolled indexes were mixed. Platts Daily Midwest HRC was up 1%, while Black Sea HRC was down 3.1%.
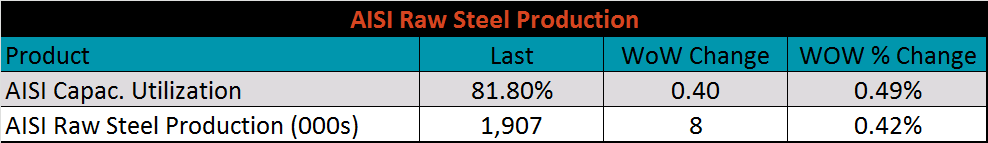
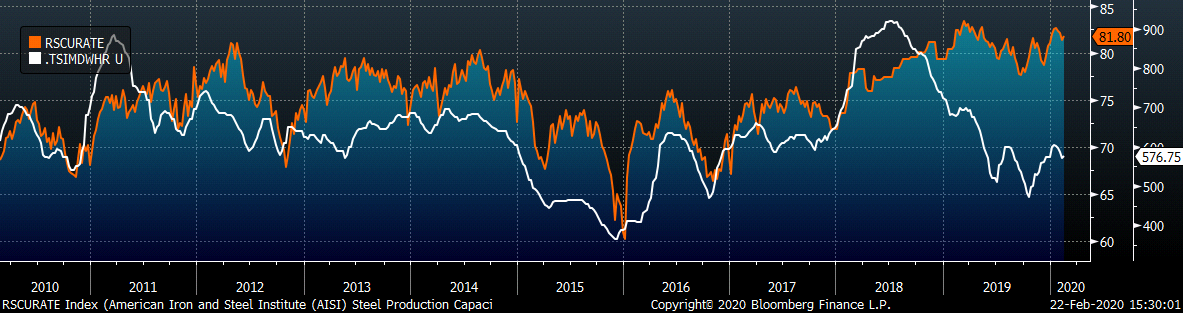
The AISI Capacity Utilization Rate was up 0.4% to 81.8%.
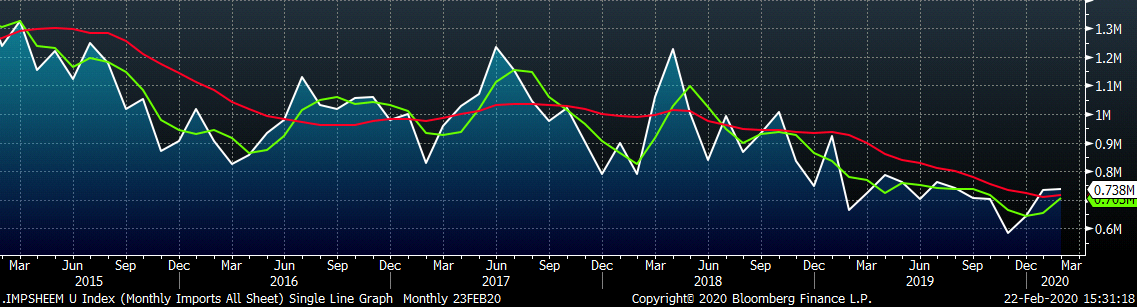
February flat rolled import license data is forecasting an increase of 4k to 738k MoM.
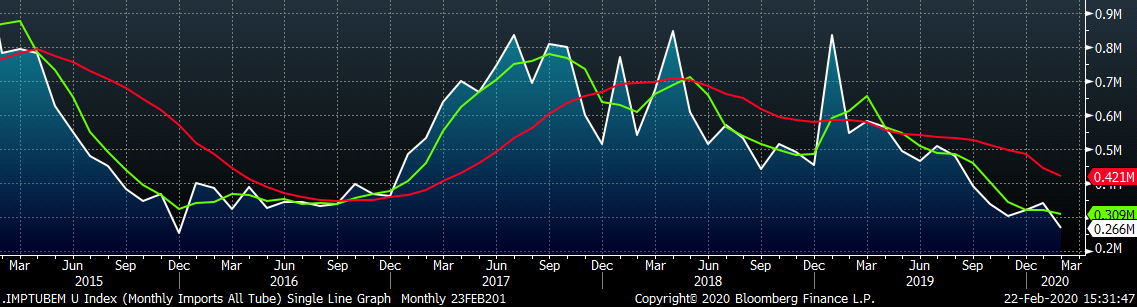
Tube imports license data is forecasting a MoM decrease of 75k to 266k tons in February.
AZ/AL import license data is forecasting an increase of 2k in January to 68k.
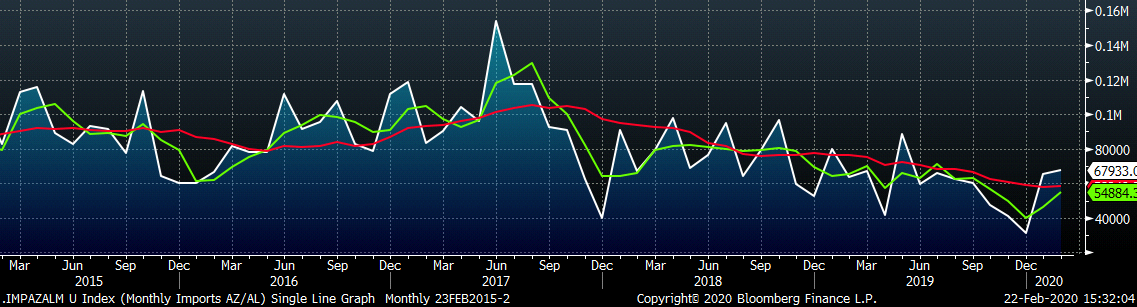
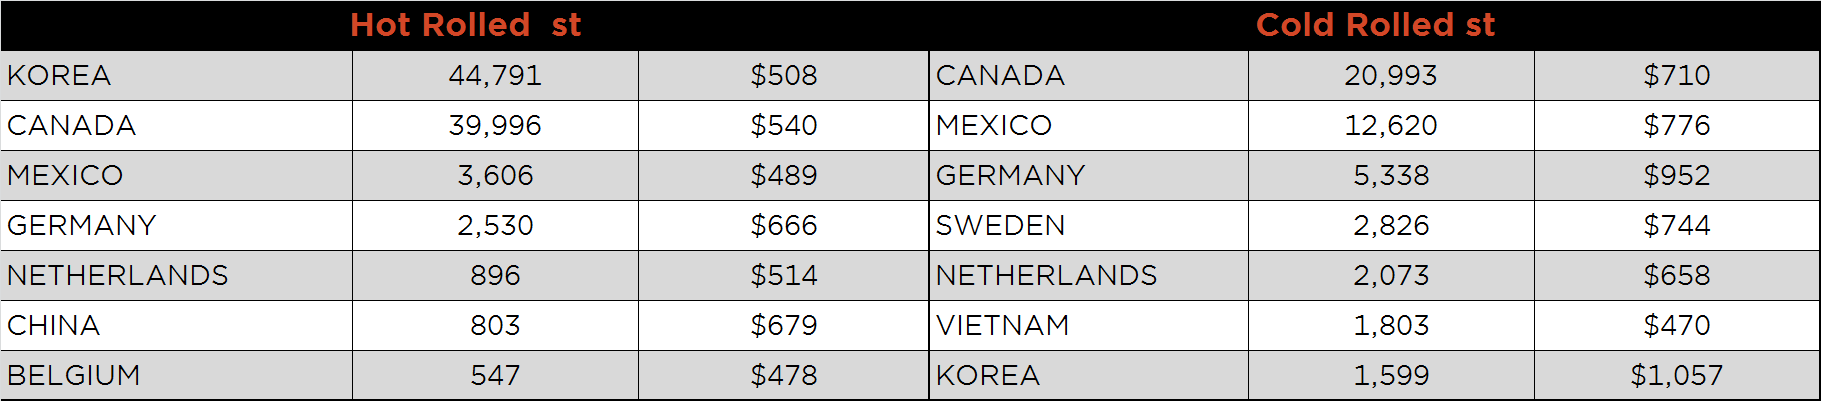
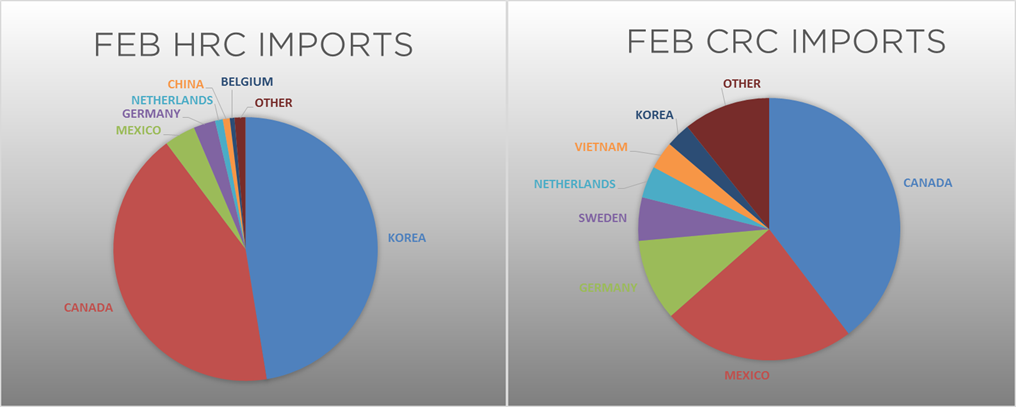
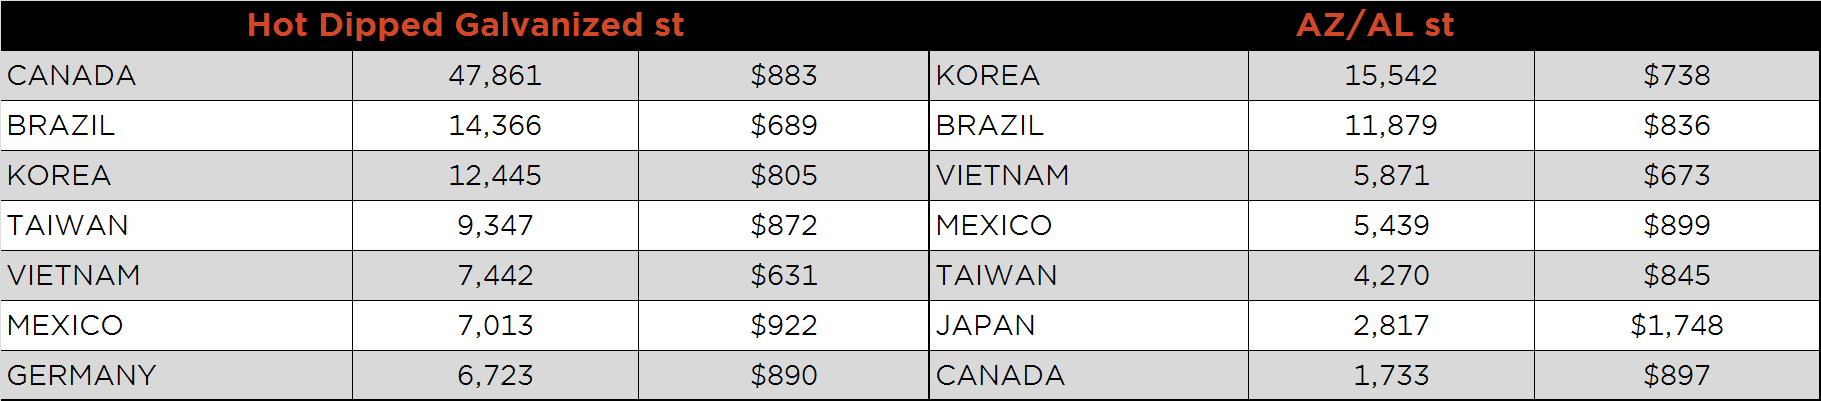
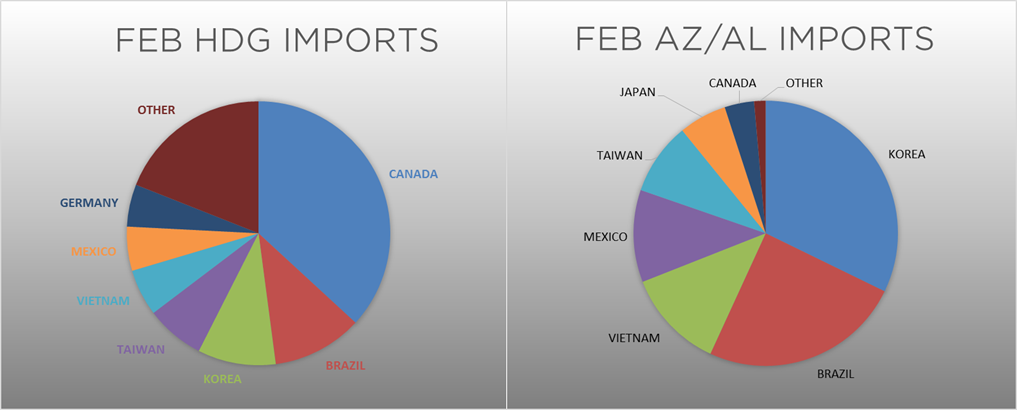
Below is January import license data through February 18, 2020.
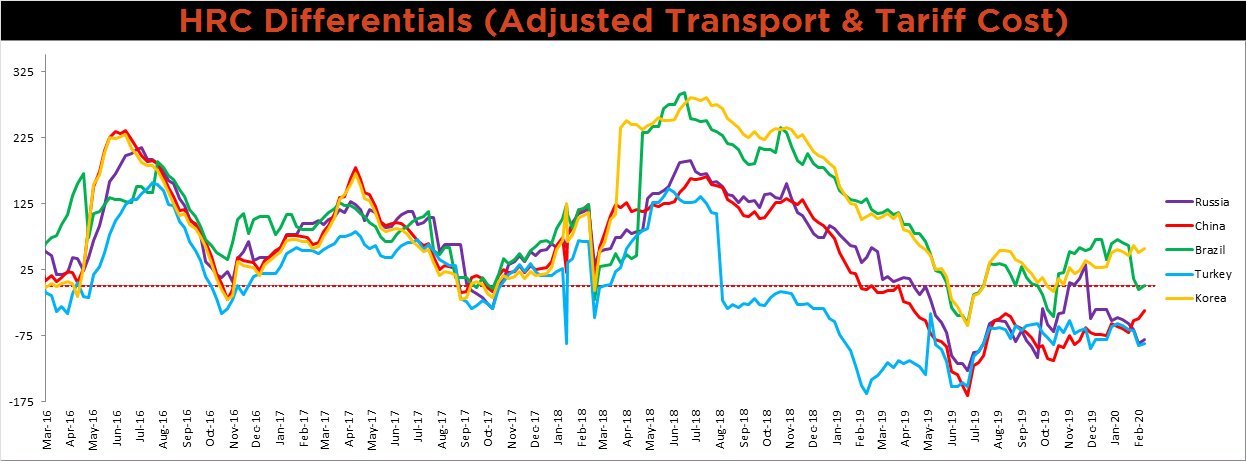
Below is the Midwest HRC price vs. each listed country’s export price using pricing from SBB Platts. We have adjusted each export price to include any tariff or transportation cost to get a comparable delivered price. All the differentials below increased.
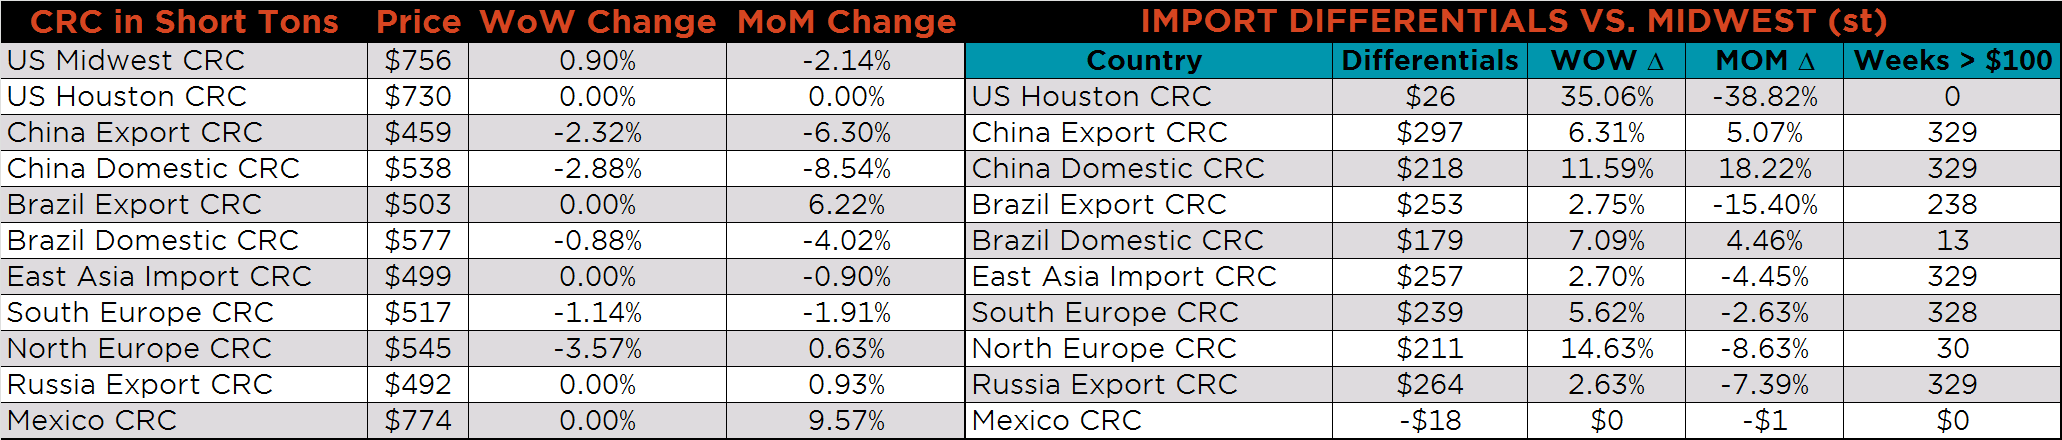
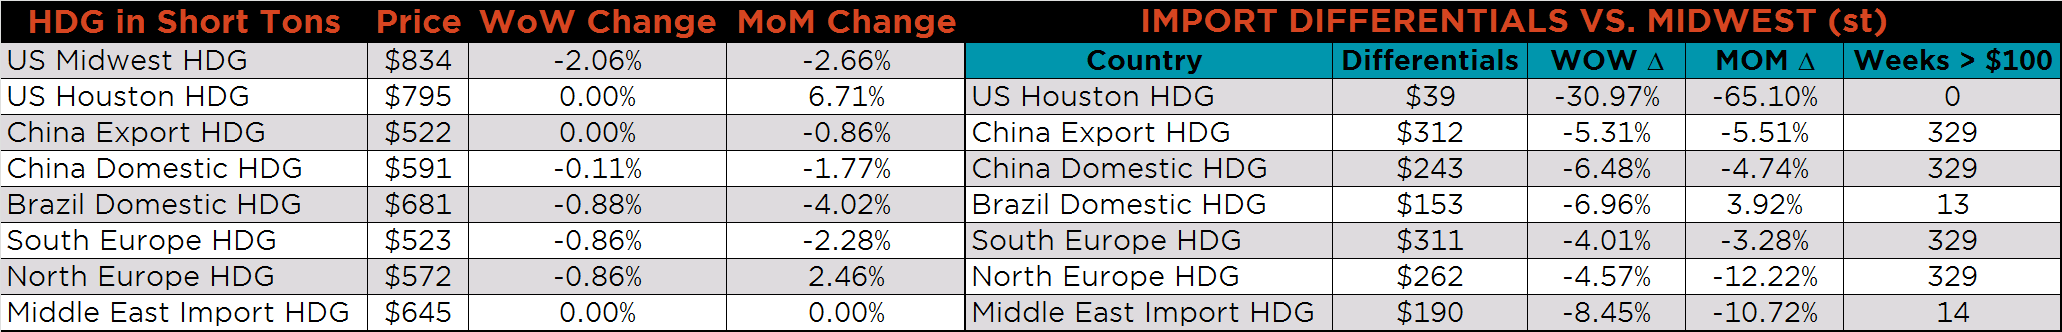
SBB Platt’s HRC, CRC and HDG pricing is below. The Midwest HRC and CRC prices were up, 1%, and 0.9%, respectively, while HDG was down 2.1%. The Chinese CRC and HRC prices were down 2.3% and 1.3%, respectively.
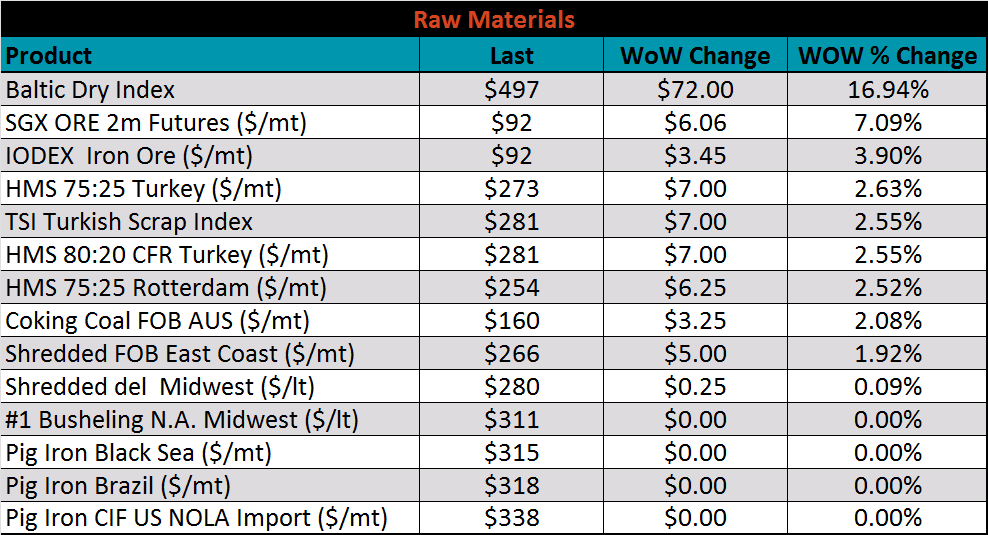
Raw material prices were mostly flat or higher, led by iron ore futures, up 7.1%.
Below is the iron ore future curve with Friday’s settlments in orange, and the prior week’s settlements in green. The entire curve shifted higher, most significantly in the back.
The ex-flat rolled prices are listed below.

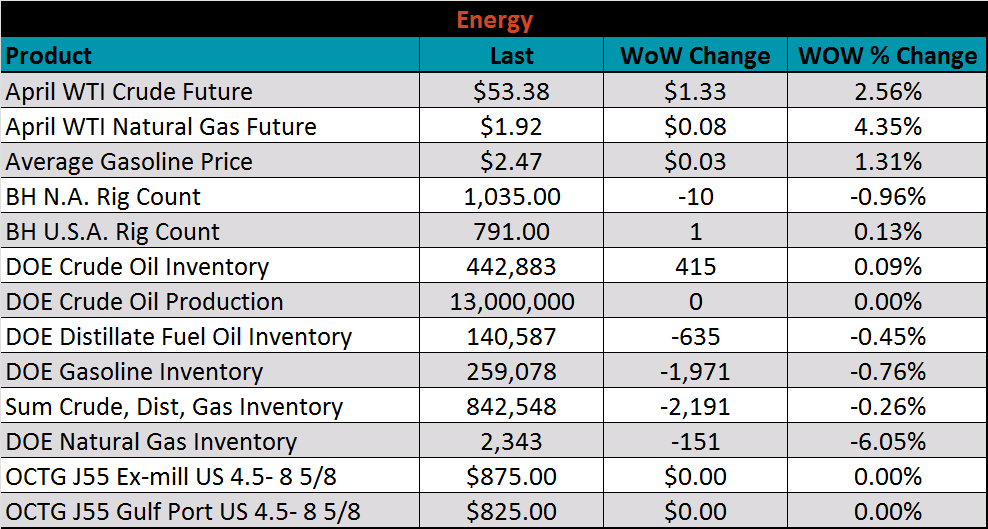
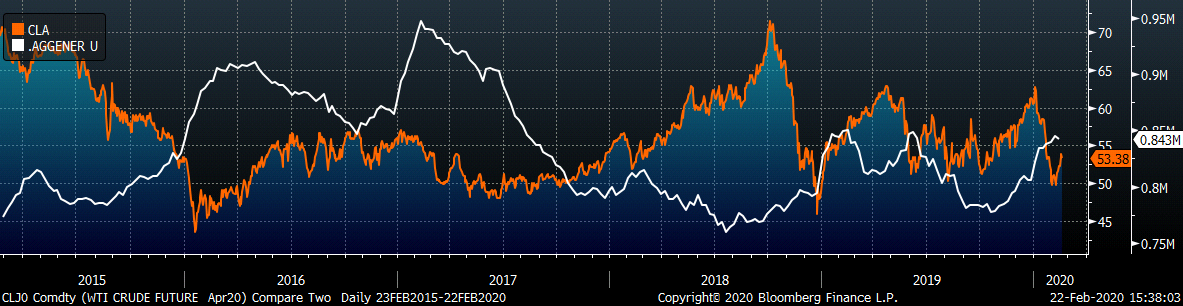
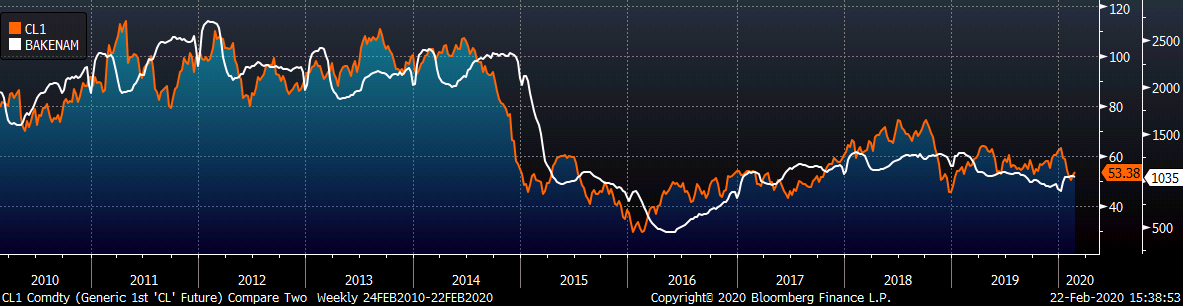
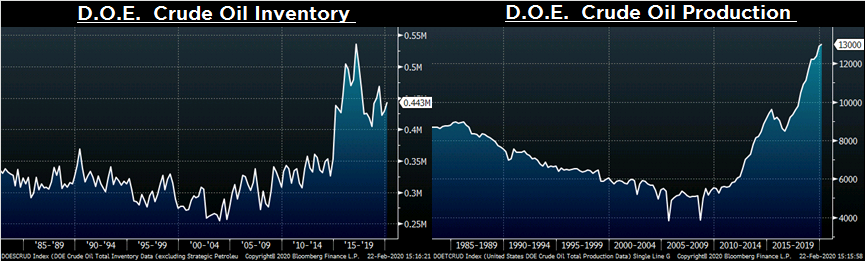
Last week, the April WTI crude oil future gained $1.33 or 2.6% to $53.38/bbl. The aggregate inventory level was down 0.3% and crude oil production was flat at 13m bbl/day. The Baker Hughes North American rig count was down ten rigs, while the U.S. rig count was up one rig.
The list below details some upside and downside risks relevant to the steel industry. The orange ones are occurring or look to be highly likely. The upside risks look to be in control.
Upside Risks:
Downside Risks: