Content
-
Weekly Highlights
- Market Commentary
- Risks


Over the last week, there has been an overwhelming amount of news regarding the stock market, the bond market, commodity markets and the domestic ferrous market. As we make our way through the clatter, let’s start with what we know.
Last Thursday, US Steel and Nucor led the mills in announcing a $40/ton price increase, which was expected by many in the market. The March scrap trade moved up $10-$20, giving mills support and confidence to push the increases. However, last week financial markets around the world reacted to heightened risks from the coronavirus spreading: US stock market down over 11%, iron ore down 8%, crude oil down 16%, and the 10 Year yield fell 32 bps to 1.15%. The volatility index (VIX) moved up 23 points on the week, settling above 40.
Increased volatility in financial markets is a signal of the uncertainty surrounding asset prices, economic outlook, and the coronavirus impact. There are many unanswered questions including: What impact will the coronavirus have on the economy, demand and GDP? Is this the bottom in the stock market? Can commodity prices fall further? Regarding the steel market and last week’s price increases, many are wondering if there is support in the market or if the increases were pushed only to prevent spot prices from continuing to slide.
During 2019, the mills attempted multiple times to stop the price decline by pushing increases despite falling scrap prices and weak order books. However, scrap prices have moved higher in March, and lead times remain extended, signaling that order books are strong while some mills remove production for maintenance this spring, supporting higher spot prices in the near-term.
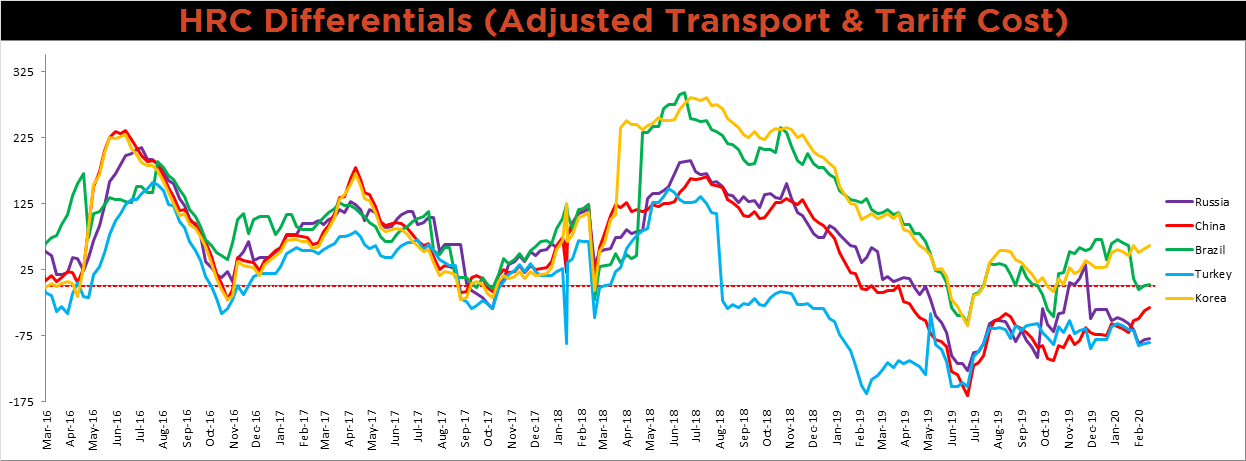
Looking further out into 2020, downside risks appear more prominent, and one of them is increasing import levels due to expanding price differentials. We focus on is the differential between domestic prices and the China export price, as it is the main driver of the world HRC price. The graph below shows the difference between the Midwest HRC price and the China export price, including transportation costs.
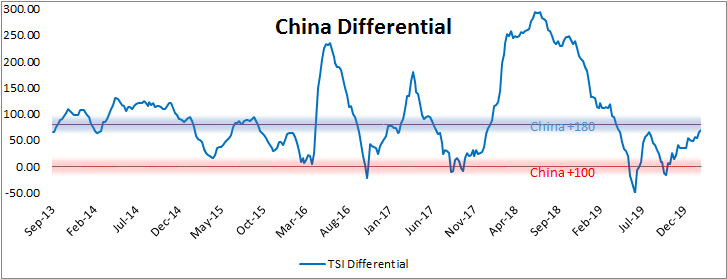
This differential has slowly grinded higher since October as the domestic price rallied further than the China export price in the fourth quarter and into January. However, recently the differential moved higher even as domestic spot prices slid, signaling that there was more weakness in the Chinese steel market than the US market. The weakness abroad can be attributable to the coronavirus that hit China first during their New Year holiday at the end of January and is still rippling through their market. Chinese HRC and rebar inventories (below) are skyrocketing as domestic demand and transportation have fallen while furnaces have continued to produce steel, depleting raw material stockpiles. Expect weakness in the finished steel export market ahead as Chinese mills offer their inventory in the global market.
Due to longer lead times associated with the global steel trade, the low priced material would not surface in the domestic market for several months. Even though current import levels are low, there is the possibility that they could rise substantially this summer, weighing on future prices. Considering this along with the demand related risks associated with the coronavirus, which are also pushed into the future for the domestic steel market, the backwardated forward curve makes sense with spot prices rising and future prices at lower levels. This allows those skeptical of the price increases and demand environment to lock in lower prices in the future rather than paying current high spot prices.

Below are the most pertinent upside and downside price risks:
Upside Risks:
Downside Risks:

The Platts TSI Daily Midwest HRC Index was up $1.50 to $578.25.

The CME Midwest HRC futures curve is below with last Friday’s settlements in white. The curve shifted higher in the front and back, while dipping in the summer months of 2020.

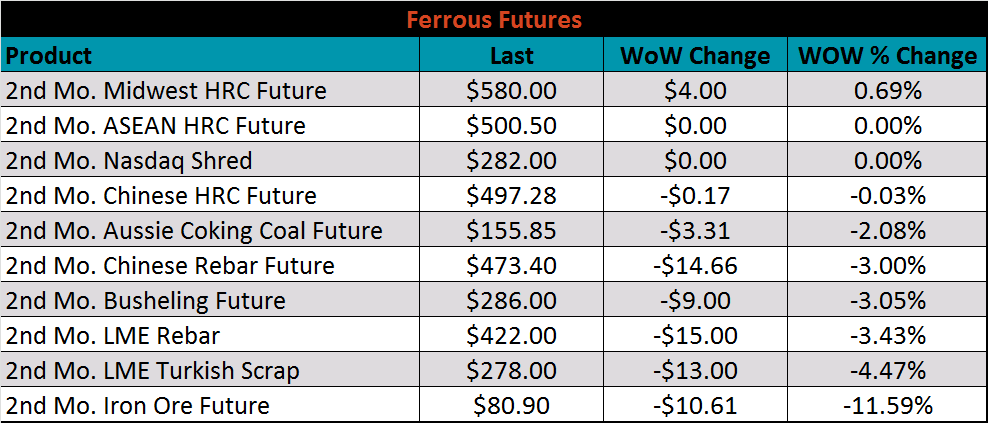
March ferrous futures were mostly lower, led by the iron ore future, which lost 11.6%.
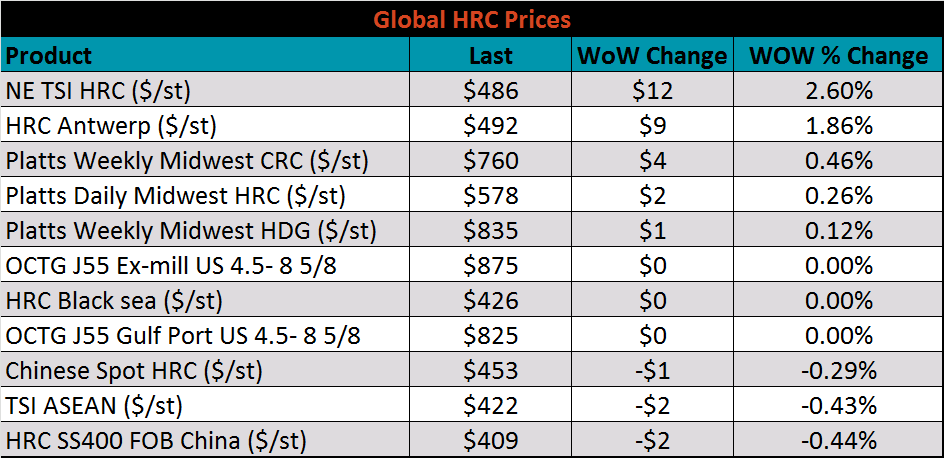
The global flat rolled indexes were mixed. Platts Northern European HRC was up 2.6%, while Chinese Export HRC was down 0.4%.
The AISI Capacity Utilization Rate was down 0.3% to 81.5%.


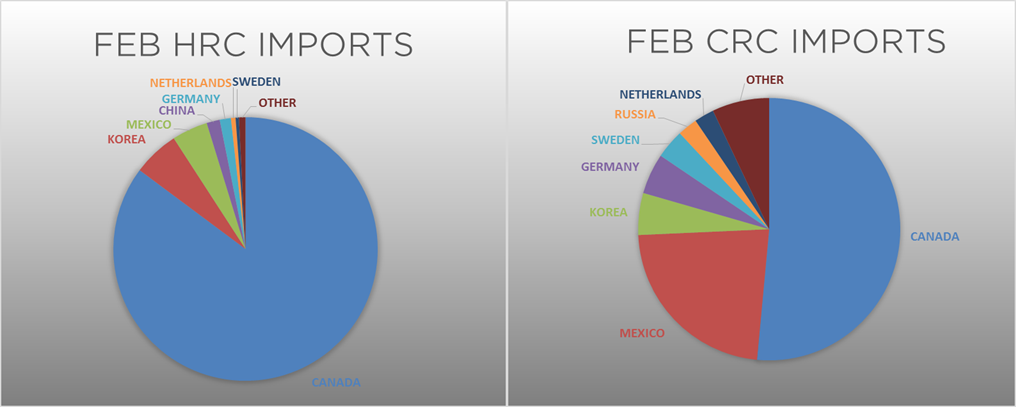
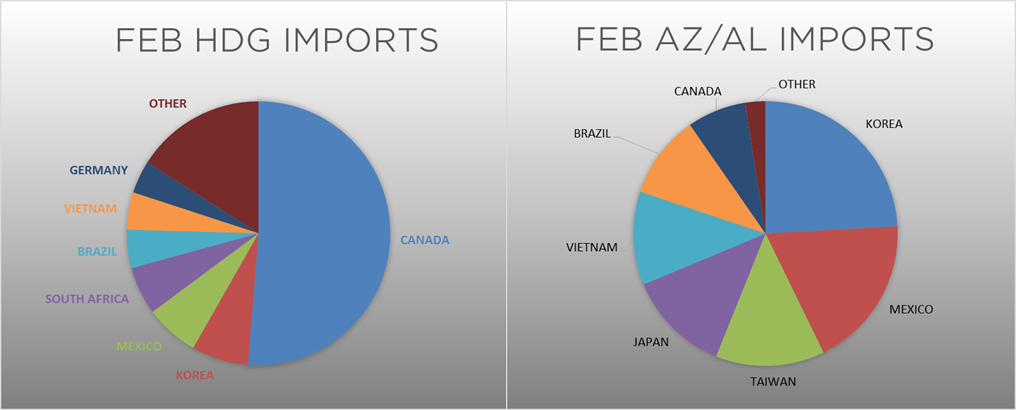
February flat rolled import license data is forecasting an decrease of 133k to 632k MoM.

Tube imports license data is forecasting a MoM decrease of 104k to 255k tons in February.


AZ/AL import license data is forecasting a decrease of 26k in January to 45k.

Below is January import license data through February 25, 2020.


Below is the Midwest HRC price vs. each listed country’s export price using pricing from SBB Platts. We have adjusted each export price to include any tariff or transportation cost to get a comparable delivered price. All the differentials below increased.
SBB Platt’s HRC, CRC and HDG pricing is below. The Midwest HRC and CRC prices were up, 1%, and 0.9%, respectively, while HDG was down 2.1%. The Chinese CRC and HRC prices were down 2.3% and 1.3%, respectively.


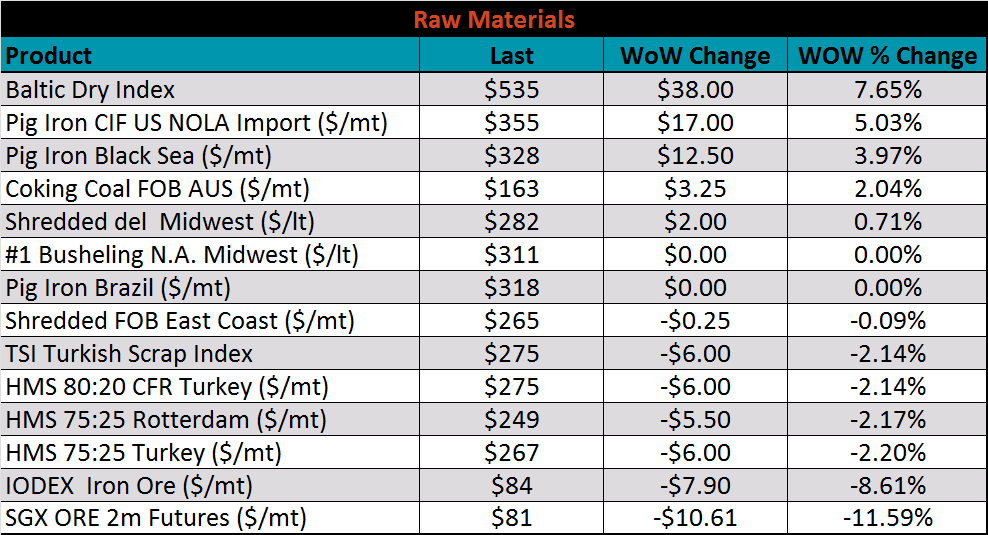
Raw material prices were mixed; iron ore futures were down 11.6%, while Pig Iron was up 5%.
Below is the iron ore future curve with Friday’s settlments in orange, and the prior week’s settlements in green. The entire curve shifted lower, most significantly in the front.

The ex-flat rolled prices are listed below.


Below are inventory levels for Chinese finished steel products and iron ore. 5 City, HRC and rebar inventory levels increased dramatically again, while iron ore port inventory fell. With these high inventory levels, mills are running out of physical storage space and raw materials, leading to forced production cuts until demand returns.


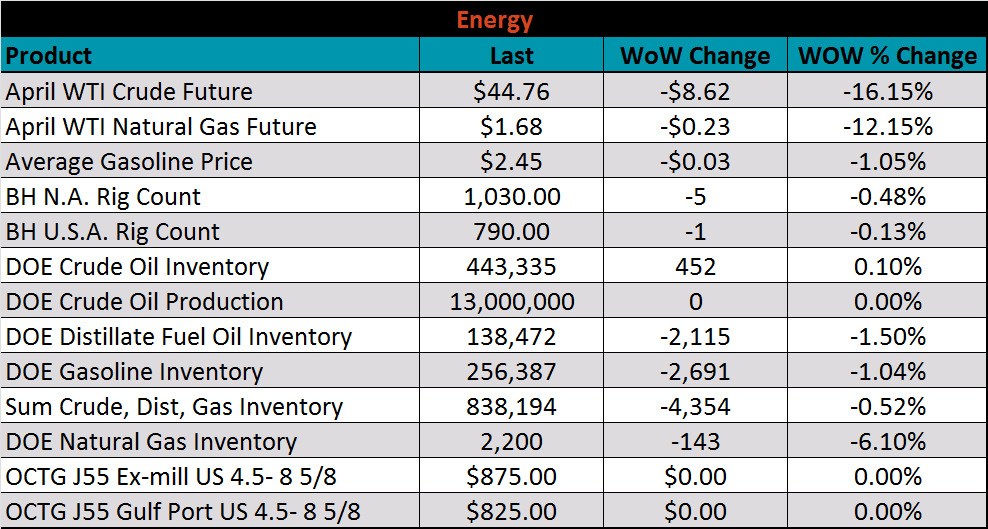
Last week, the April WTI crude oil future lost $8.62 or 16.2% to $44.76/bbl. The aggregate inventory level was down 0.5% and crude oil production was flat at 13m bbl/day. The Baker Hughes North American rig count was down five rigs while the U.S. rig count was down one rig.


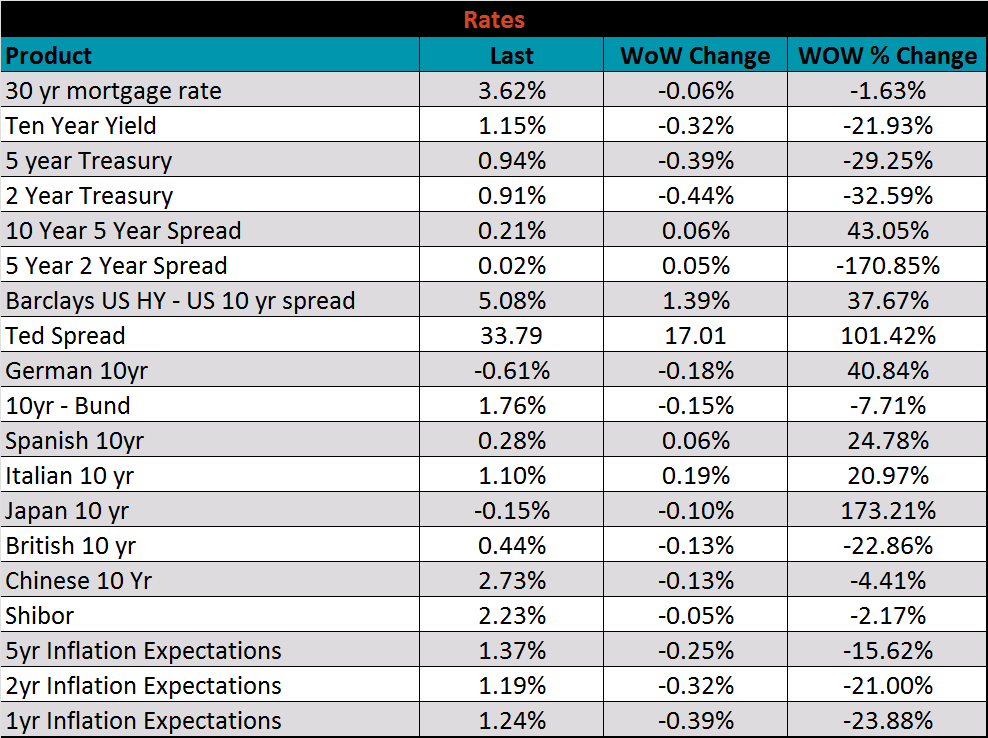
The U.S. 10-year yield was down 32 bps, closing the week at 1.15%, the lowest level on record. The German 10-year yield was down 18 bps to minus 0.61% while the Japanese 10-year yield was down 10 bps to minus 0.16%.


The list below details some upside and downside risks relevant to the steel industry. The orange ones are occurring or look to be highly likely. The upside risks look to be in control.
Upside Risks:
Downside Risks: