

February 4, 2022

Market Commentary
This week, as steel prices in the physical market continued to push lower, there is a sense that mills have taken a step back. This comes in contrast to the last two months, where mill willingness to negotiate well below published spot prices led to mass confusion around fair value. Since peaking in late September, the current assessed price has declined by more than 40% and should remain under pressure as customers continue to work through their excess inventories. However, the outlook on the horizon remains bullish. Imports are not currently arriving at the levels the market expected for 1Q22, while the global price for steel continues to push higher. On top of that, demand for steel continues to be strong and, in some sectors, should grow. In the remainder of this report, we will dig into the recently released economic data.
ISM PMI
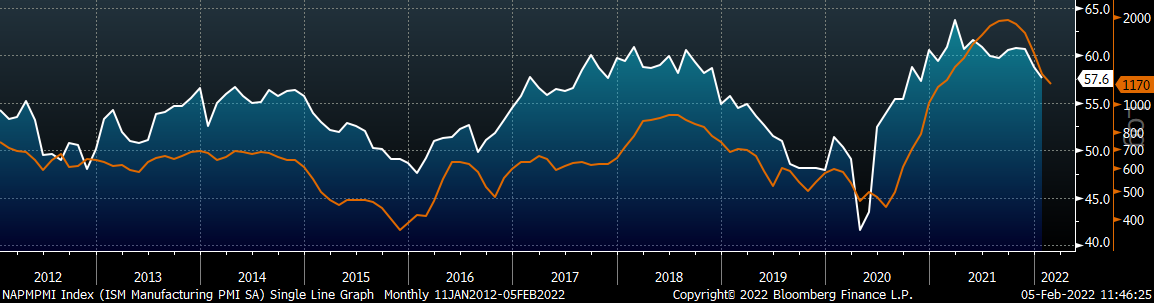
The chart below is the Platts Midwest HRC index (orange) and the ISM Manufacturing PMI (white). Both the topline ISM Manufacturing PMI and the Midwest HRC price continued their respective trend’s lower but remain historically elevated.
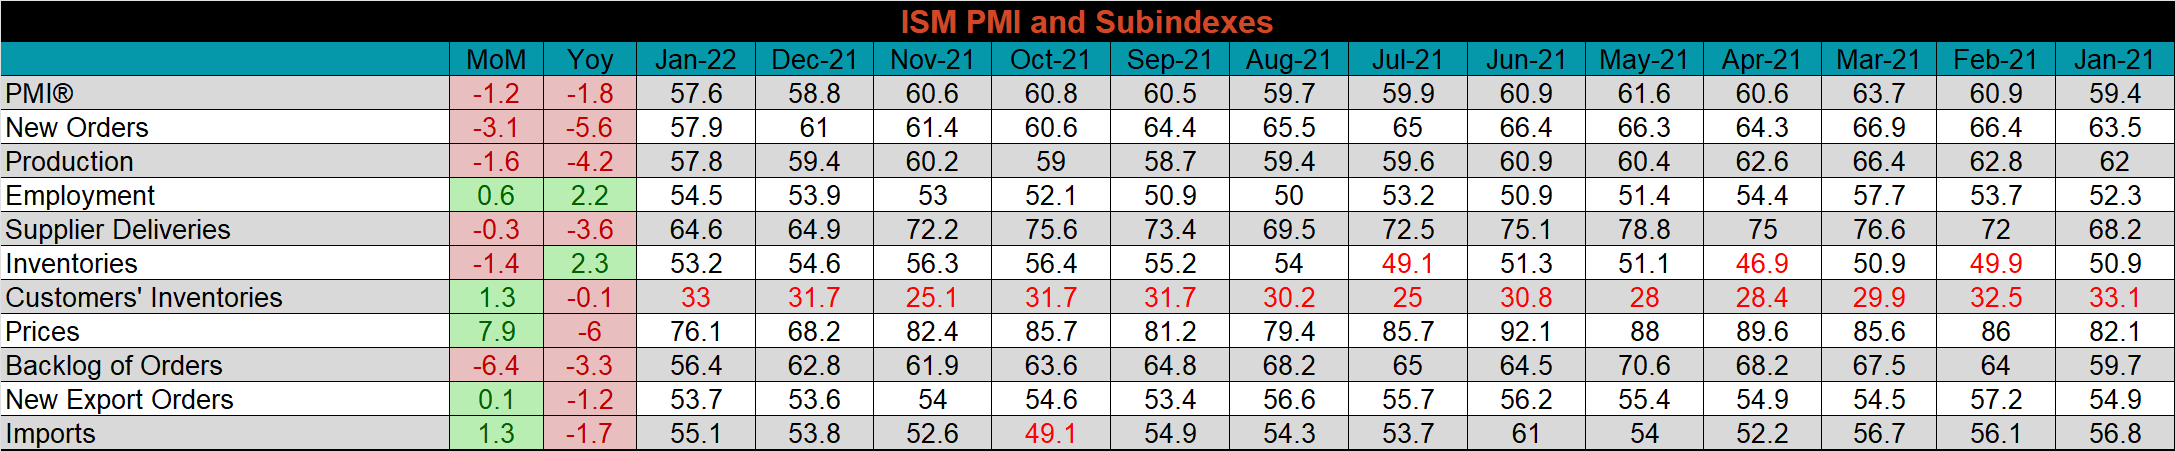
The January ISM Manufacturing PMI and subindexes are below.
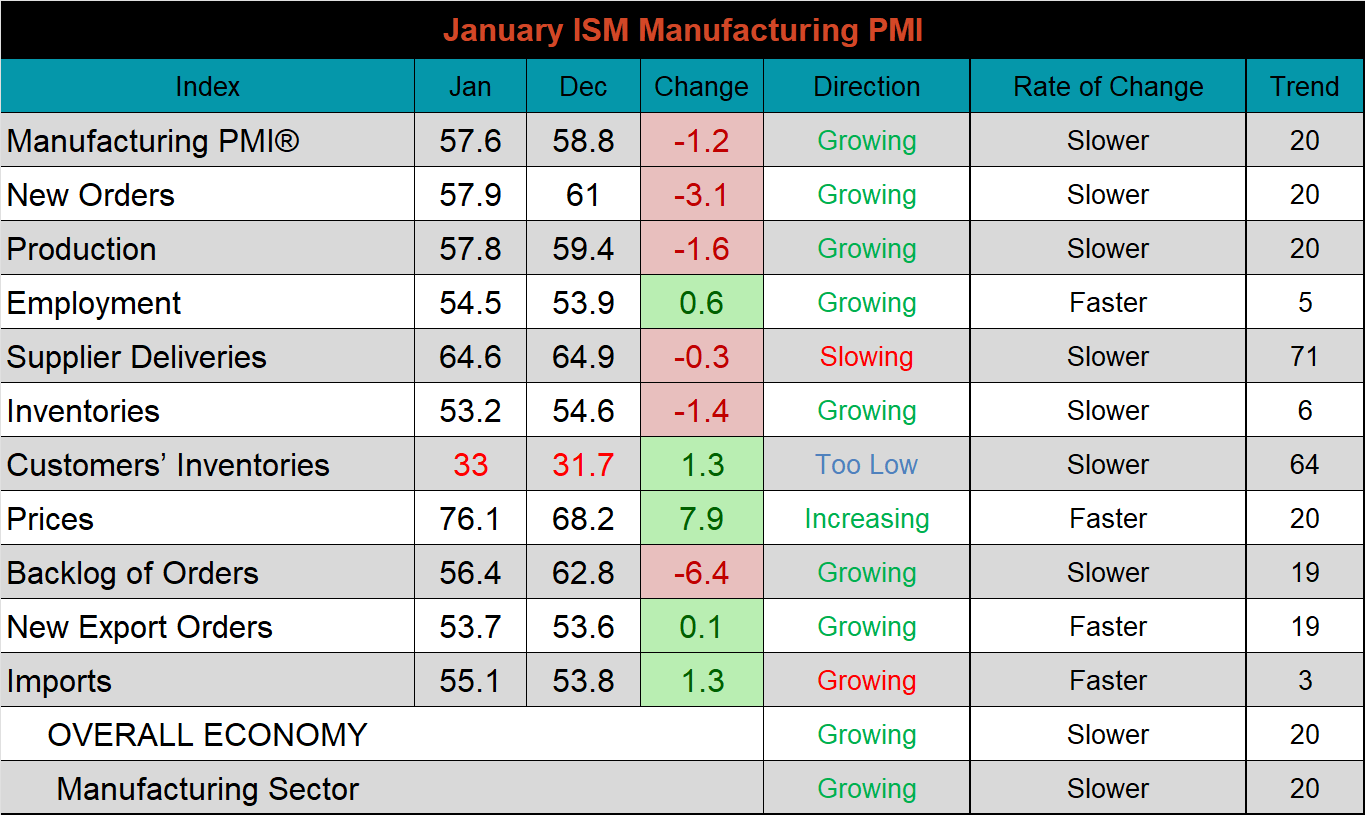
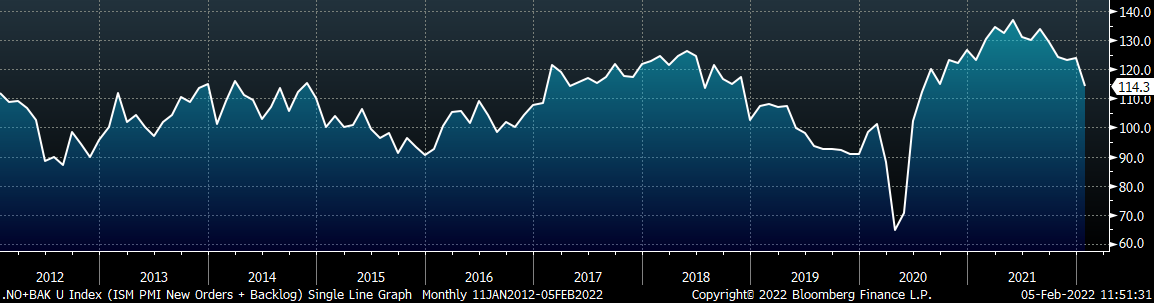
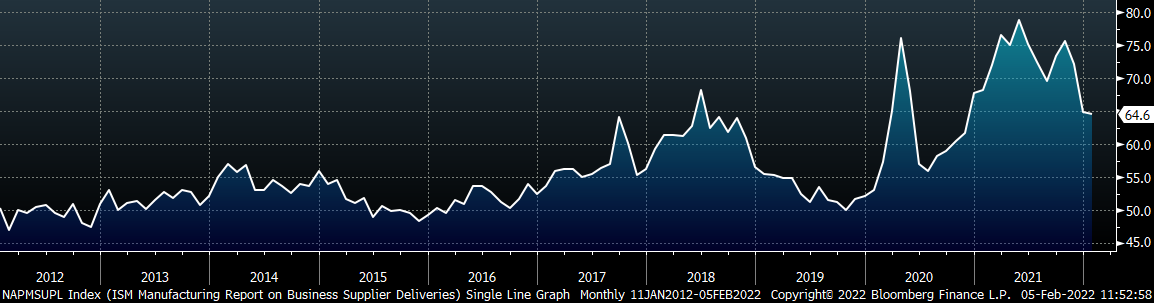
This month’s print above 50 represents a trend of 20 straight months of expansion within the manufacturing sector. On top of that, it is important to remember that within this expansion cycle we have seen a record number of prints above 60. With that being said, the three largest MoM declining subindexes from December to January were the backlog of new orders, new orders, and production – arguably the most vital components of sustained growth. The chart below shows the new orders plus backlog subindexes, which have been in a downward trend since the middle of last year. However, these two subindexes (as well as the production subindex) continue to represent strong growth. The second chart shows supplier deliveries, which was slightly lower again this month. Even though supply chain and logistics constraints are easing, this type of tightness was only experienced once in the last 10 years, prior to 2020.
ISM Manufacturing PMI New Orders + Backlog
ISM Manufacturing PMI Supplier Deliveries
The table below shows the historical values of each subindex over the last year.
Global PMI
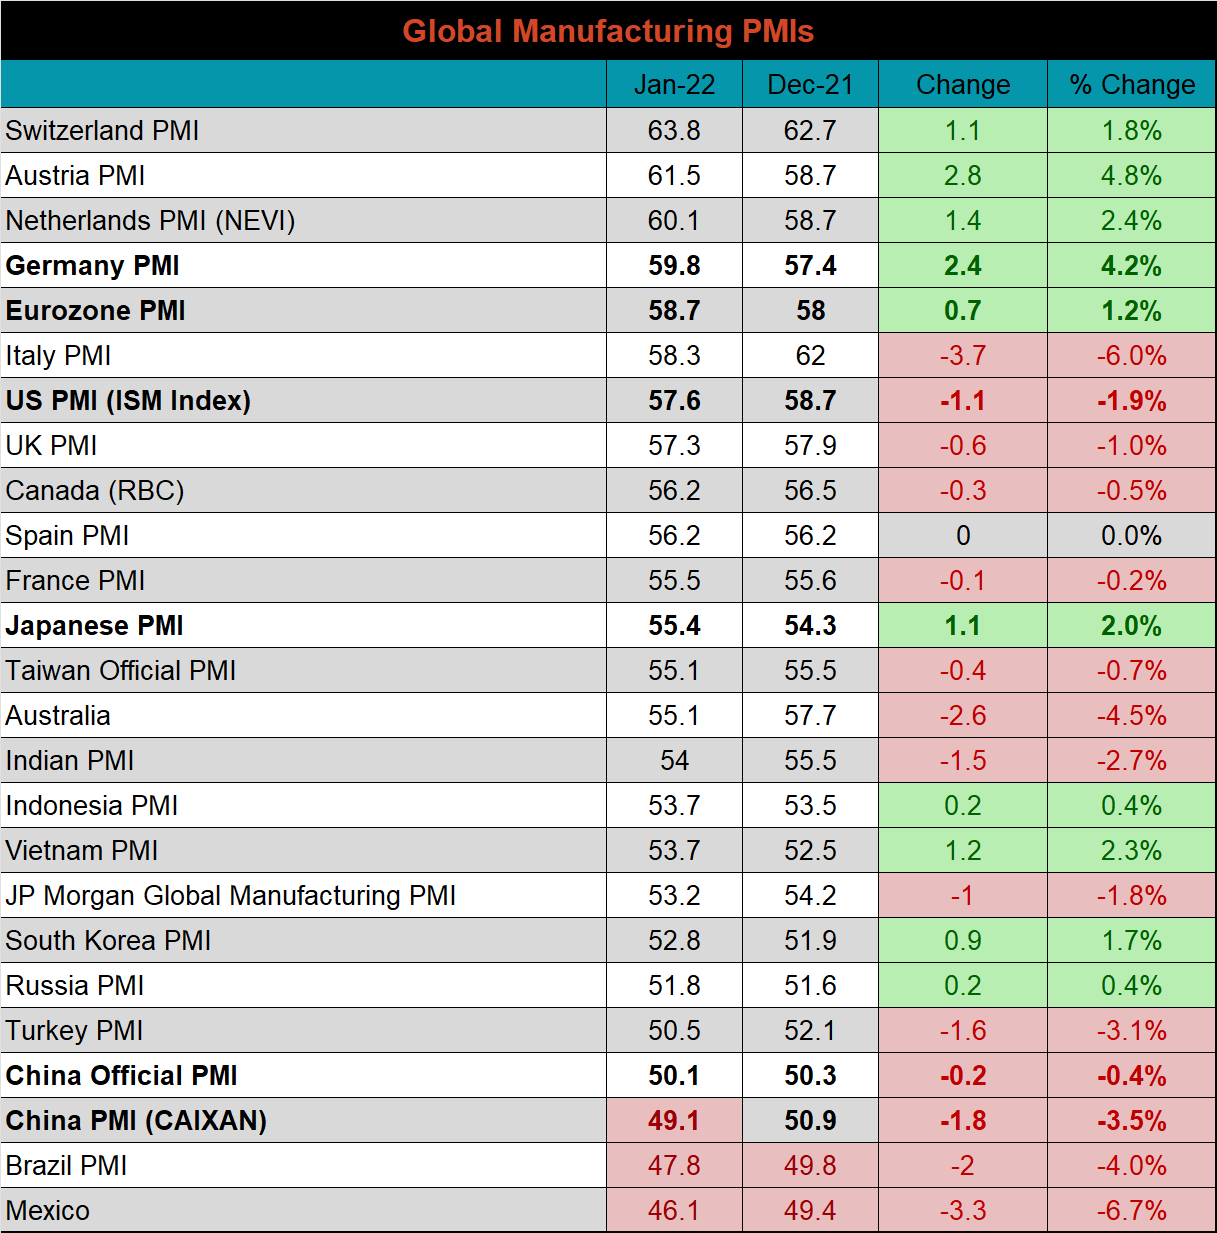
January global PMI printings depict another month of slowing expansion, with only 10 of the 23 watched countries seeing their respective manufacturing industries grow at a more significant rate than in December. The five most significant countries (bold) remain well in expansion territory, except China, where the official and CAIXAN PMIs continue bouncing between expansion and contraction.
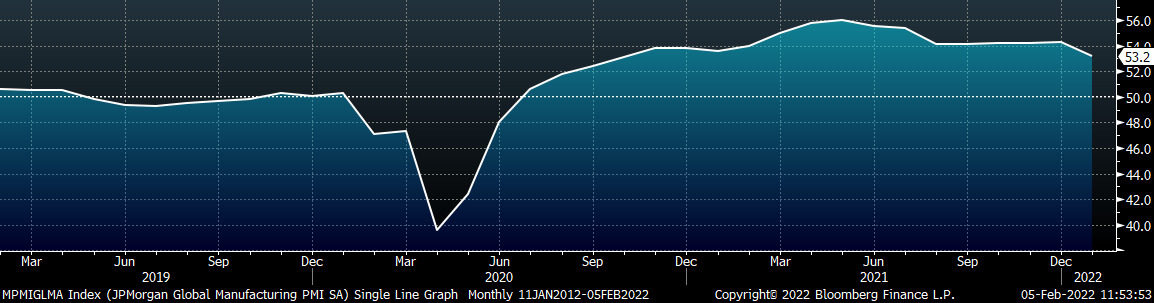
J.P. Morgan Global Manufacturing
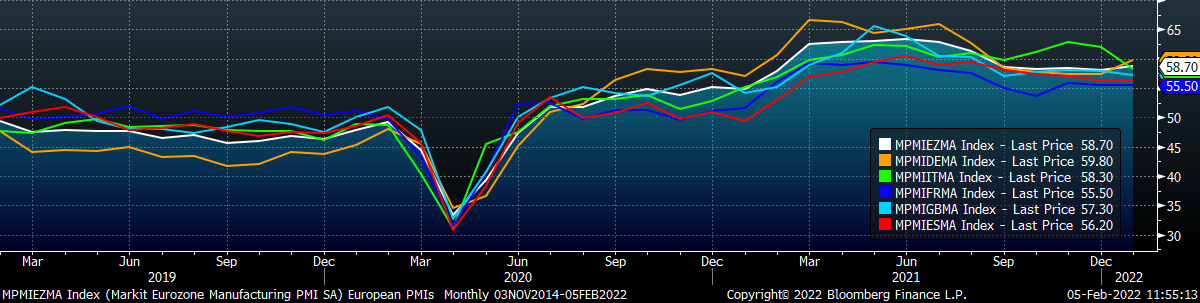
Eurozone (white), German (orange), Italian (green), Spanish (red), and French (blue), U.K. (teal) Manufacturing PMIs
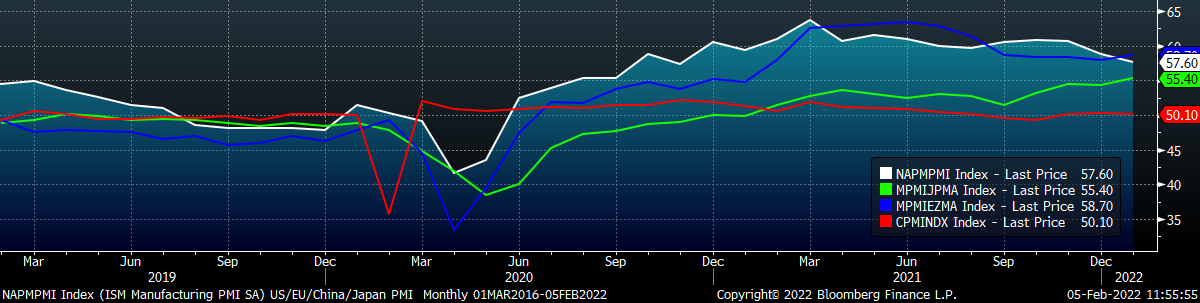
US (white), Euro (blue), Chinese (red) and Japanese (green) Manufacturing PMIs
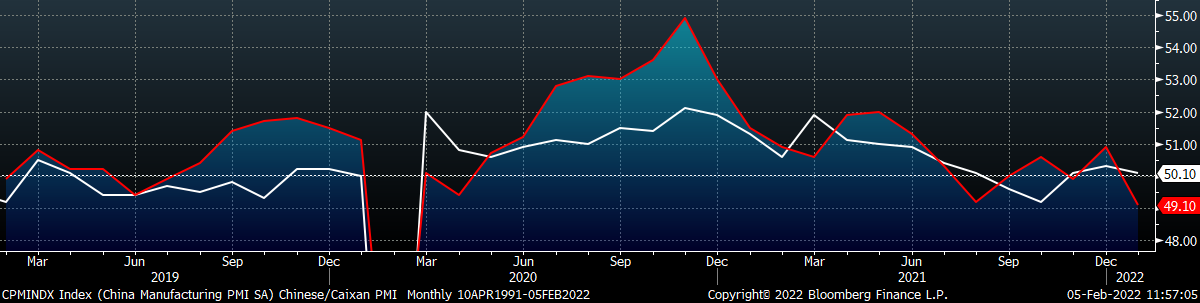
Both the Caixan PMI, and Chinese official PMI printed lower and the Caixan reading moved back into contraction territory.
China Official (white) and Caixan (red) Manufacturing PMIs
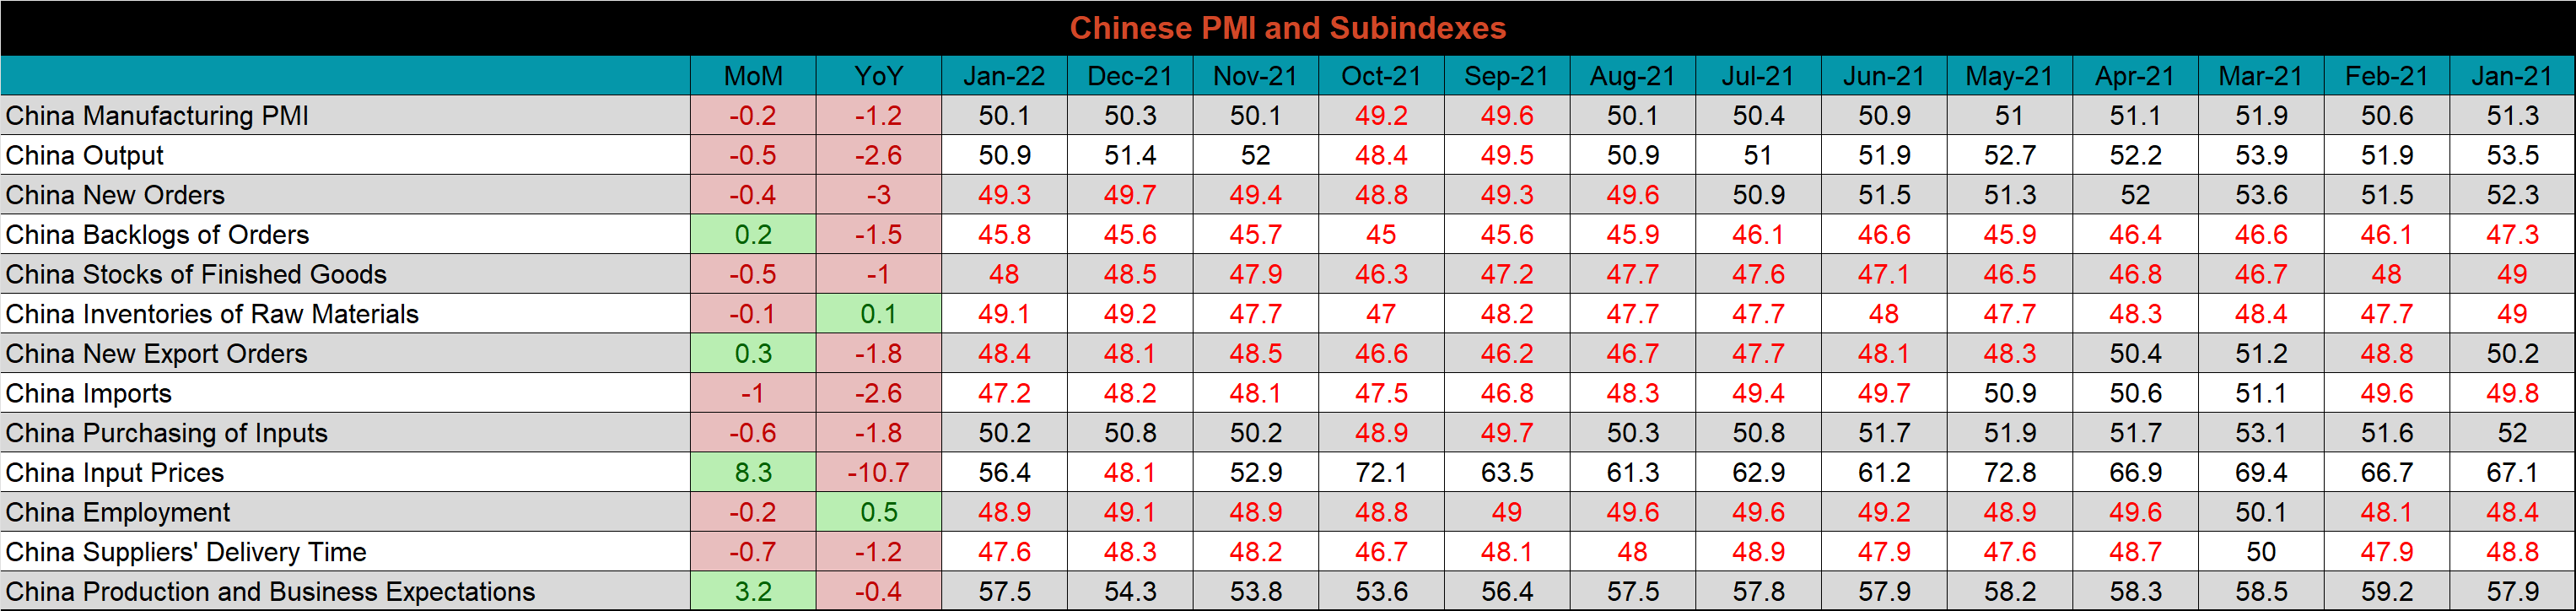
The table below breaks down China’s official manufacturing PMI subindexes. Most of the readings saw very little MoM change, apart from input prices, which jumped higher after falling last month.
Construction Spending
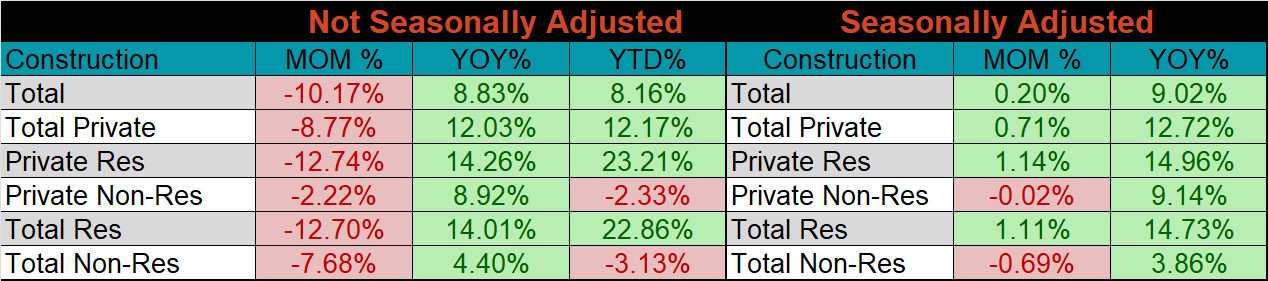
December seasonally adjusted U.S. construction spending was up 0.2% compared to November, and 9% higher than December 2020.
December U.S. Construction Spending
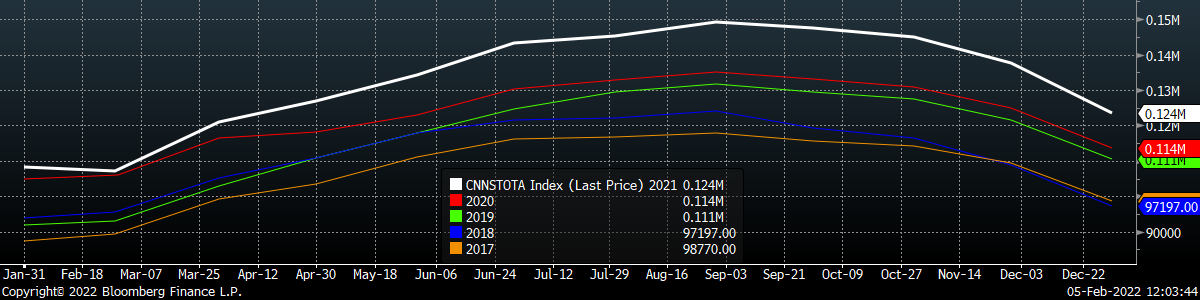
The white line in the chart below represents not seasonally adjusted construction spending in 2021 and compares it to the spending of the previous 4 years. Overall spending remains strong.
U.S. Construction Spending NSA
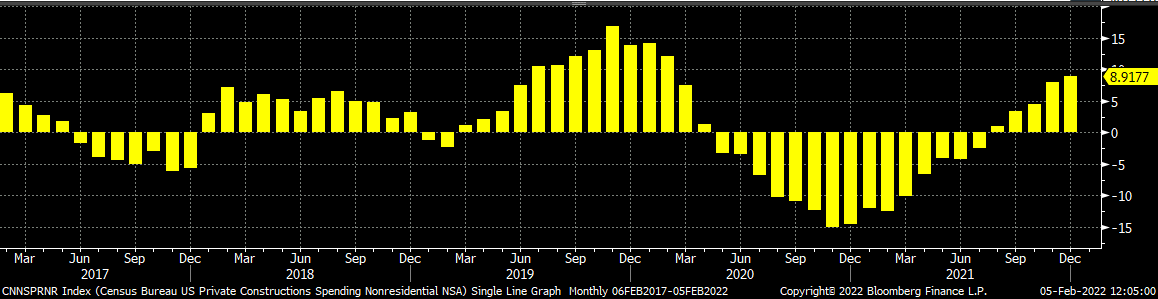
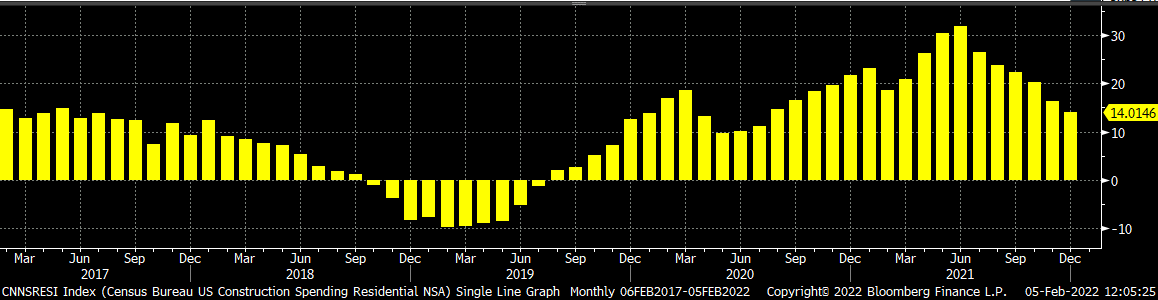
The two charts below show the YoY changes in construction spending. The recent trend for both continued this month, as non-residential spending expanded further, while the residential spending has been higher than the previous year for 29 straight months.
U.S. Private Nonresidential Construction Spending NSA YoY % Change
U.S. Residential Construction Spending NSA YoY % Change
Auto Sales
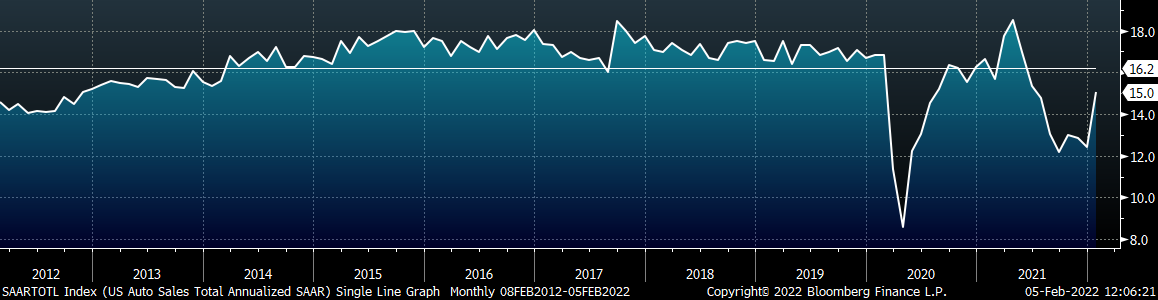
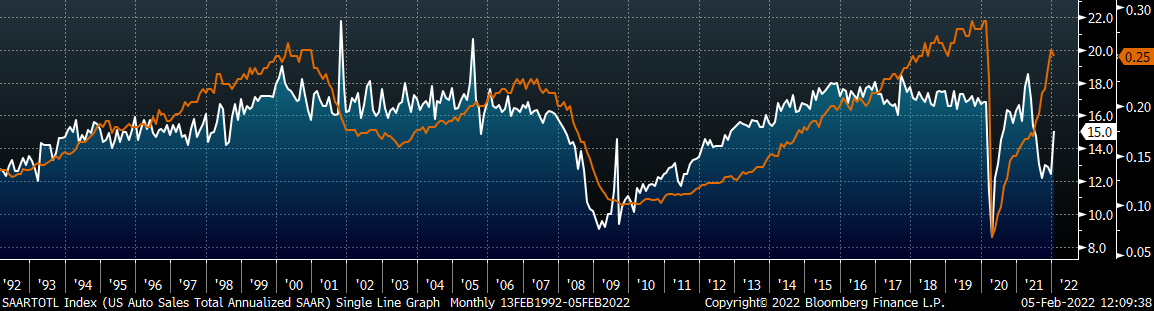
January U.S. light vehicle sales rebounded to a 15m seasonally adjusted annualized rate (S.A.A.R) but remain below the 10-year average of 16.2m. The second chart shows the relationship between the unemployment rate and auto sales. The unemployment rate is inverted to show that declining unemployment typically leads to increasing auto sales. The labor market plateaued in January, but it remains incredibly strong. While there is likely a significant amount of inventory that needs to be worked through from the auto sector as the chip shortage has yet to be resolved, this chart suggests there is still significant demand for cars.
January U.S. Auto Sales (S.A.A.R.)
January U.S. Auto Sales (orange) and the Inverted Unemployment Rate (white)
Risks
Below are the most pertinent upside and downside price risks:
Upside Risks:
- Inventory at end users and service centers below normal operational levels
- Higher share of discretionary income allocated to goods from steel intensive industries
- Changes in China’s policies regarding ferrous markets, including production cuts and exports
- Unplanned & extended planned outages, including operational issues leaving mills behind
- Energy & construction industry rebound
- Easing labor and supply chain constraints allowing increased manufacturing activity
- Mills extending outages/taking down capacity to keep prices elevated
- Global supply chains and logistics restraints causing regional shortages
Downside Risks:
- Increased domestic production capacity
- Elevated price differentials and hedging opportunities leading to sustained higher imports
- Steel consumers substitute to lower cost alternatives
- Steel buyers and consumers “double ordering” to more than cover steel needs
- Tightening credit markets, as elevated prices push total costs to credit caps
- Supply chain disruptions allowing producers to catch up on orders
- Limited desire to restock at elevated prices, causing a “Buyer’s Strike”
- Economic slowdown caused by the emergence of Coronavirus Variants
HRC Futures
All of the below data points are as of February 4, 2022.
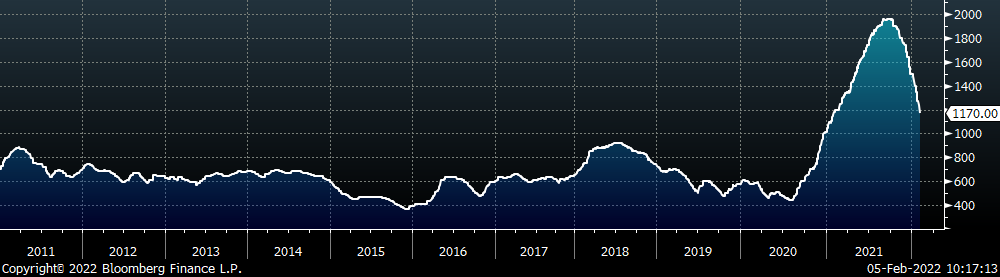
The Platts TSI Daily Midwest HRC Index decreased by another $100 to $1,170.
Platts TSI Daily Midwest HRC Index
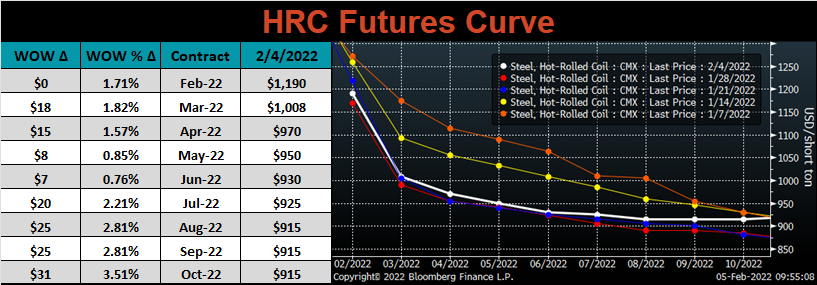
The CME Midwest HRC futures curve is below with last Friday’s settlements in white. The entire curve printed higher, most significantly in the back.
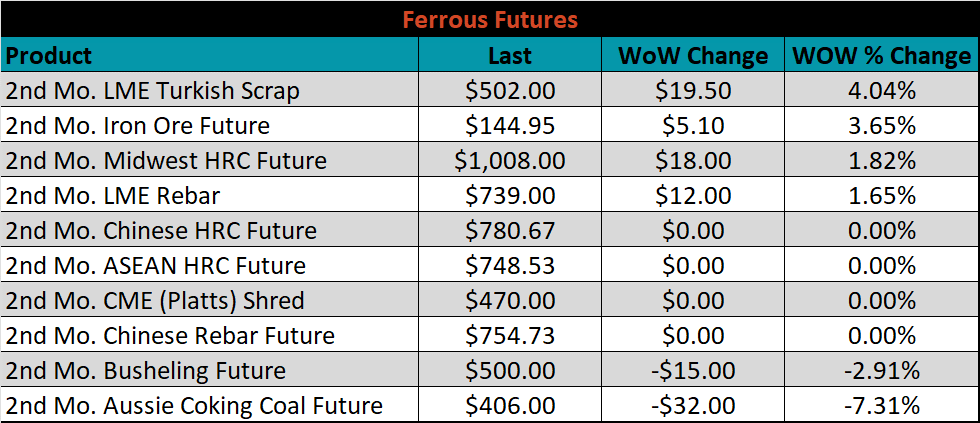
March ferrous futures were mixed. Aussie coking coal lost 7.3%, while LME Turkish scrap gained 4%.
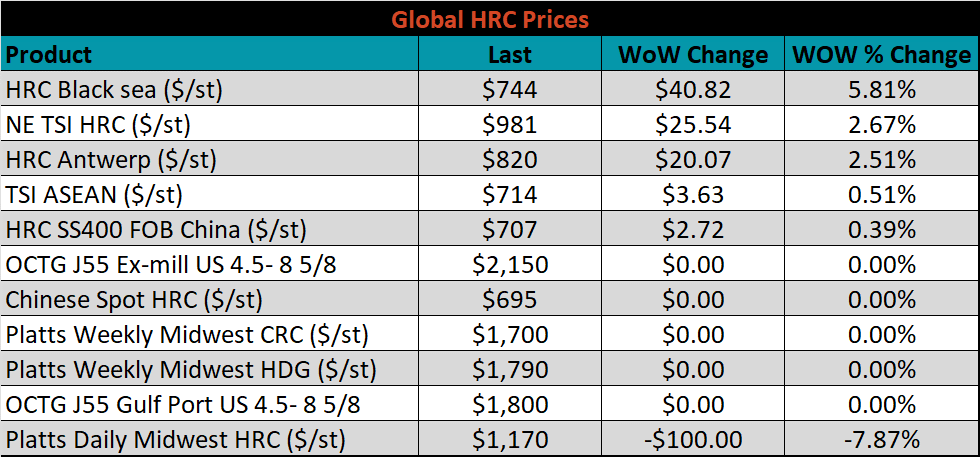
Global flat rolled indexes were mostly higher, led by Black Sea HRC, up another 5.8%, while Midwest HRC was down 7.9%.
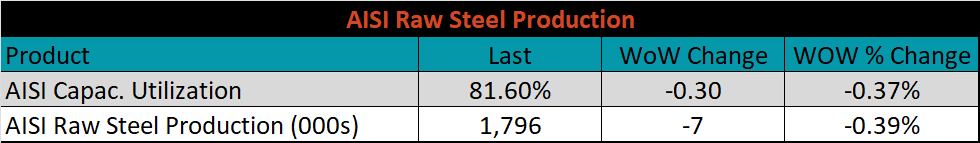
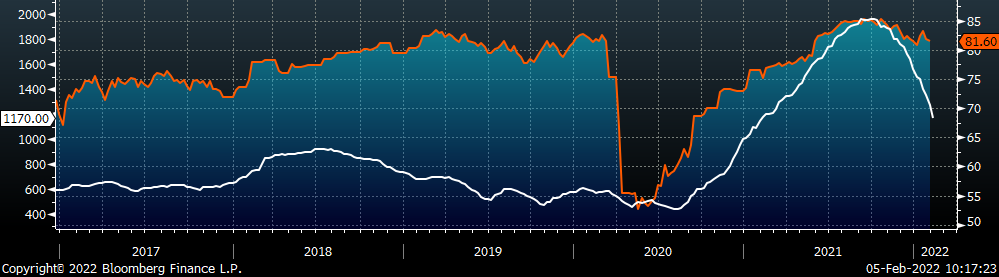
The AISI Capacity Utilization was down 0.3% to 81.6%.
AISI Steel Capacity Utilization Rate (orange) and Platts TSI Daily Midwest HRC Index (white)
Imports & Differentials
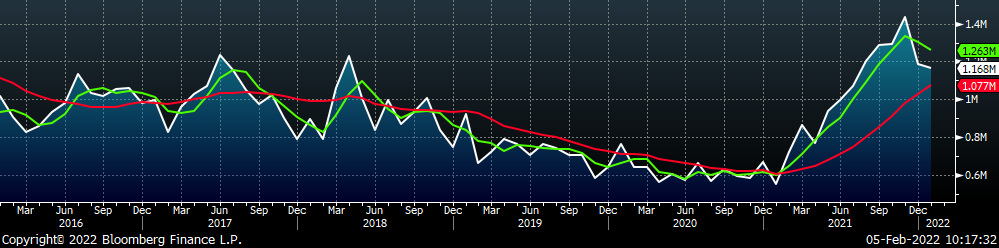
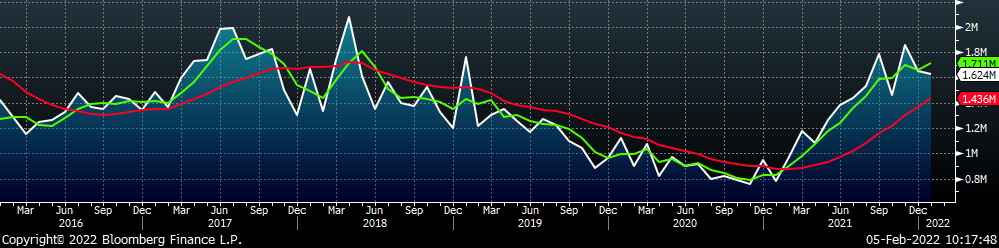
January flat rolled import license data is forecasting a decrease of 18k to 1.17M MoM.
All Sheet Imports (white) w/ 3-Mo. (green) & 12-Mo. Moving Average (red)
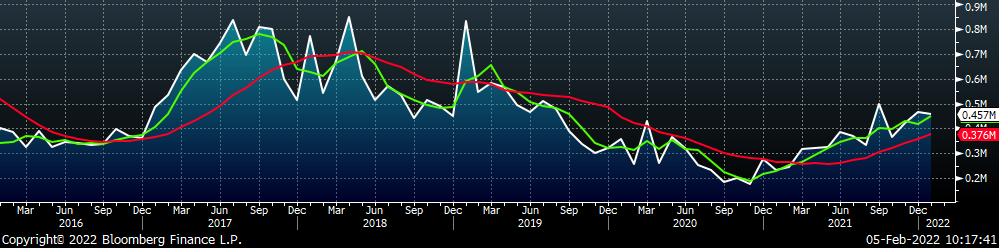
Tube imports license data is forecasting a decrease of 11k to 457k in January.
All Tube Imports (white) w/ 3-Mo. (green) & 12-Mo. Moving Average (red)
All Sheet plus Tube (white) w/ 3-Mo. (green) & 12-Mo. Moving Average (red)
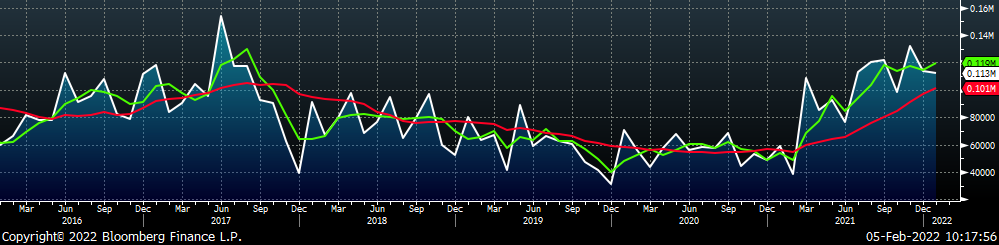
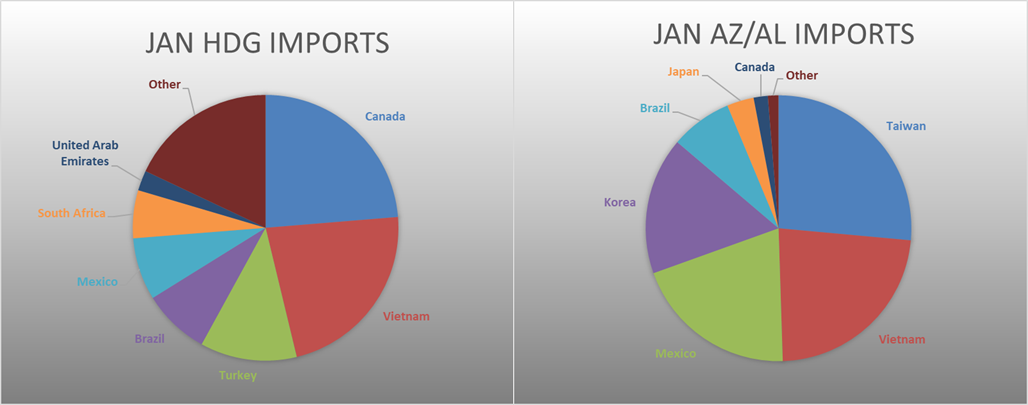
January AZ/AL import license data is forecasting a decrease of 1k to 113k.
Galvalume Imports (white) w/ 3 Mo. (green) & 12 Mo. Moving Average (red)
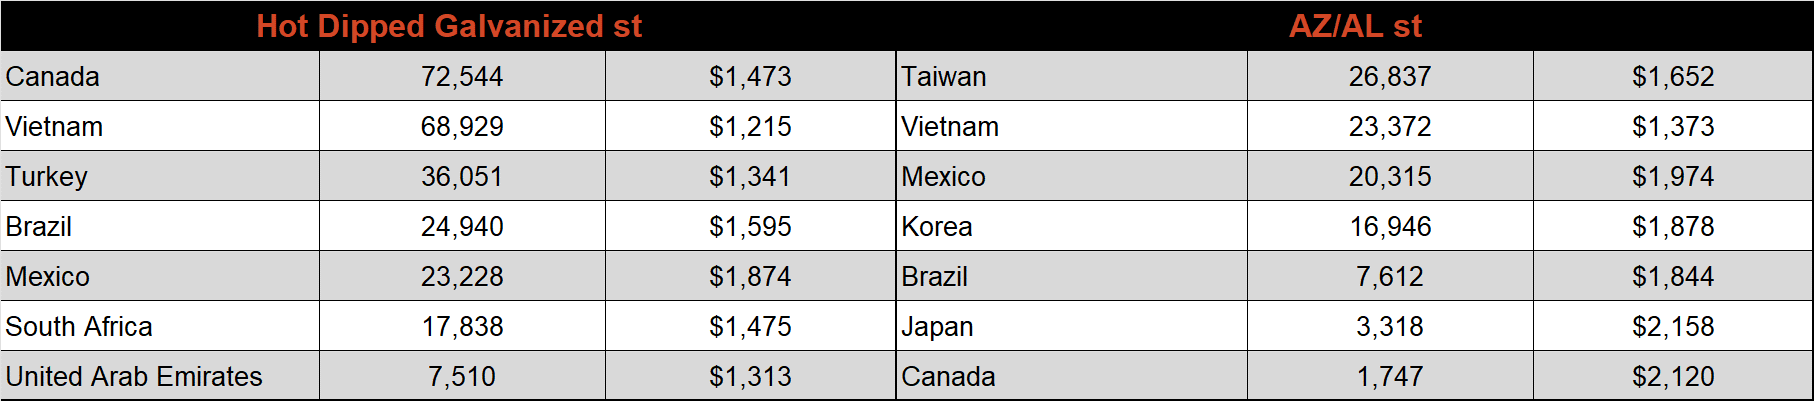
Below is January import license data through January 31st, 2022.
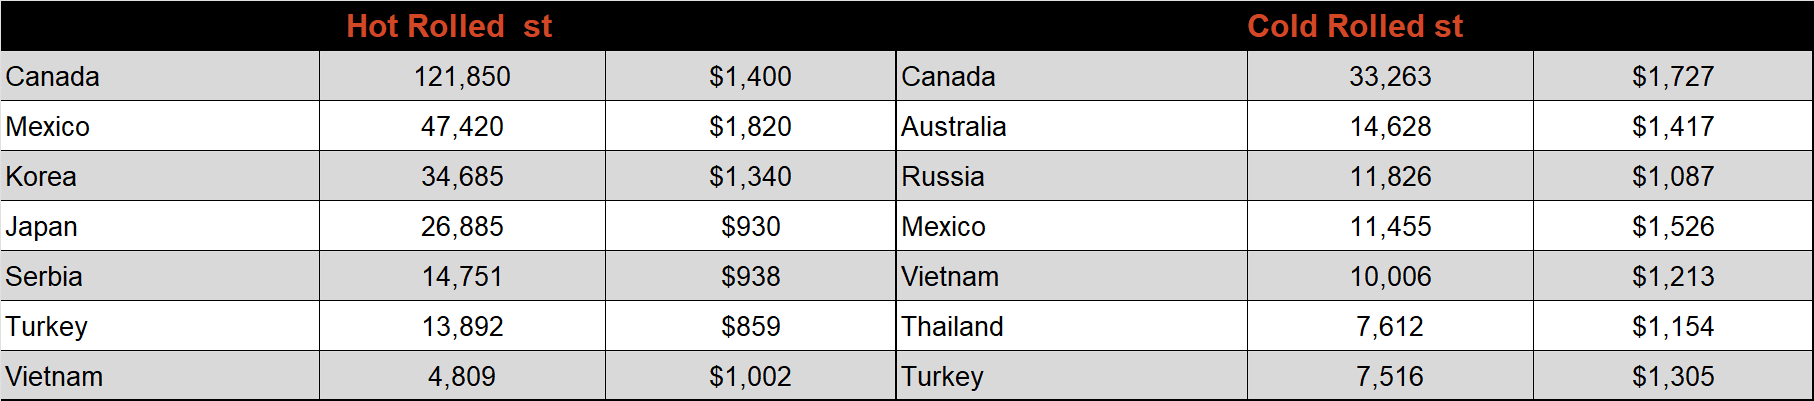
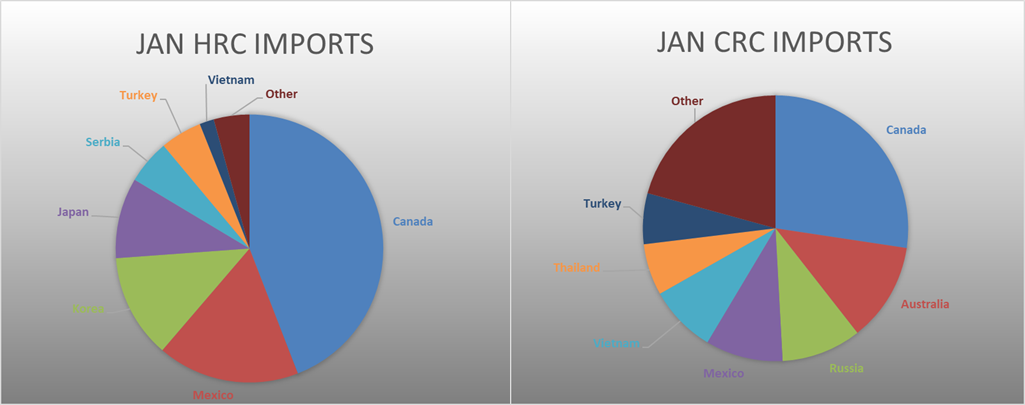
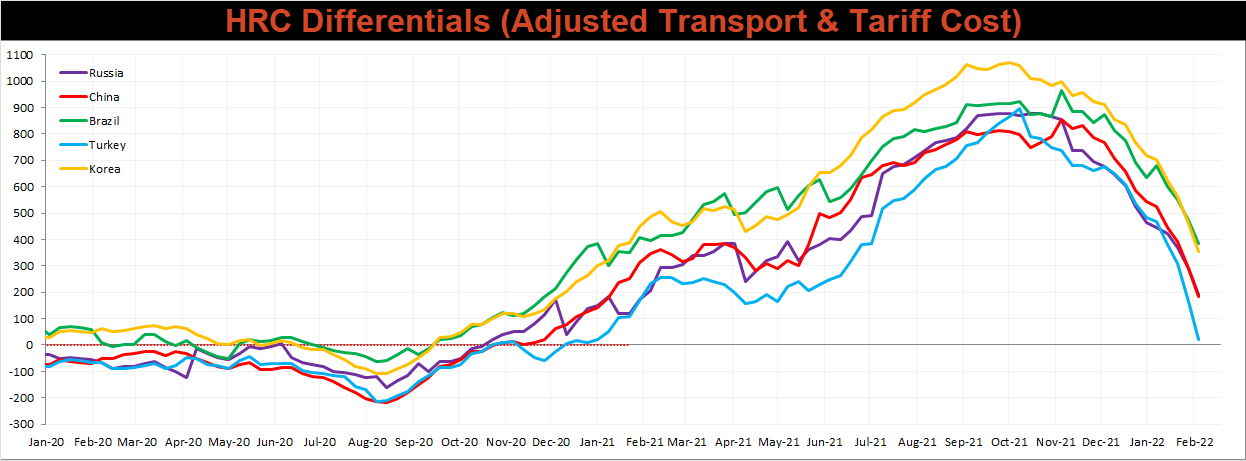
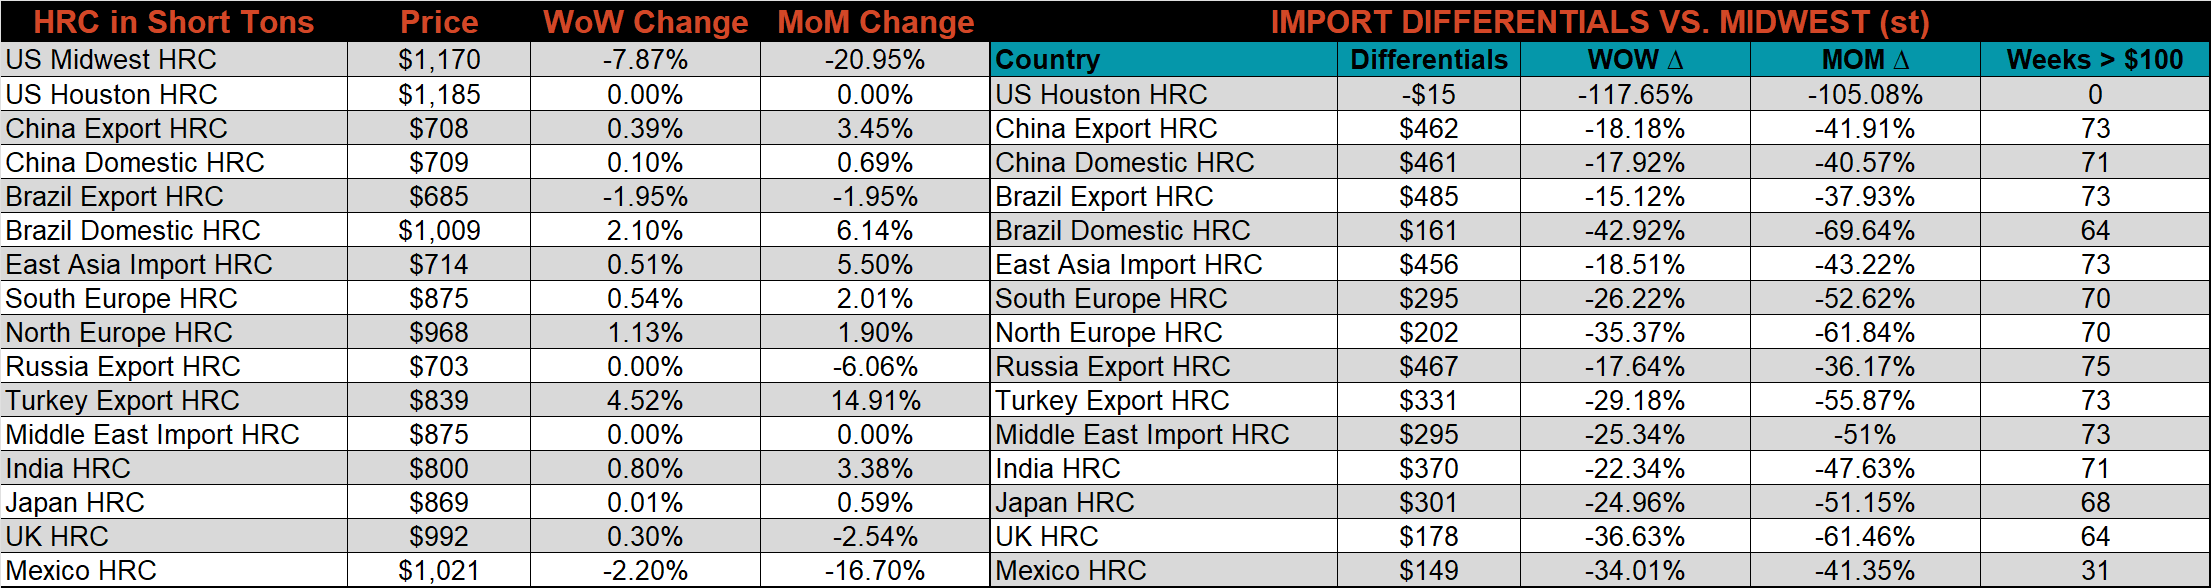
Below is the Midwest HRC price vs. each listed country’s export price using pricing from SBB Platts. We have adjusted each export price to include any tariff or transportation cost to get a comparable delivered price. All the watched countries differentials decreased significantly again this week, as the domestic price continued to decrease. The Turkish price, plus the tariff and transportation cost is currently at parity with the U.S. domestic price.
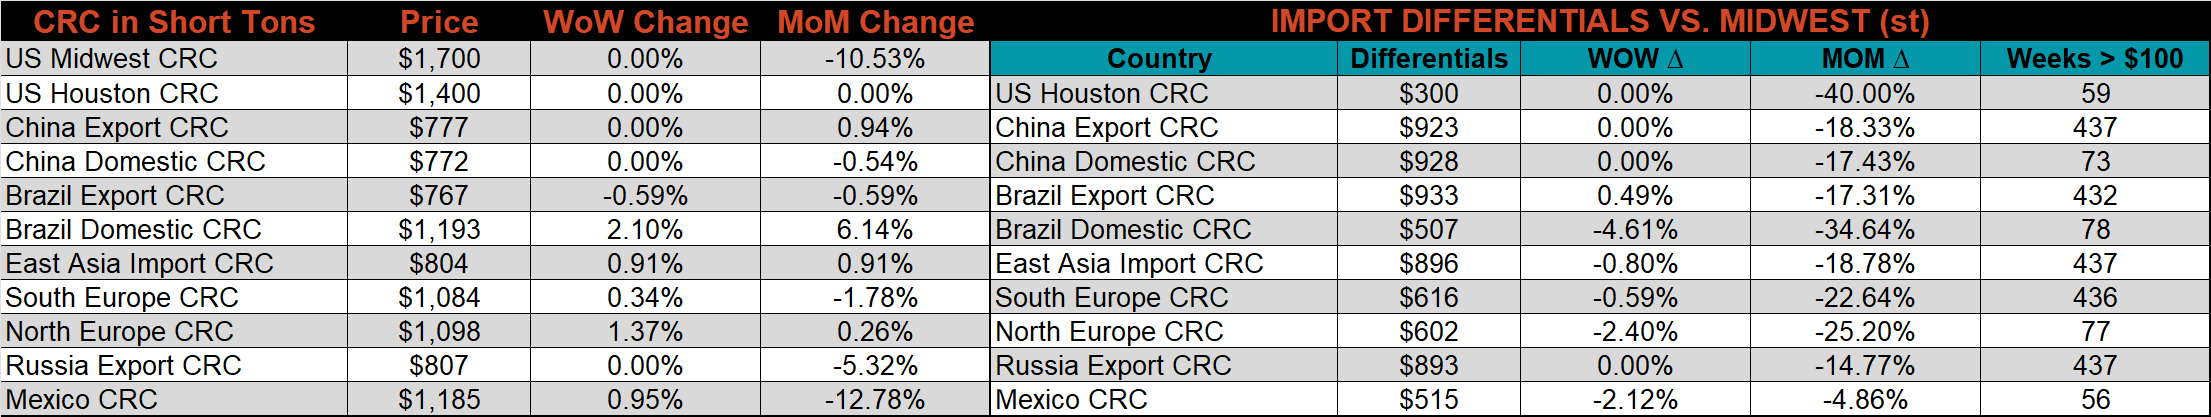
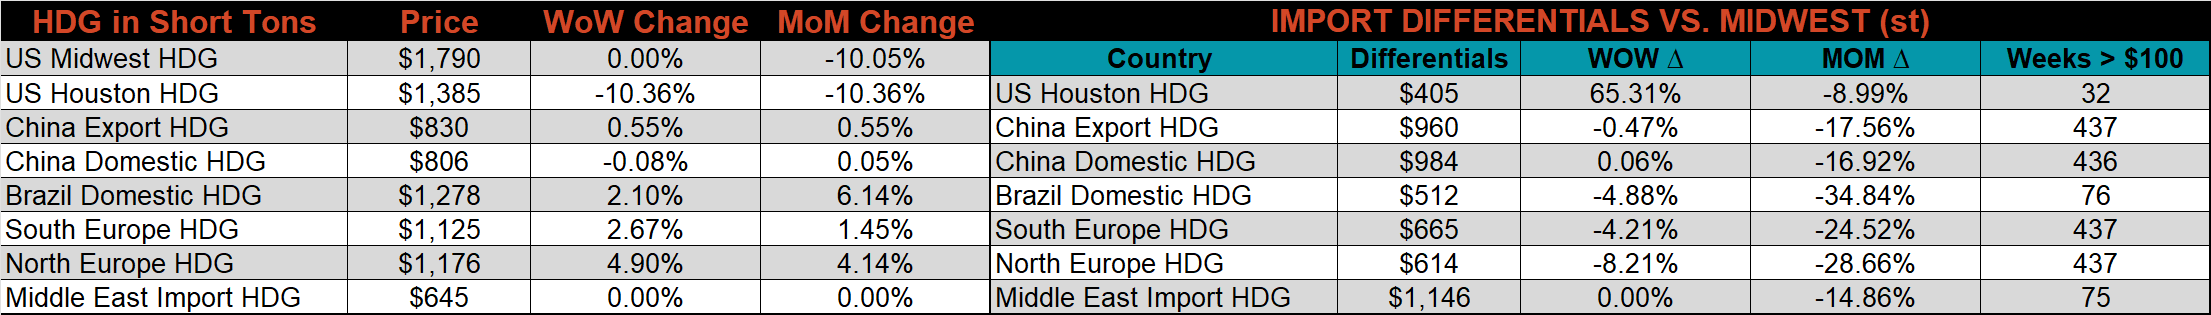
SBB Platt’s HRC, CRC and HDG pricing is below. The Midwest HRC price was down 7.9%, while the CRC & HDG prices were reported as unchanged. Outside of the U.S., the Turkish HRC export price was up another 4.5%.
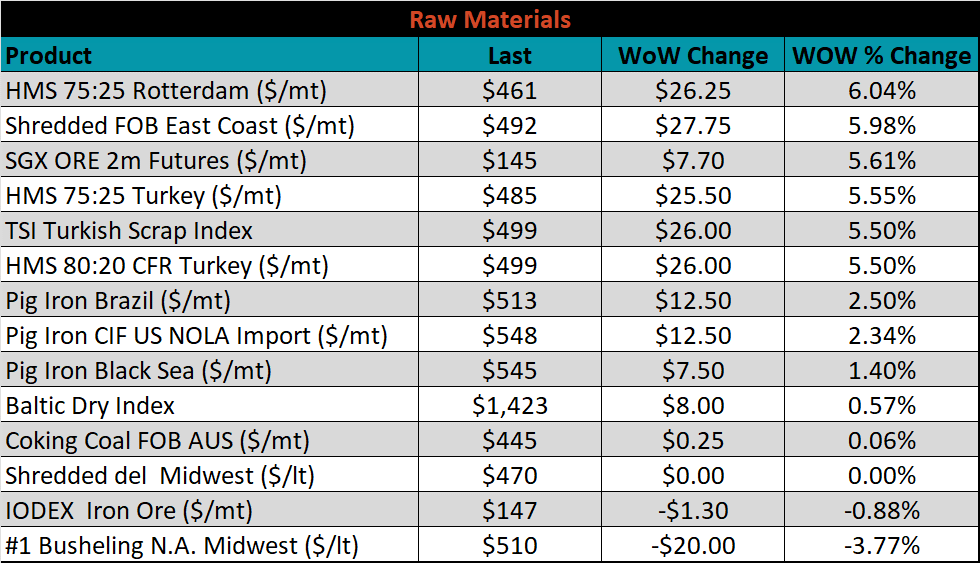
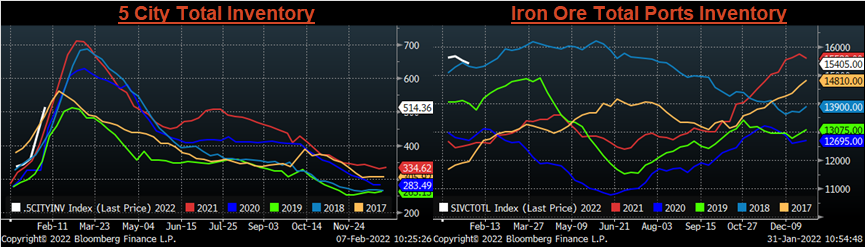
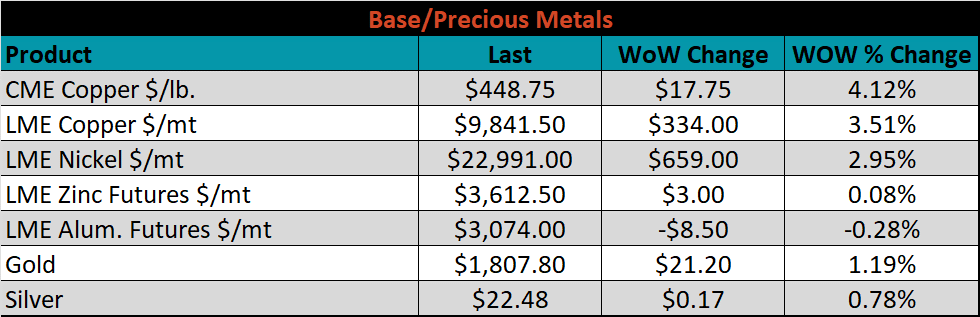
Raw Materials
Raw material prices were mostly higher, led by Rotterdam 75:25 HMS, up 6%.
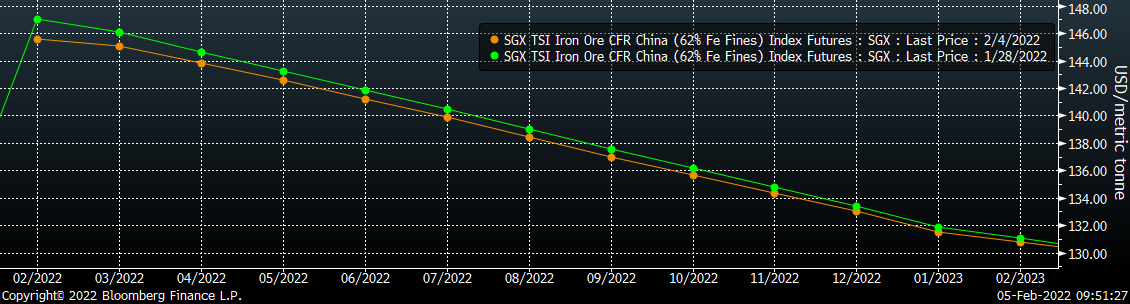
Below is the iron ore future curve with Friday’s settlements in orange, and the prior week’s settlements in green. Last week, the entire curve was slightly lower, more so in the front months.
SGX Iron Ore Futures Curve
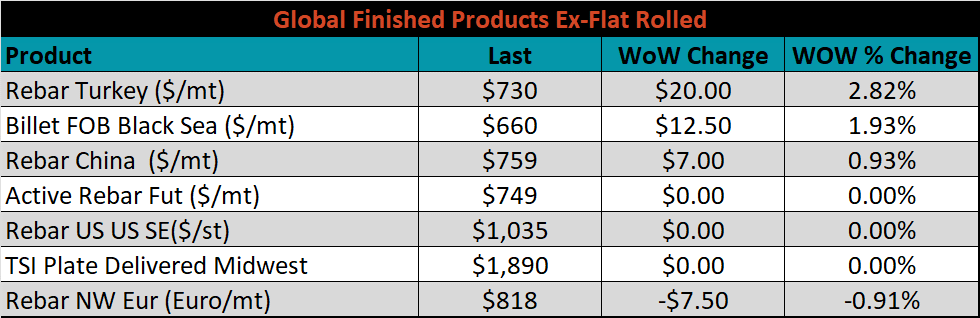
The ex-flat rolled prices are listed below.

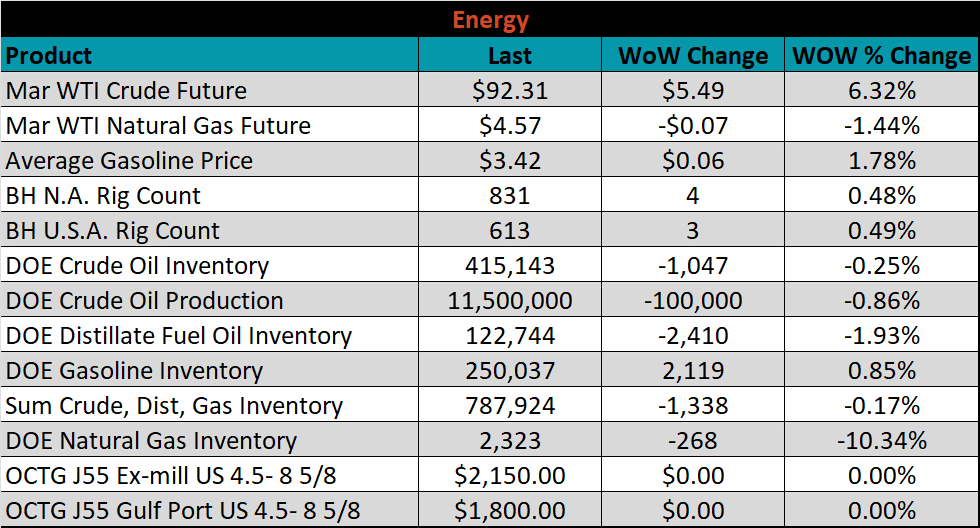
Energy
Last week, the March WTI crude oil future gained another $5.49 or 6.3% to $92.31/bbl. The aggregate inventory level was down 0.2%, while crude oil production dipped slightly to 11.5m bbl/day. The Baker Hughes North American rig count was up by another 4 rigs, and the U.S. rig count was up 3 rigs.
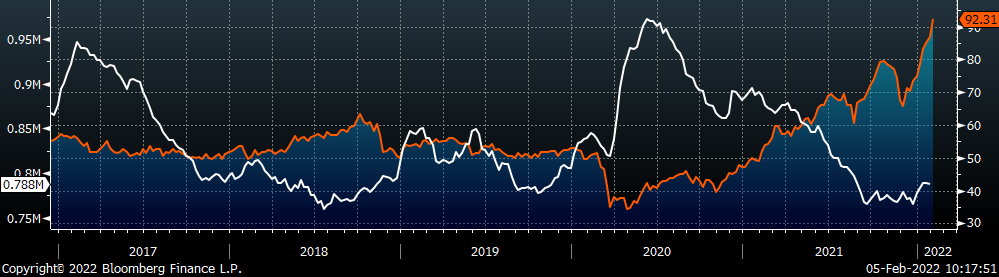
March WTI Crude Oil Futures (orange) vs. Aggregate Energy Inventory (white)
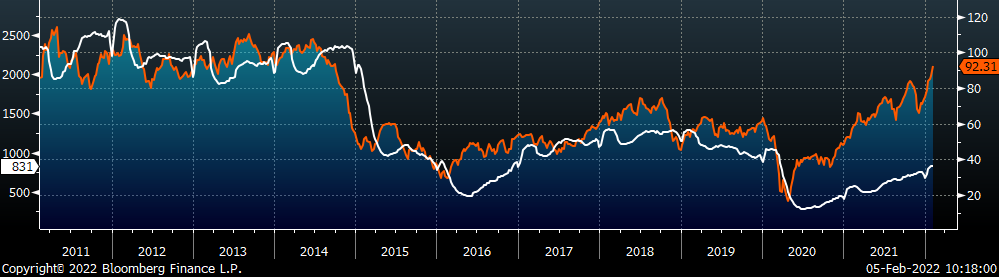
Front Month WTI Crude Oil Future (orange) and Baker Hughes N.A. Rig Count (white)
The list below details some upside and downside risks relevant to the steel industry. The bolded ones are occurring or highly likely.
Upside Risks:
- Inventory at end users and service centers below normal operational levels
- Higher share of discretionary income allocated to goods from steel intensive industries
- Changes in China’s policies regarding ferrous markets, including production cuts and exports
- Unplanned & extended planned outages, including operational issues leaving mills behind
- Energy & construction industry rebound
- Easing labor and supply chain constraints allowing increased manufacturing activity
- Mills extending outages/taking down capacity to keep prices elevated
- Global supply chains and logistics restraints causing regional shortages
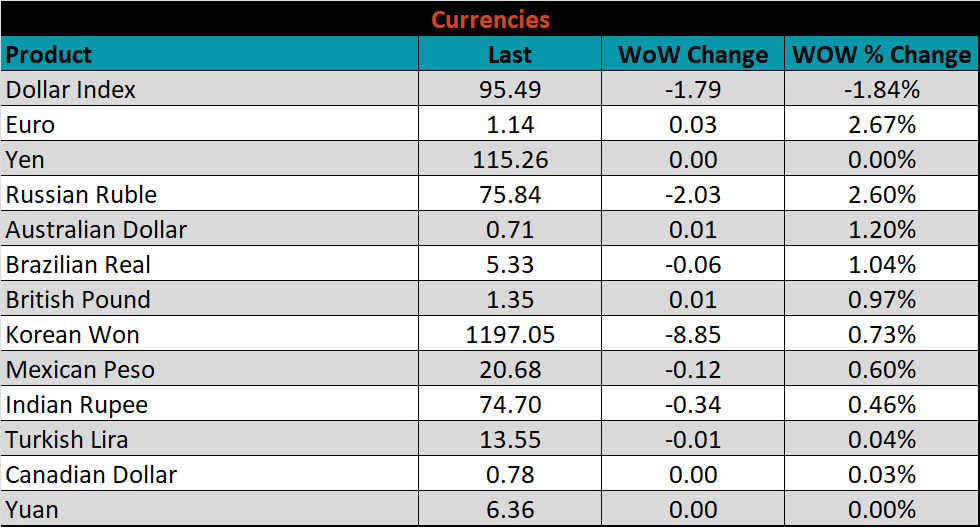
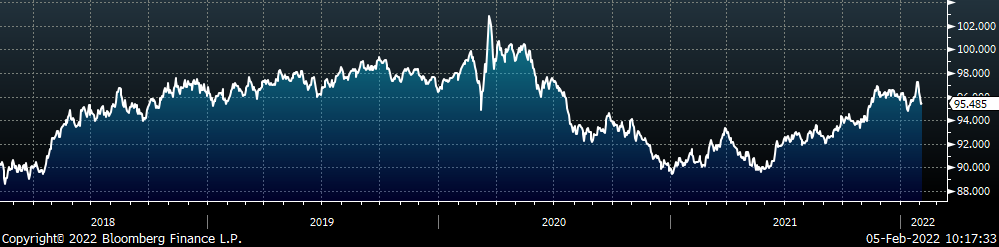
- A weakening US Dollar
- Fiscal policy measures including a new stimulus and/or infrastructure package
- Fluctuating auto production, pushing steel demand out into the future
- Low interest rates
- Threat of further protectionist trade policies muting imports
- Unexpected and sustained inflation
Downside Risks:
- Increased domestic production capacity
- Elevated price differentials and hedging opportunities leading to sustained higher imports
- Steel consumers substitute to lower cost alternatives
- Steel buyers and consumers “double ordering” to more than cover steel needs
- Tightening credit markets, as elevated prices push total costs to credit caps
- Supply chain disruptions allowing producers to catch up on orders
- Limited desire to restock at elevated prices, causing a “Buyer’s Strike”
- Economic slowdown caused by the emergence of Coronavirus Variants
- Reduction and/or removal of domestic trade barriers
- Political & geopolitical uncertainty
- Chinese restrictions in property market
- Unexpected sharp China RMB devaluation