Content
-
Weekly Highlights
- Market Commentary
- Risks


The march higher in HRC prices continued last week as tightness in the spot market persists and prices trend towards $1,200/st. Mills are looking to push their offers and spot transactions even higher, and they are waiting for those higher prices before they open their forward order books. This week’s report analyzes several of the key economic data releases from last week, the key take away being that the steel demand recovery and strength are intact. The largest problem that manufactures are facing is they have too little inventory for their immense and growing order books. Several of the dynamics that have previously been identified as “cracks” in the bull case for HRC prices have recently dissipated including iron ore, scrap and Chinese HRC prices. This, along with the unwavering demand outlook, leaves a clear path higher in the short-term for domestic steel prices. Because of the lack of activity in the spot market, we will once again take a look at the forward curve this week, where volatility and opportunities are widespread.
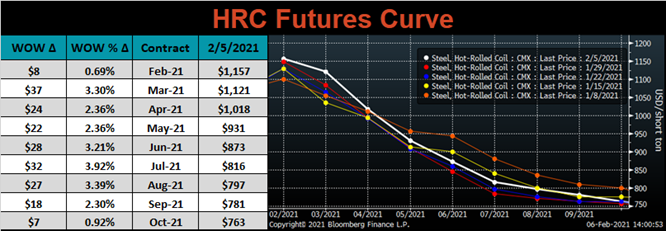
Two weeks ago we discussed how speculators were pushing the forward curve lower as they bet on an eminent price decline. The below chart shows how the HRC curve has reacted since then, with today’s curve in green, and the January 29th curve in orange. The bottom panel shows the dollar per short ton difference in prices between the two.
With the front of the curve up approximately $100/st during the period, it appears the speculative short positions “lost” that bet. However, even with the move up in the curve, the shape continues to show lower prices starting in the second quarter. It is important to understand that this doesn’t necessarily mean the market’s expectation is for lower prices. This shape is a reflection of spot market supply and demand, where there is a premium for having material in hand today during a supply deficit. That premium does not apply for material in the future because there is uncertainty as to the future supply and demand dynamics. However, as time passes without changes in market dynamics, the curve should adjust higher in near term expirations to reflect the similar expected tightness in those months.
This presents an opportunity for physical market participants who have risks directly tied to steel prices and availability. For example, there are spot buyers who are unable to procure the necessary material for their business right now. If enough supply enters the market over the next few months allowing buyers to fully supply their business needs, spot prices would likely adjust lower. However, if the current tightness lasts, prices will likely move even higher, harming those businesses without enough steel. Buying the curve as a hedge will allow those businesses to profit in their worst case scenario of being undersupplied. If the market does turn lower with more available supply, the business will fill its supply needs, and the hedge does not necessarily lose. Because of the steep backwardation (downward slope) in the curve, the hedge is purchased at a discount to the current spot price, which may even end up below the spot price when the hedged month arrives, resulting in a “win – win” for buyers and their businesses.
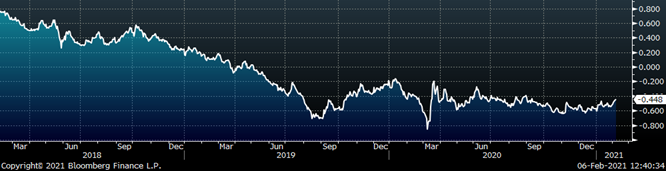
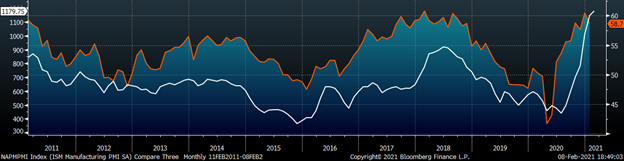
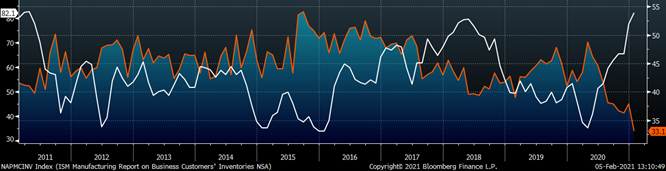
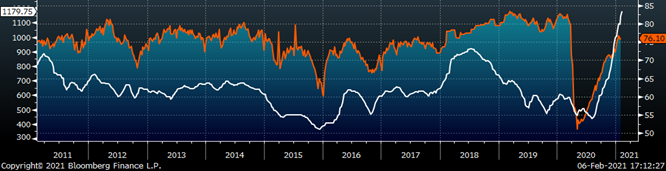
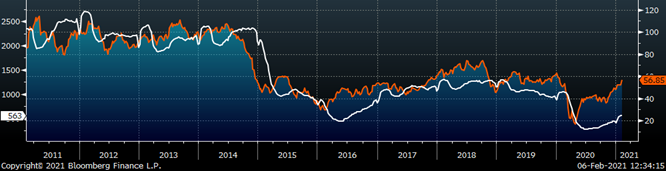
The chart below shows the relationship between the Platts Midwest HRC index and the ISM Manufacturing PMI over the past 10 years.
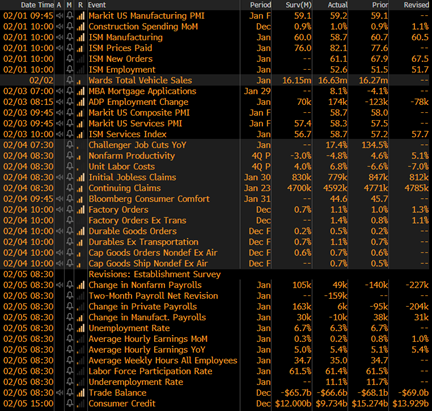
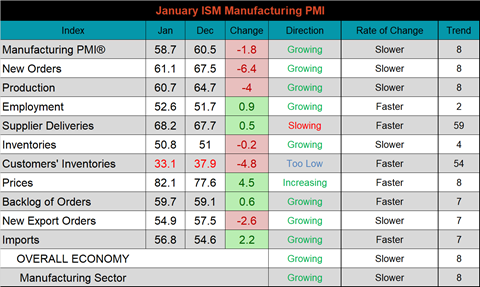
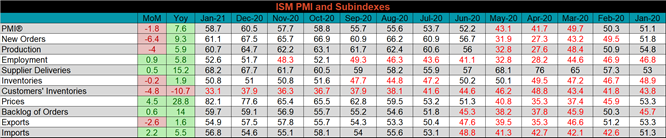
The January ISM Manufacturing PMI and subindexes are below. The topline PMI number was down 1.8 points to 58.7 but remains well into expansion territory.
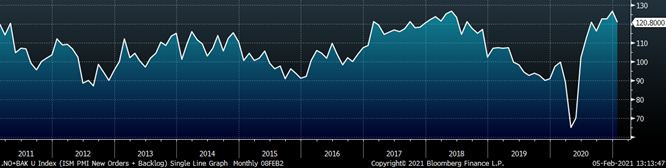
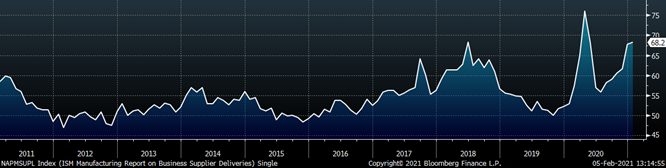
The chart below compares the ISM prices subindex with the ISM customer inventories subindex. The prices subindex was up 4.5 points, and is at the highest level since 2011, while the customers inventories subindex printed its lowest reading since December 2009. The second chart shows the new orders plus backlog subindexes. New orders were down compared to last month, but remain firmly in expansion territory, while the backlog moved slightly higher. Even after the decrease, this reading is among the highest of the previous decade. The final chart shows the supplier delivery subindex increasing further. The summation of all the charts tells a clear story around the strength in domestic manufacturing over the past 6 months. Prices are increasing as broad-based demand for manufactured goods continues to grow. Additionally, uncertainty in the spring caused many customers to destock and hold slim inventories forcing them to decide now between paying significantly higher prices or waiting to buy and leaving current and future orders unfilled.
PMI subindexes were mixed MoM, but significantly higher than last year’s levels. Imports increased and exports remain strong but dipped compared to last month. Employment has now printed in expansion territory twice in a row for the first time since the summer of 2019.
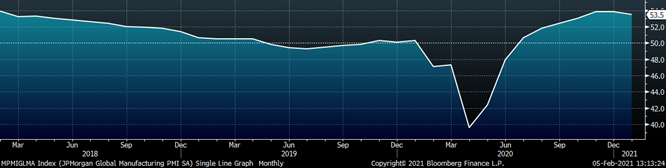
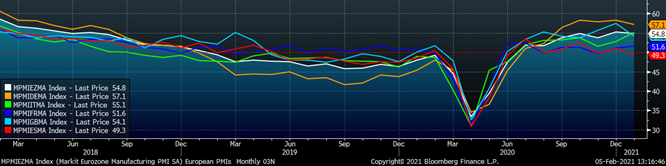
January global PMI printings remain strong, with 22 of the 25 watched countries in expansion (above 50) territory. The Japanese PMI dipped slightly and moved into contraction.
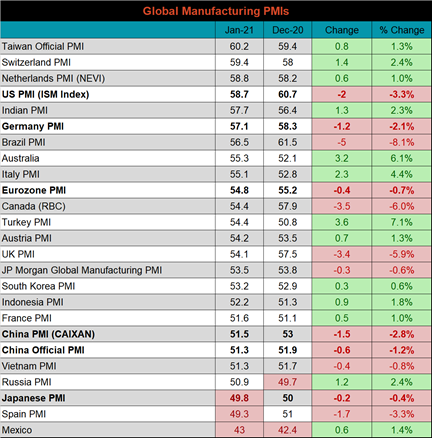
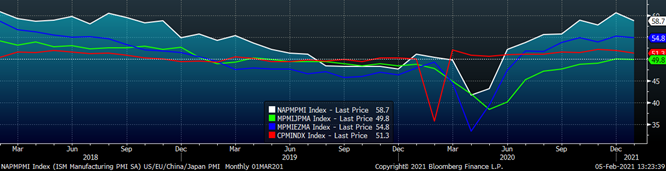
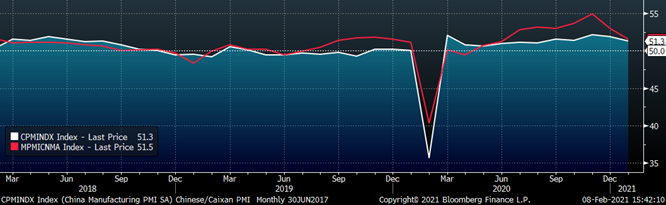
Both China’s official manufacturing PMI and the Caixan PMI decreased but remain in expansion.
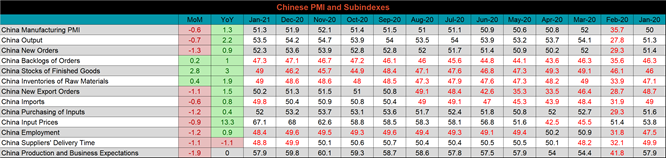
The table below breaks down China’s official manufacturing PMI subindexes, which was mostly lower MoM, but strong compared to January 2020. Input prices remain extremely high compared to last year.
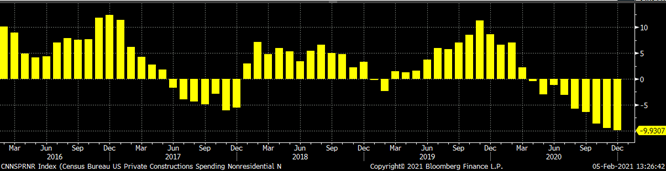
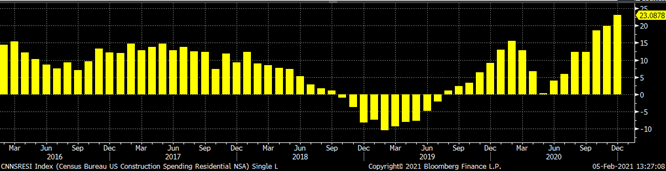
December seasonally adjusted U.S. construction spending was up 1% compared to November, and 5.7% higher than a year ago.
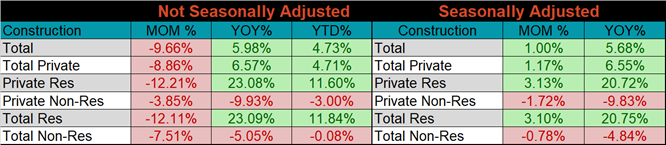
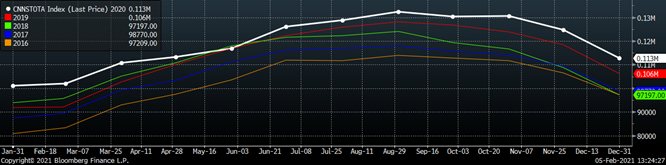
The white line in the chart below represents not seasonally adjusted construction spending in 2020 and compares it to the spending of the previous 4 years. Spending in December was down compared to November but remains well above last year’s levels. The last two charts show the YoY changes in construction spending. Private non-residential spending decreased further in December, for the ninth month in a row, while residential spending shows no sign of slowing down and continues to grow.
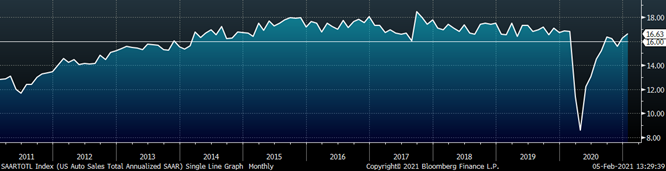
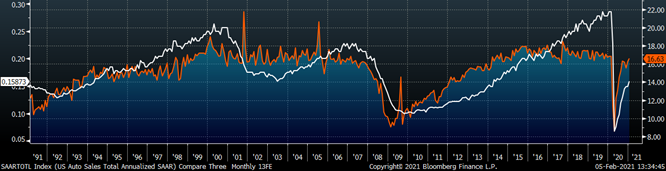
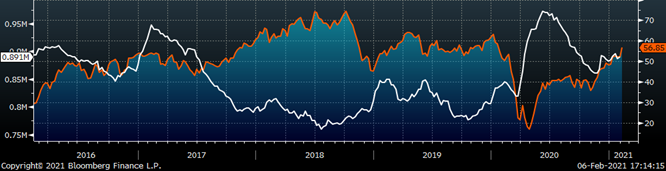
January U.S. light vehicle sales increased to a 16.6m seasonally adjusted annualized rate (S.A.A.R). The second chart shows the relationship between the unemployment rate and auto sales. The unemployment rate is inverted to show that declining unemployment typically leads to increasing auto sales. Both regained some momentum and continue to improve.
Below are the most pertinent upside and downside price risks:
Upside Risks:
Downside Risks:
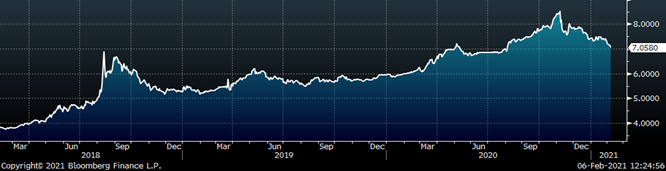
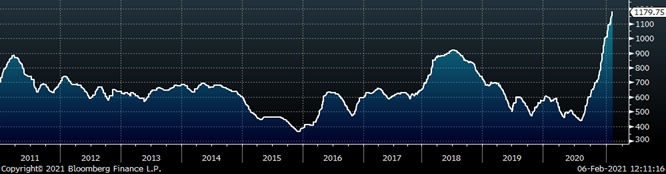
The Platts TSI Daily Midwest HRC Index increased by $33 to $1,179.75.
The CME Midwest HRC futures curve is below with last Friday’s settlements in white. Last week, the curve shifted higher at all expirations.
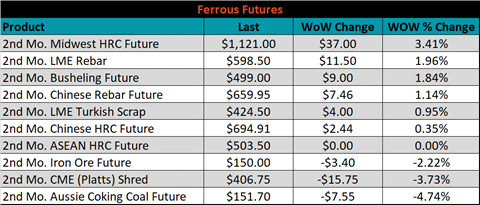
March ferrous futures were mixed. Midwest HRC gained 3.4%, while Aussie coking coal lost 4.7%.
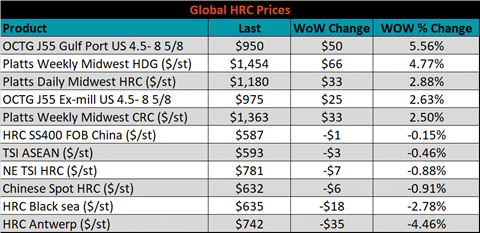
Global flat rolled indexes were mixed. Midwest HDG was up 4.8%, while Antwerp HRC was down 4.5%.
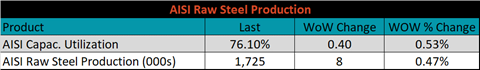
The AISI Capacity Utilization rate increased 0.4% to 76.1%.
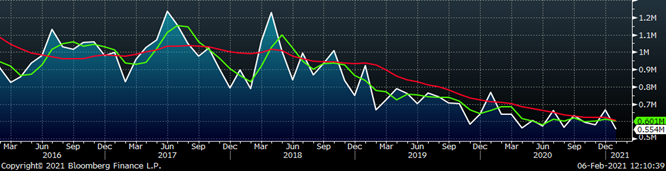
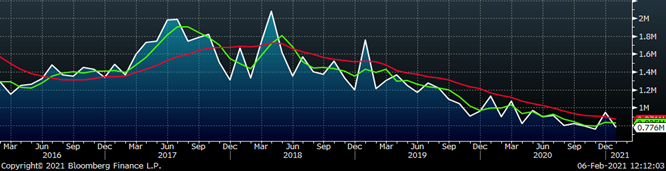
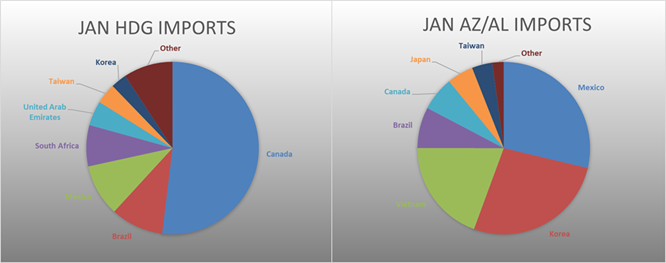
January flat rolled import license data is forecasting a decrease of 112k to 554k MoM.
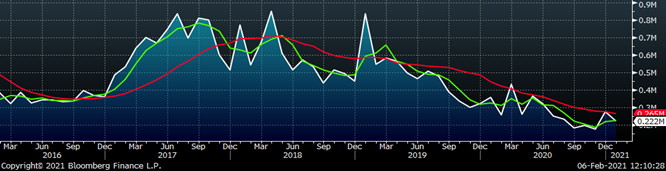
Tube imports license data is forecasting a decrease of 55k to 222k in January.
January AZ/AL import license data is forecasting no change, at 49k.
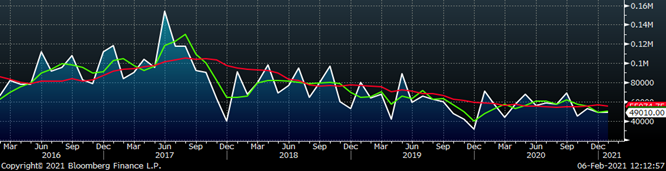
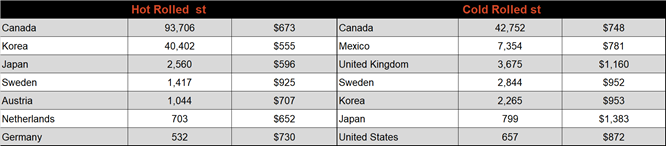
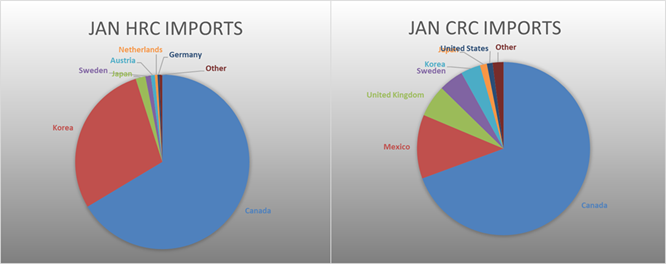
Below is January import license data through February 2, 2021.
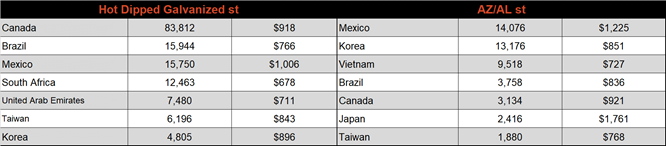
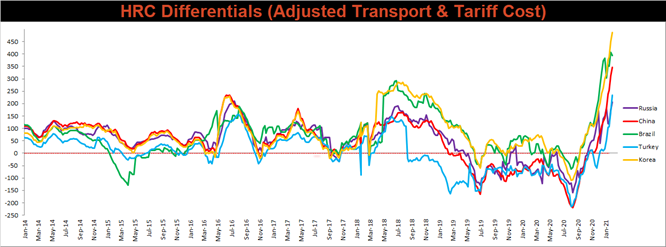
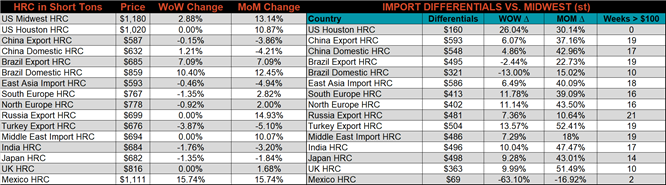
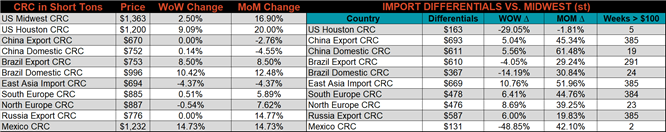
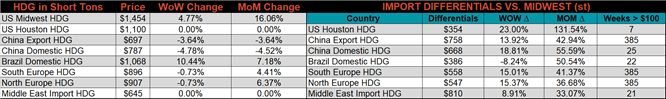
Below is the Midwest HRC price vs. each listed country’s export price using pricing from SBB Platts. We have adjusted each export price to include any tariff or transportation cost to get a comparable delivered price. The Brazilian differential decreased, while all other watch countries differentials increased, as the U.S. continues to show broad strength.
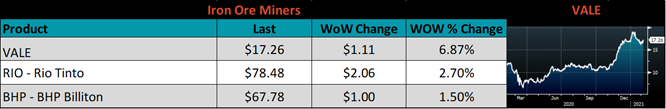
SBB Platt’s HRC, CRC and HDG pricing is below. The Midwest HDG, HRC and CRC prices were up 4.8%, 2.9% and 2.5%, respectively. Globally, the Mexican HRC and CRC prices were up, 15.7% and 14.7%, respectively.
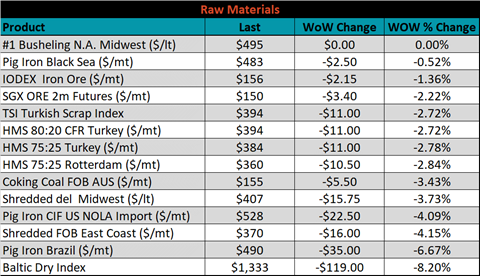
Raw material prices were mostly lower, led by Brazilian pig iron down 6.7%.
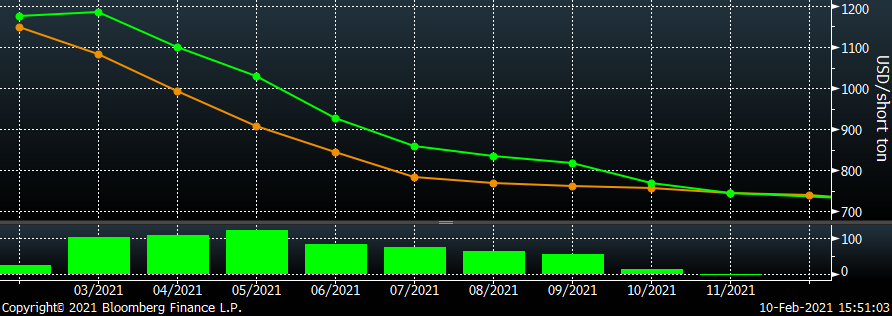
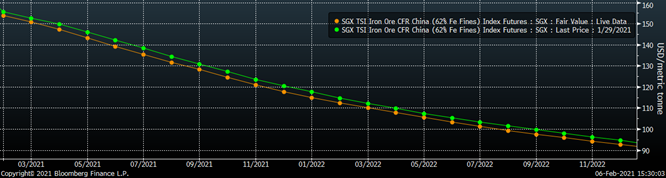
Below is the iron ore future curve with Friday’s settlements in orange, and the prior week’s settlements in green. Last week, the entire curve shifted slightly lower.
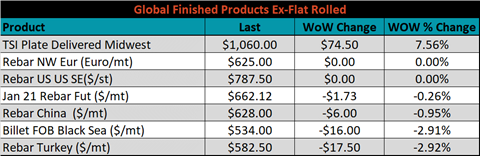
The ex-flat rolled prices are listed below.

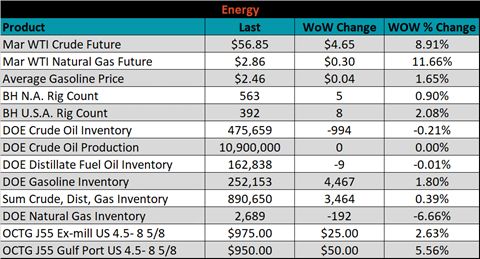
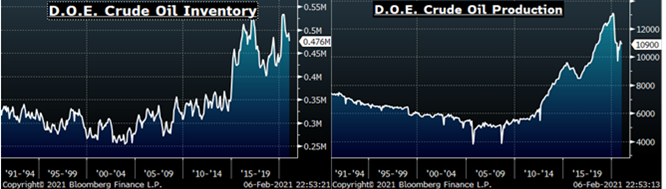
Last week, the March WTI crude oil future gained $4.65 or 8.9% to $56.85/bbl. The aggregate inventory level was up 0.4% and crude oil production remains at 10.9m bbl/day. The Baker Hughes North American rig count was up by another 5 rigs, and the U.S. rig count was up 8 rigs.
The list below details some upside and downside risks relevant to the steel industry. The orange ones are occurring or look to be highly likely. The upside risks look to be in control.
Upside Risks:
Downside Risks: