Content
-
Weekly Highlights
- Market Commentary
- ISM PMI
- Global PMI
- Construction Spending
- Auto Sales
- Risks


Spot activity in the domestic steel market remained muted over the last week as most buyers continue to place tons through their discounted index contracts. Mills remain firm in holding spot offers above the expected transaction prices, but at slightly lower prices than in previous weeks. The HRC futures curve remains in backwardation for February through April, signaling that lower spot prices are expected over the next few months. Additionally, the curve shifted into contango (front month expirations at lower prices than back months) starting in April, which tends to occur as the market is weakening. The busheling scrap curve expects March scrap to move about $10 lower, which would squeeze mill profitability as HRC prices are expected to fall more. These ferrous future curves display market expectations, but historically have been poor predictors of actual prices in the future.
The negative outlook in the market is apparent, and there are several factors that may be driving it. First, the expectation is for slightly higher imports (below) in January compared to previous months as quotas reset and delayed material enters in the New Year. While the level of imports remains historically low, this increase reflects fewer tons placed domestically. Next, we continue to see lingering effects from the coronavirus outbreak in commodity and financial markets. The US Dollar continues to strengthen, as the domestic market remains a safe haven, which puts pressure on global commodity prices. Finally, and most importantly, there was not enough demand in the domestic ferrous market at higher prices to sustain the price rally that started in October. Distributors restocked late last year at significantly lower prices, but as inventory levels shrink, we are not seeing significant restocking at the current spot prices. This leads to two important questions for everyone in the market: What is the demand outlook and what price level will spur this demand?
Last week, several relevant demand indicators (detailed below) were released, and the contents of the ISM Manufacturing PMI report is best to help decipher current manufacturing demand and form future expectations. The below chart shows the Platts Midwest HRC Index and compares it to the headline ISM Manufacturing PMI reading.

The manufacturing PMI bounced back above 50 into expansionary territory in January after declining throughout 2019. This index is one of the best gauges of manufacturing demand, and it tends to closely track the spot HRC price. The move up in January follows the rally in HRC prices seen at the end of last year, and reflects the view that the demand outlook is strengthening compared to the end of 2019. This leads us to believe that while the current spot HRC price may be too high, the actual price that will incentivize buyers is much higher than where it bottomed in October of last year. The futures curve shows expectations of prices bottoming near $550, which provides a great risk/reward for buyers to lock in prices for the year. Moreover, should demand surprise to the upside, spot prices may bottom at a much higher price, and those who waited for lower prices would have missed this opportunity.

The January ISM Manufacturing PMI and subindexes are below. The topline PMI number was up 3.1 points and printed into expansion for the first time since July of last year.
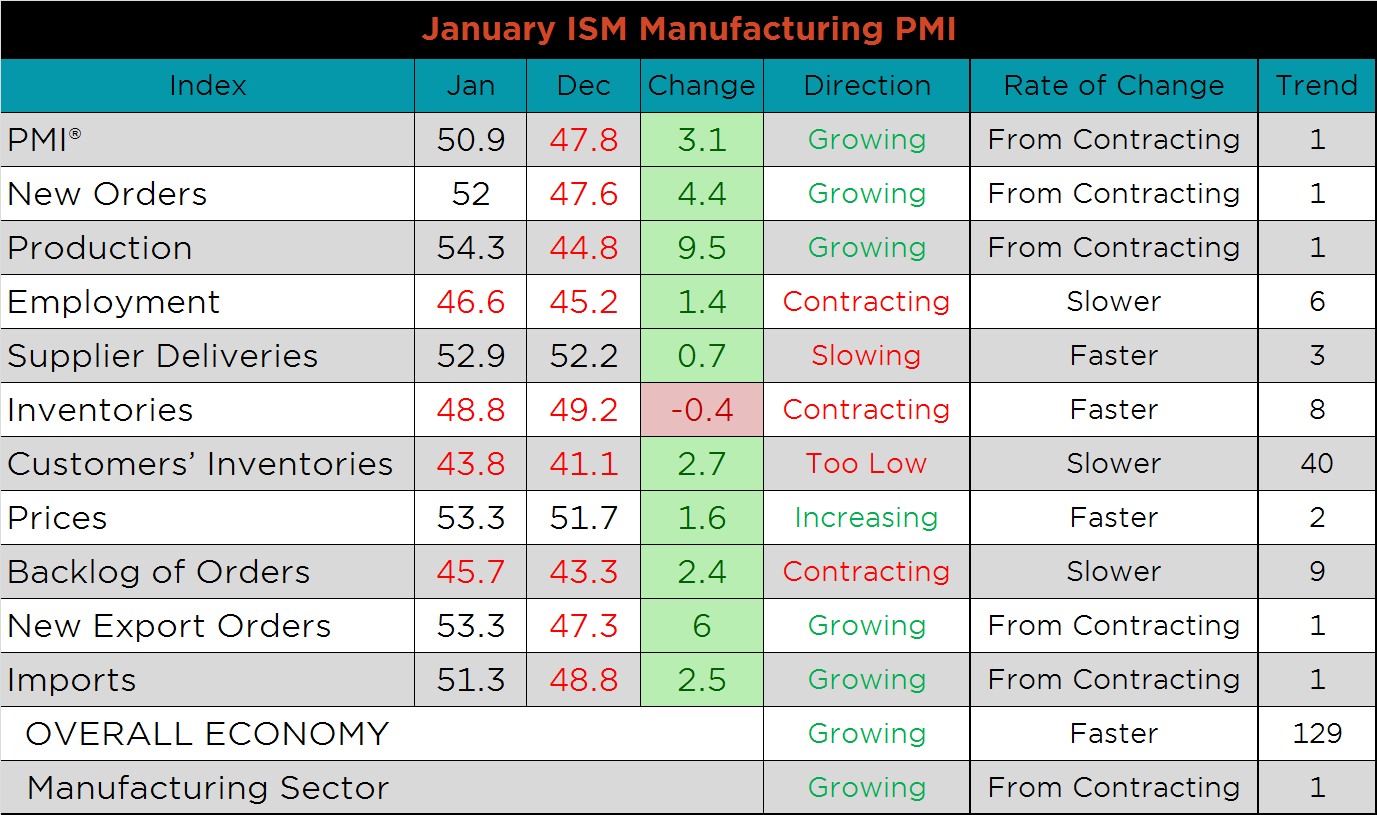
The chart below compares the ISM prices subindex with the Platts TSI Daily Midwest HRC Index, which have both increased over the last few months. HRC prices have leveled off recently, and we expect the ISM Price subindex to move lower next month with the recent declines in commodity prices. The second chart adds the new orders and backlog subindexes together, giving an indication of demand within the manufacturing sector, which continues to strengthen. The last chart shows the production subindex, which rebounded significantly in January after steadily declining throughout 2019. This rebound reflects production deferred from December of 2019 and increased activity from new orders in 2020.


All of the subindexes were up MoM, except for inventories, with significant increases in production, new orders, and customer inventories. However, most of the subindexes are still below last year’s levels.


While January’s global PMI printings show improvement compared to last month, 14 of the 24 countries remain in contraction. The US and UK moved into expansion, while South Korea and Switzerland fell into contraction. Germany and the Eurozone PMIs both increased, but remain among the weakest globally.
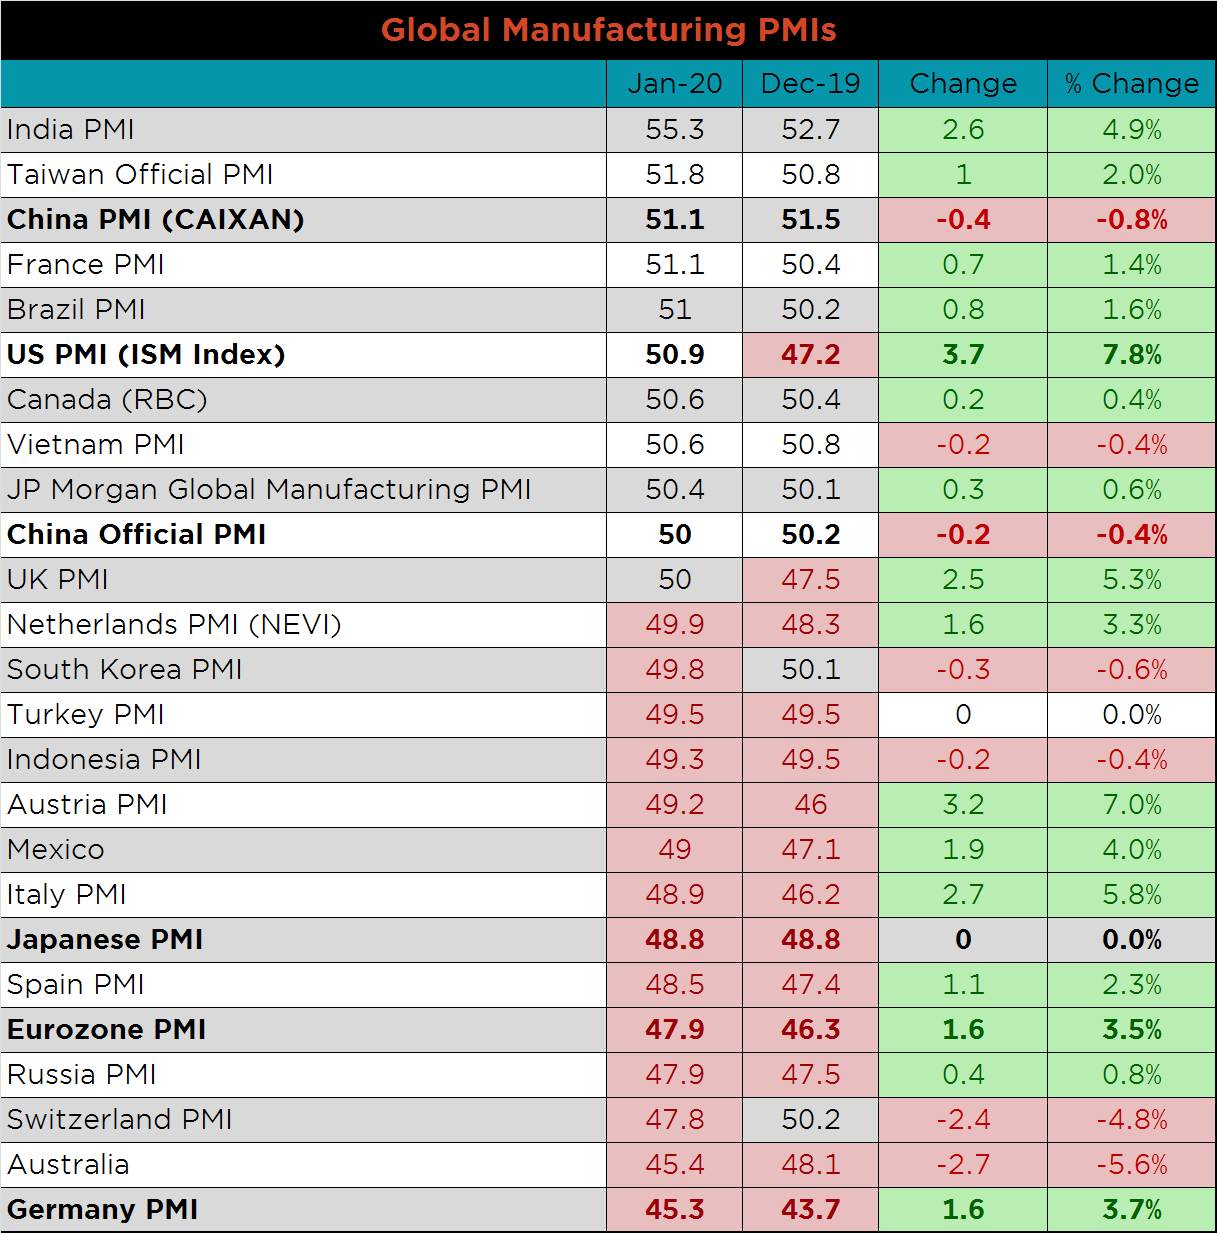


China’s official PMI printed down 0.2 points to 50, and the Caixan Manufacturing PMI printed down 0.4 points to 51.1.

The table below breaks down China’s official manufacturing PMI subindexes. Output, Export orders and Delivery times we down the most MoM, while Production and Business expectations increased dramatically MoM and YoY.


December seasonally adjusted U.S. construction spending was down slightly compared to November, but 5% higher than December of last year. Private Non-residential spending, seasonally adjusted, was the only category down compared to last year.

The white line in the chart below represents construction spending in each month of 2019 and compares it to the spending of the previous 4 years. The last four months, year-over-year spending growth has been positive, offsetting some of the declines early in 2019. The last two charts show the YoY changes in construction spending. Private non-residential spending ended the year relatively flat, while residential spending showed strong growth through the end of the year.


January U.S. light vehicle sales increased to a 16.84m seasonally adjusted annualized rate (S.A.A.R), but have been below their historical average of 17.22m since June. The second chart shows the relationship between the unemployment rate and auto sales. The unemployment rate is inverted to show that declining unemployment typically leads to increasing auto sales. Annualized auto sales have leveled off, while the labor market continues to improve.


Below are the most pertinent upside and downside price risks:
Upside Risks:
Downside Risks:

The Platts TSI Daily Midwest HRC Index was down $8.50 to $587.50.

The CME Midwest HRC futures curve is below with last Friday’s settlements in white. The curve was flat in the front, but rose off last week’s recent lows in the back.

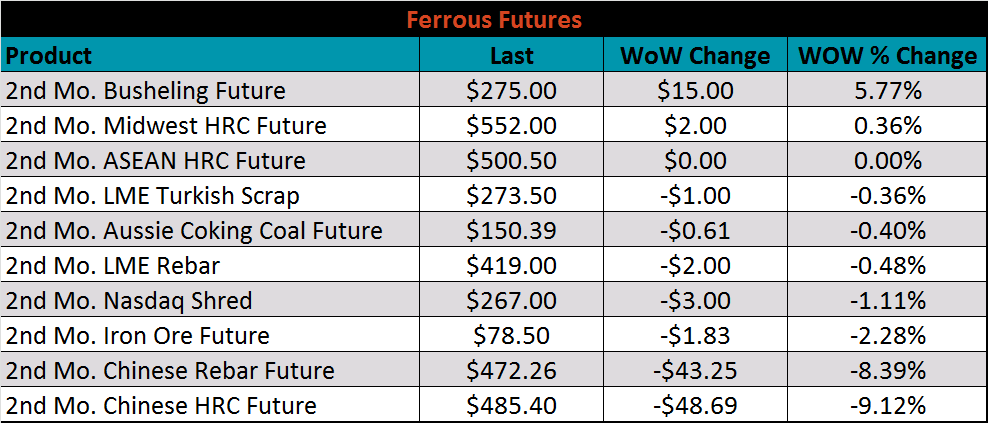
March ferrous futures were mixed. The Chinese HRC future lost 9.1% due to uncertainty around the Coronavirus, while busheling gained 5.8%.
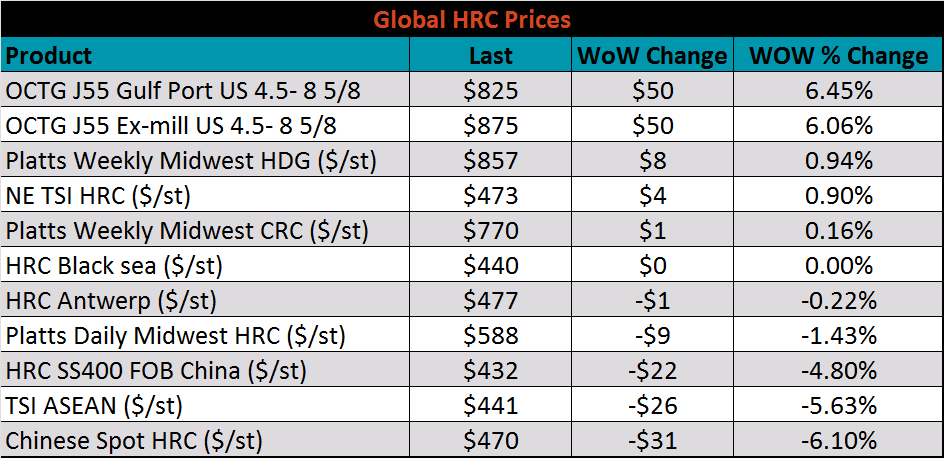
The global flat rolled indexes were mixed. Platts weekly HDG was up 0.9%, while Chinese spot HRC was down 6.1%.
The AISI Capacity Utilization Rate was down 0.2% to 82.1%, but remains at high levels.


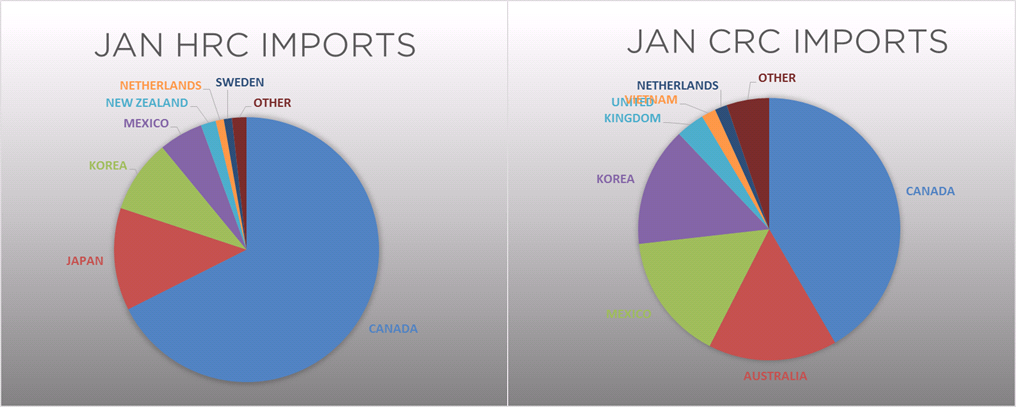
January flat rolled import license data is forecasting an increase of 50k to 691k MoM.

Tube imports license data is forecasting a MoM increase of 17k to 338k tons in January.


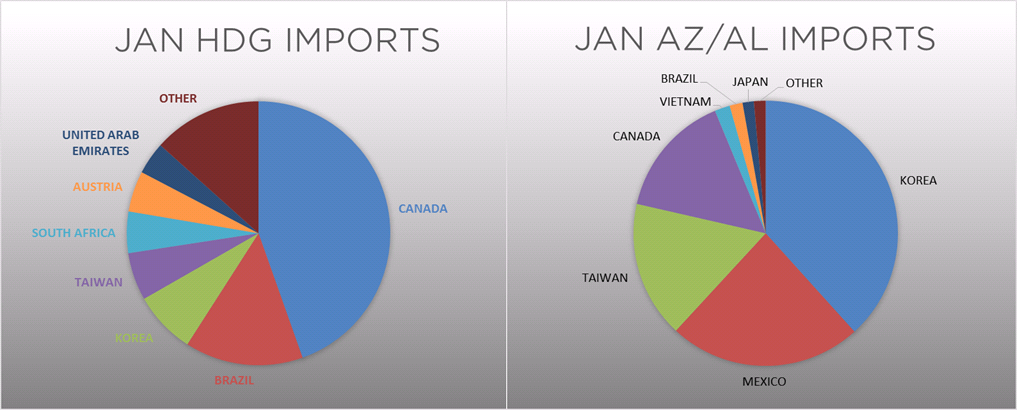
AZ/AL import license data is forecasting an increase of 34k in January to 65k.

Below is January import license data through February 5, 2020.


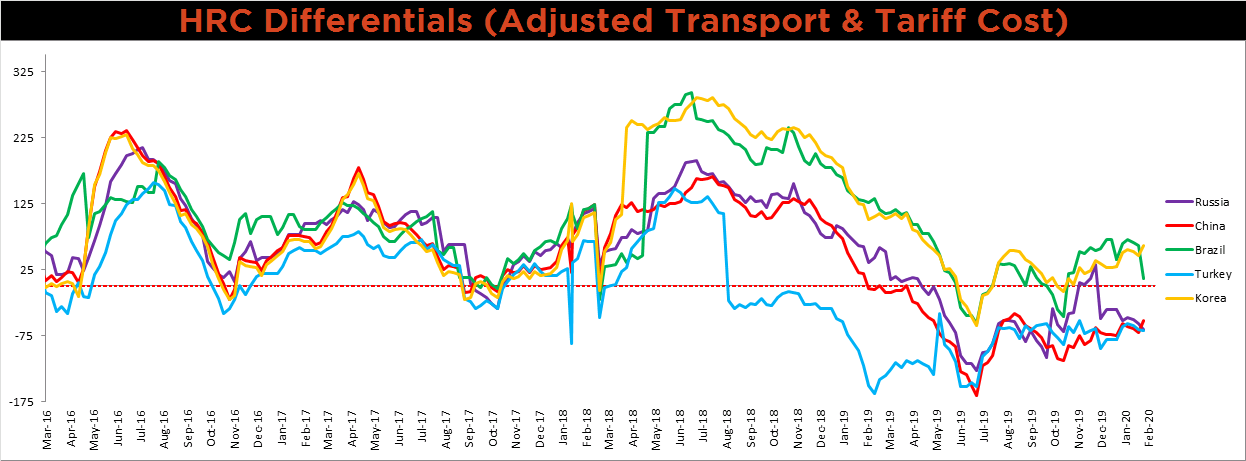
Below is the Midwest HRC price vs. each listed country’s export price using pricing from SBB Platts. We have adjusted each export price to include any tariff or transportation cost to get a comparable delivered price. The Chinese and Korean differentials rose, while the Brazilian, Turkish and Russian differentials moved lower.
SBB Platt’s HRC, CRC and HDG pricing is below. The Midwest HDG and CRC prices were up, 0.9% and 0.2%, while HRC was down 1.4%. The Chinese HRC price was down 4.8%, while Brazilian HRC was up 9.4%.


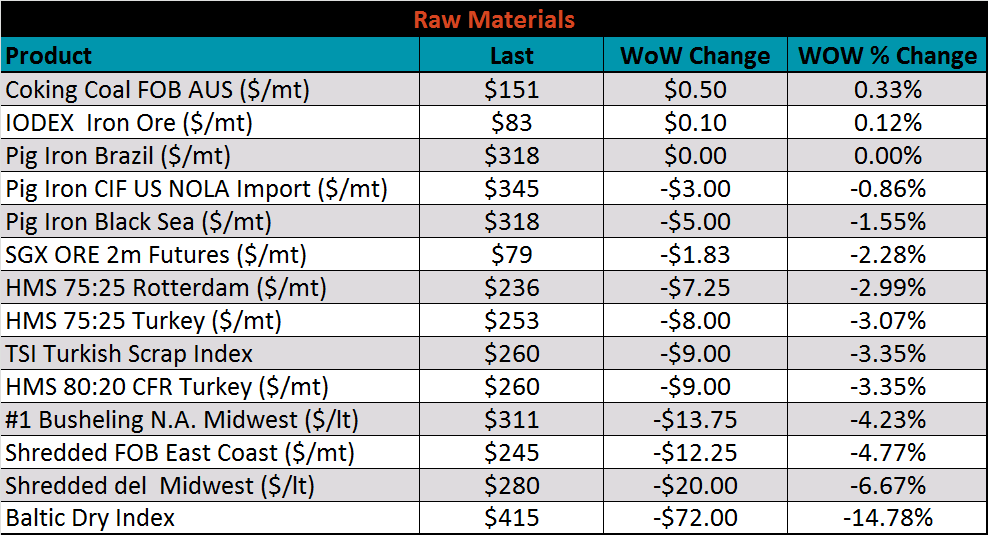
Raw material prices were mostly flat or lower, led by Midwest shredded, down 6.7%.
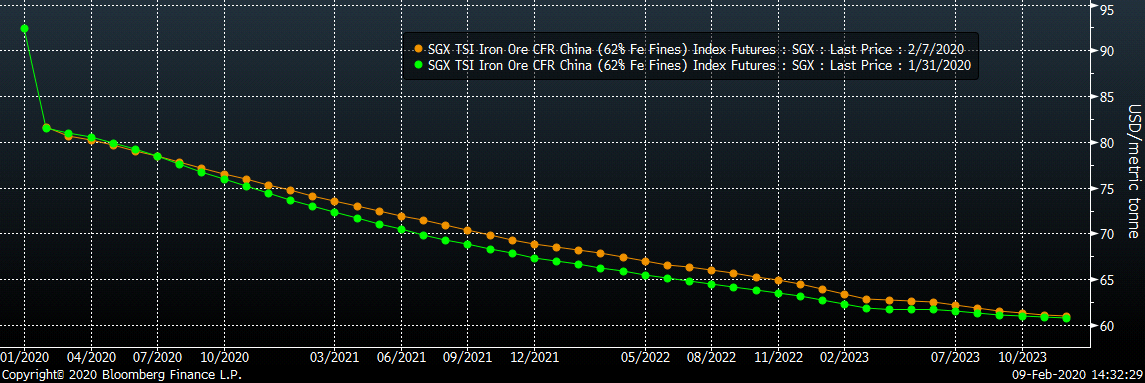
Below is the iron ore future curve with Friday’s settlments in orange, and the prior week’s settlements in green. The front of the curve was realatively flat, while the back shifted slightly higher.
The ex-flat rolled prices are listed below.


Below are inventory levels for Chinese finished steel products and iron ore. After two weeks of no reporting, all of the inventory levels increased dramatically, as expected. However, with the uncertain demand outlook from the coronavirus outbreak, production and inventories may be too high given the current price level.


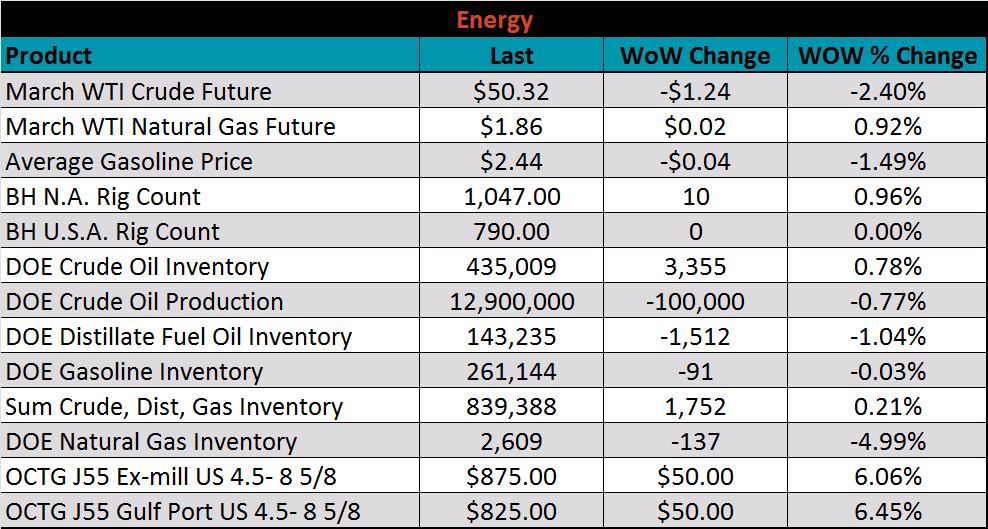
Last week, the March WTI crude oil future lost another $1.24 or 2.4% to $50.32/bbl. The aggregate inventory level was up 0.2% and crude oil production dipped to 12.9m bbl/day. The Baker Hughes North American rig count was up ten rigs, while the U.S. rig count was flat.


The list below details some upside and downside risks relevant to the steel industry. The orange ones are occurring or look to be highly likely. The upside risks look to be in control.
Upside Risks:
Downside Risks: