Content
-
Weekly Highlights
- Market Commentary
- Durable Goods
- Risks


What has been the effect of the steel tariffs?
Is there too much steel in the U.S.?
Will the steel tariffs be reversed?
The answers to these questions are critical to evaluating the price risk in the domestic steel market. The government shutdown resulted in a dark period for data and now that the government has restarted, data releases are backed up. Weekly steel import data has resumed with official November imports released, but only license data for December and January. Steel export data has been updated through November 2018. The following section will look to answer the first question above.
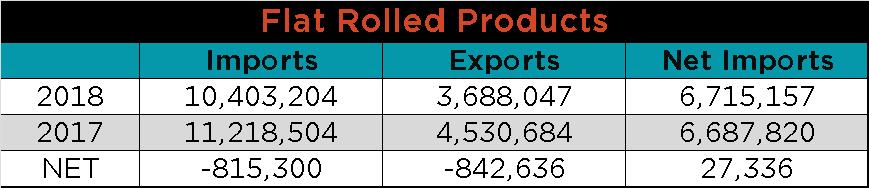
This table totals net imports for January – November 2018 and compares that total to the total of net imports for January – November 2017. For the period, flat rolled imports decreased by 815k tons, but exports decreased by 843k tons. The effect of the tariffs for flat rolled actually resulted in a slight increase in net imports over the period.
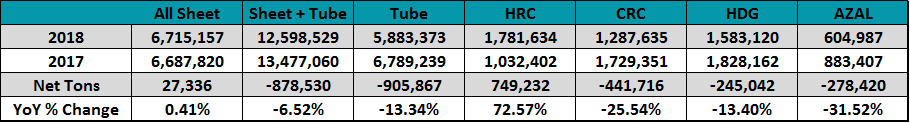
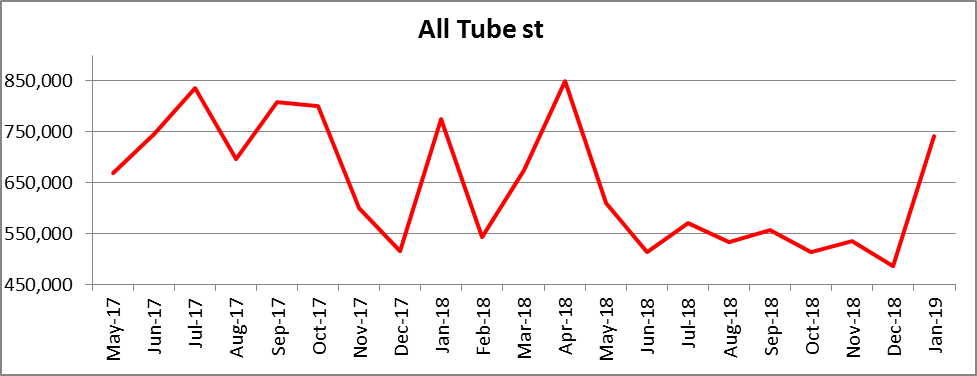
YoY, net imports of hot rolled exploded increasing by almost 750k tons or 72.6%! However, there was a benefit in the value added cold rolled, galvanized and galvalume products with net imports for those products down 25.5%, 13.4% and 31.5%, respectively. The CR – HR and HDG – HR differentials have rebounded sharply off their sub-$100 bottom back into their historically normal $120 area. Imports for tubular goods also saw a drop of 13.3% or just over 900k tons in 2018. For the first eleven months of 2018 vs. 2017, all sheet plus tube net imports dropped 880k tons.
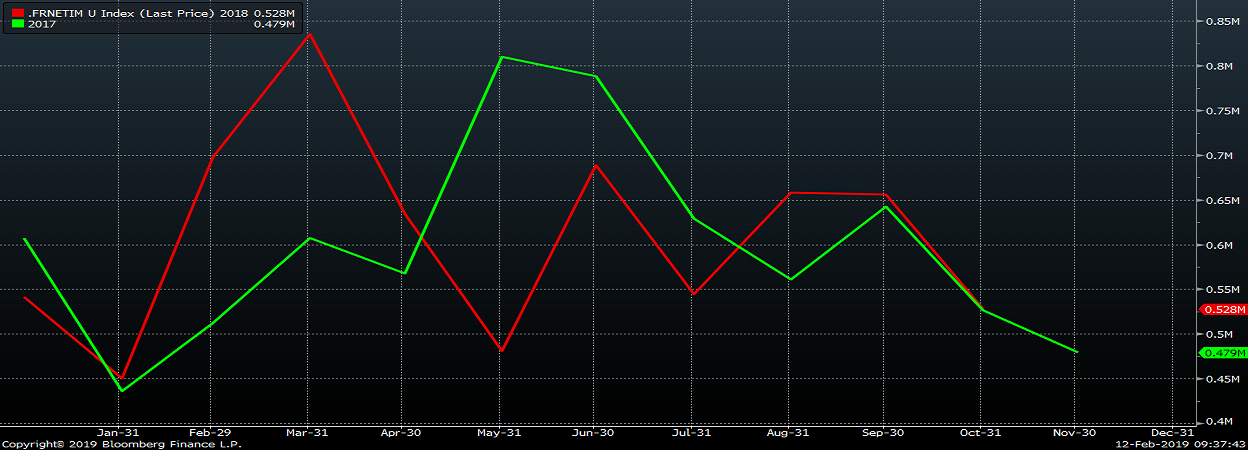
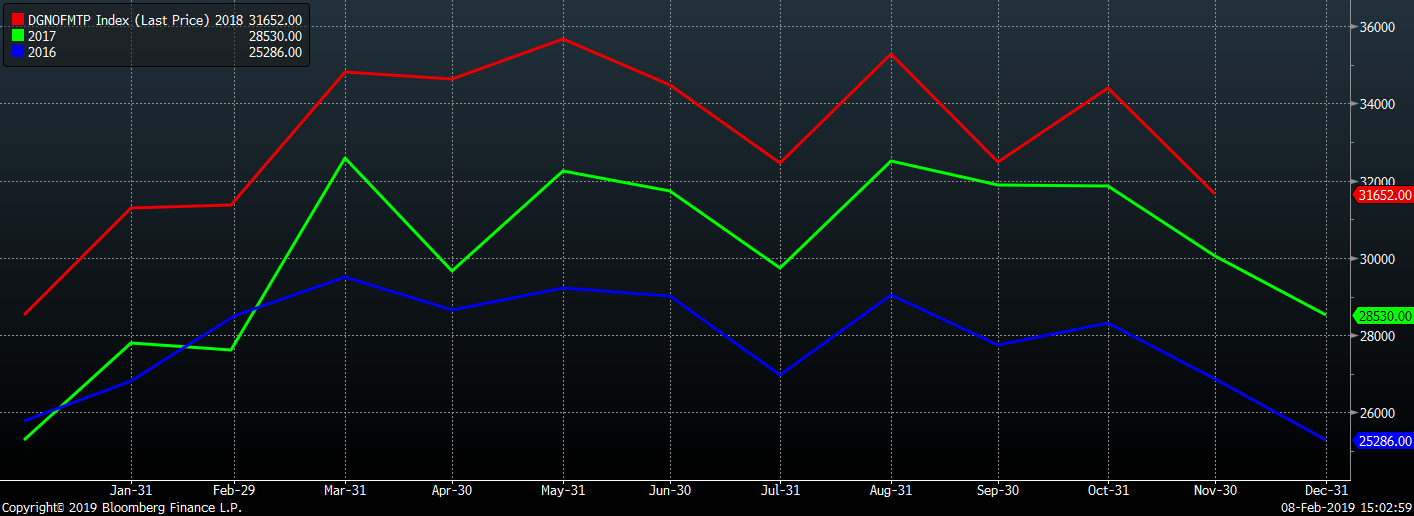
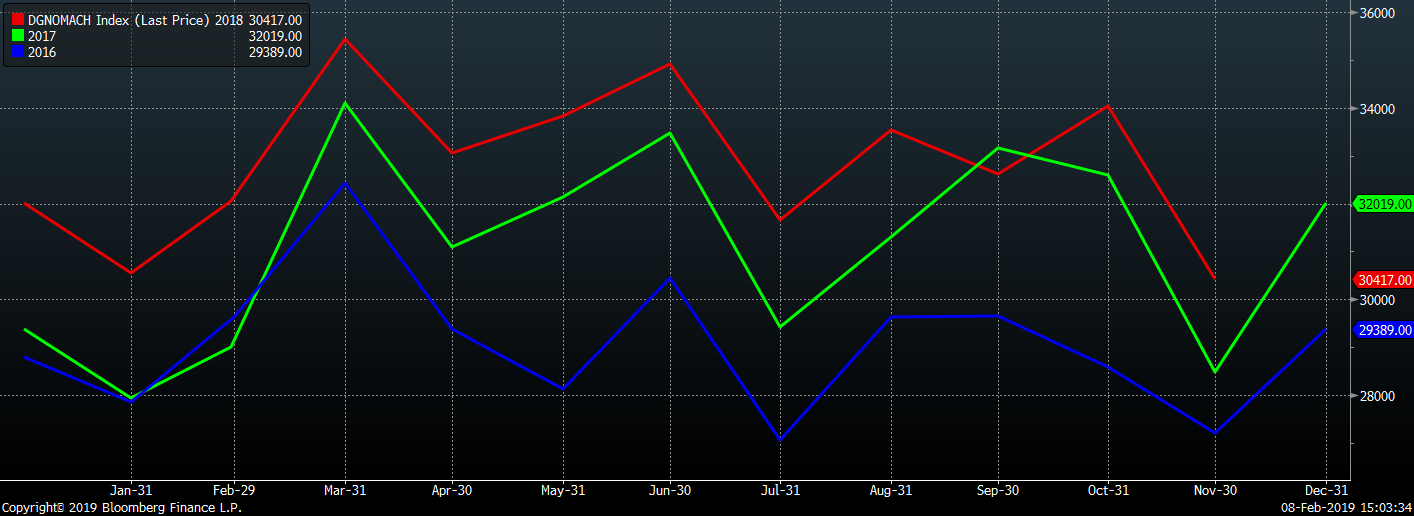
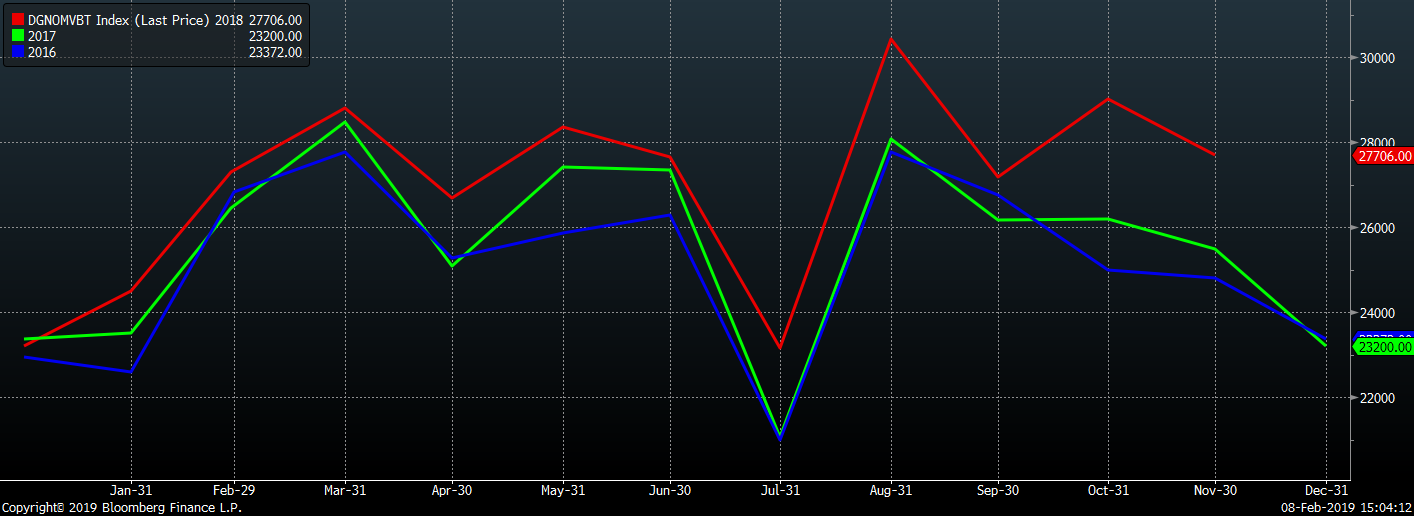
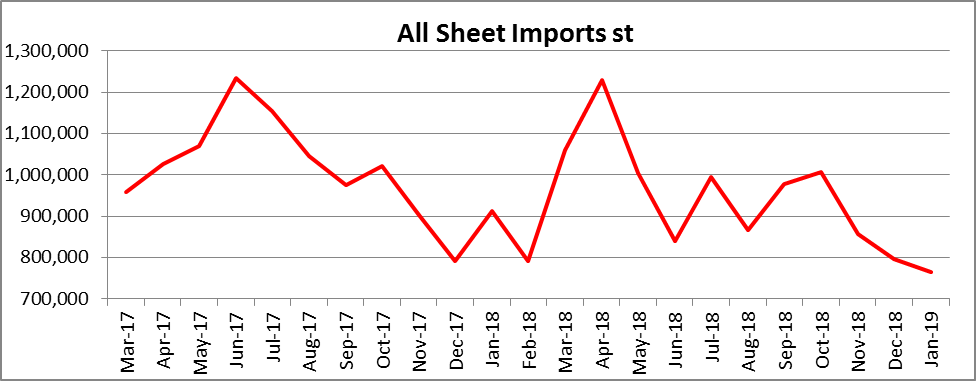
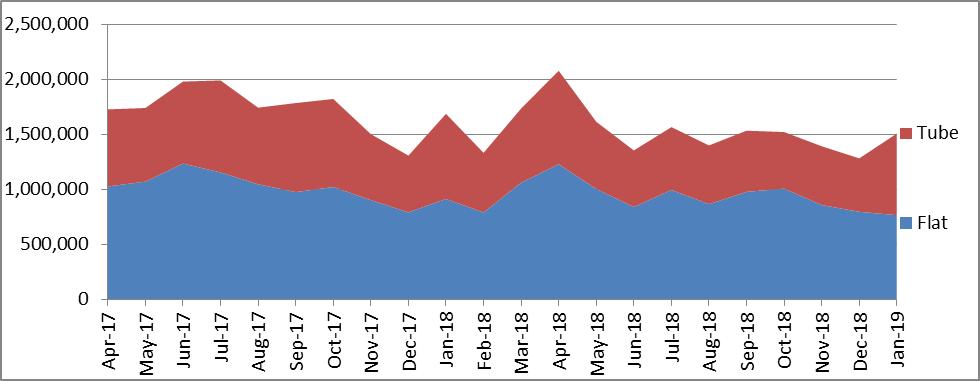
These seasonality charts track monthly data for 2017 and 2018. The spike in flat rolled imports in mid- 2017 and early 2018 were mostly in response to the Section 232 investigation. A dramatic price drop followed both. The 2017 drop was felt more in higher value add products as collapse CR and HDG differentials fell around $80/t. It is uncertain if the steep drop in hot rolled and other value added products that started in the second half of 2018 has bottomed or just taken a pause.
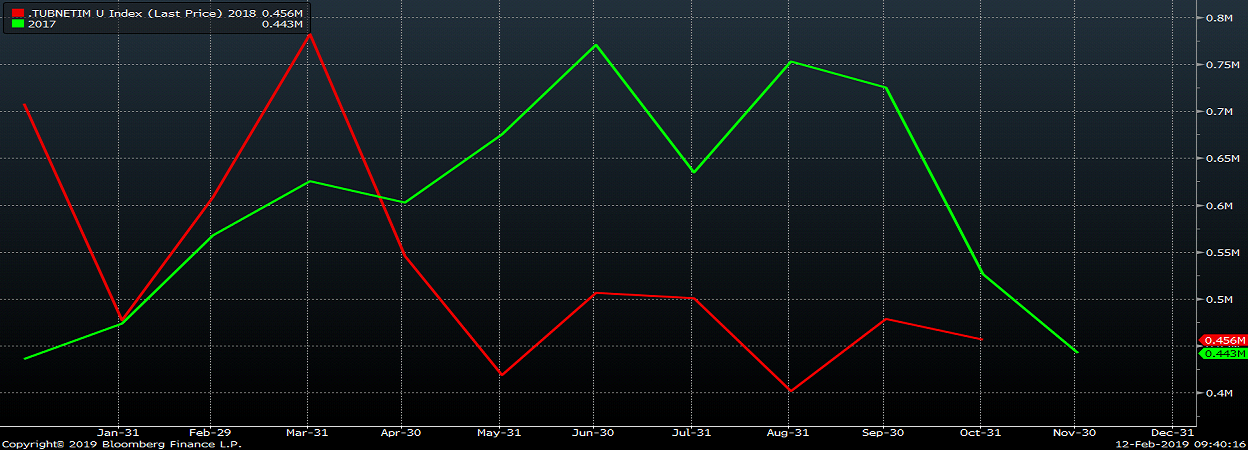
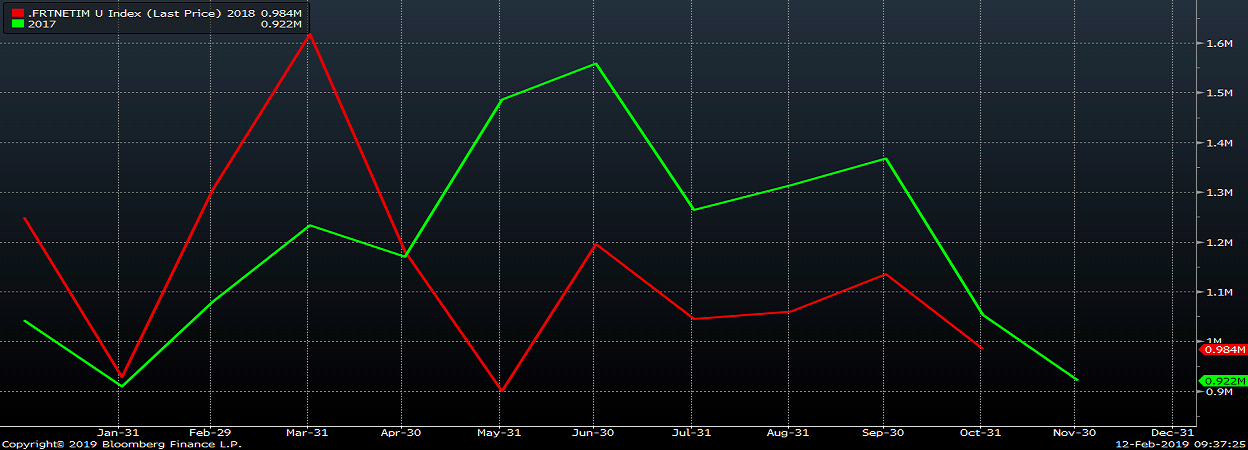
One can argue the effect of the tariffs reduced net imports by roughly 900k tons in 2018 and caused extreme volatility in flat rolled prices. The extreme volatility has had a negative effect on domestic manufacturing, resulted in product substitution and credit issues, especially for many smaller OEMs. This occurred in concert with a slowdown in European and Asian manufacturing. Whether that was the result of the trade war and tariffs or exclusive to their own economies and business cycle is a question that cannot be answered at this time and is frankly irrelevant. The bottom line is demand has slowed globally and may continue to weaken further.
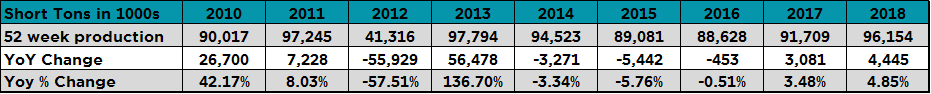
In 2018, 4 million tons of additional/potential flat rolled domestic production capacity came on line (2.5m Granite City, 1.5 JSW). Three weeks ago, 2018 AISI production was analyzed showing annual steel production increased over 4.4m tons or 4.9% YoY.
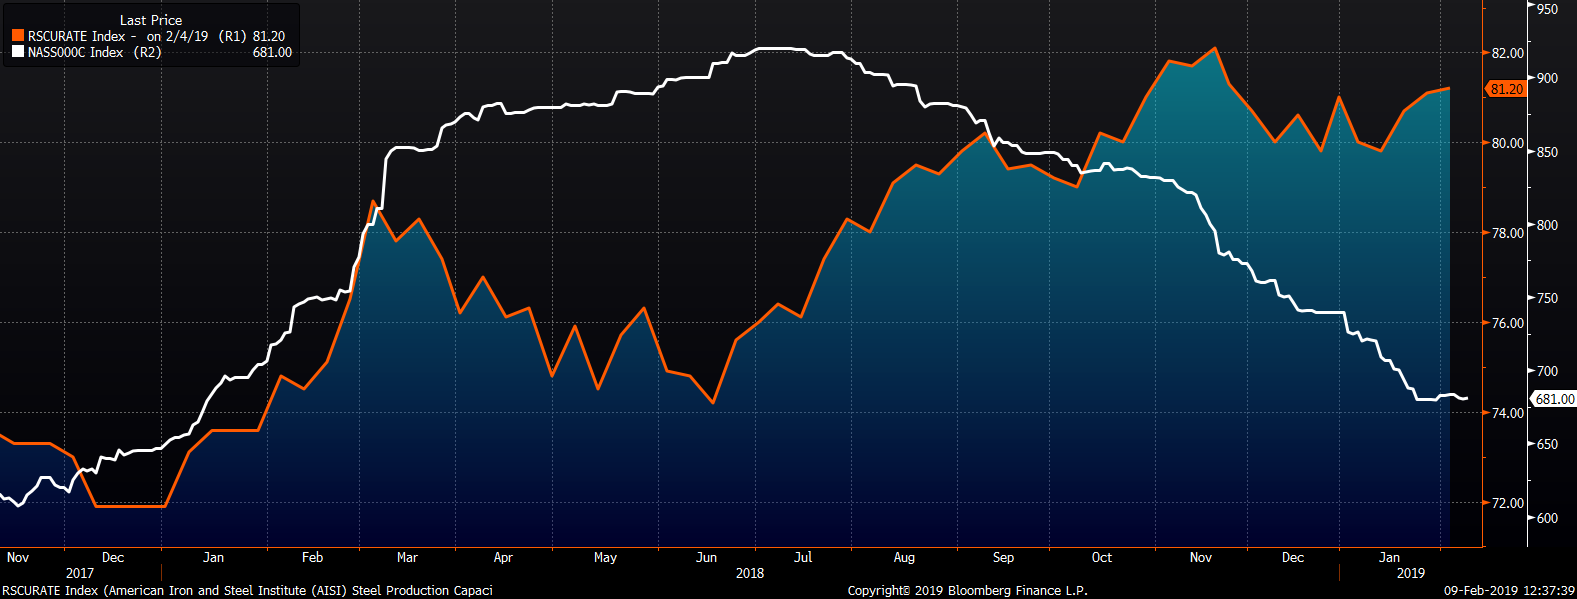
The AISI puts out weekly raw steel production. This chart shows a trailing 52-week sum. This chart is another way to look at the same data showing the increase in production now closing in on levels seen in 2014 and early 2015.
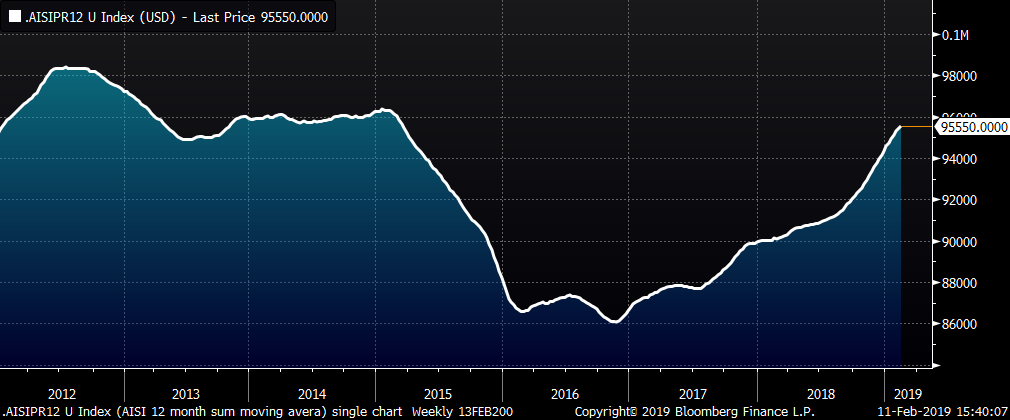
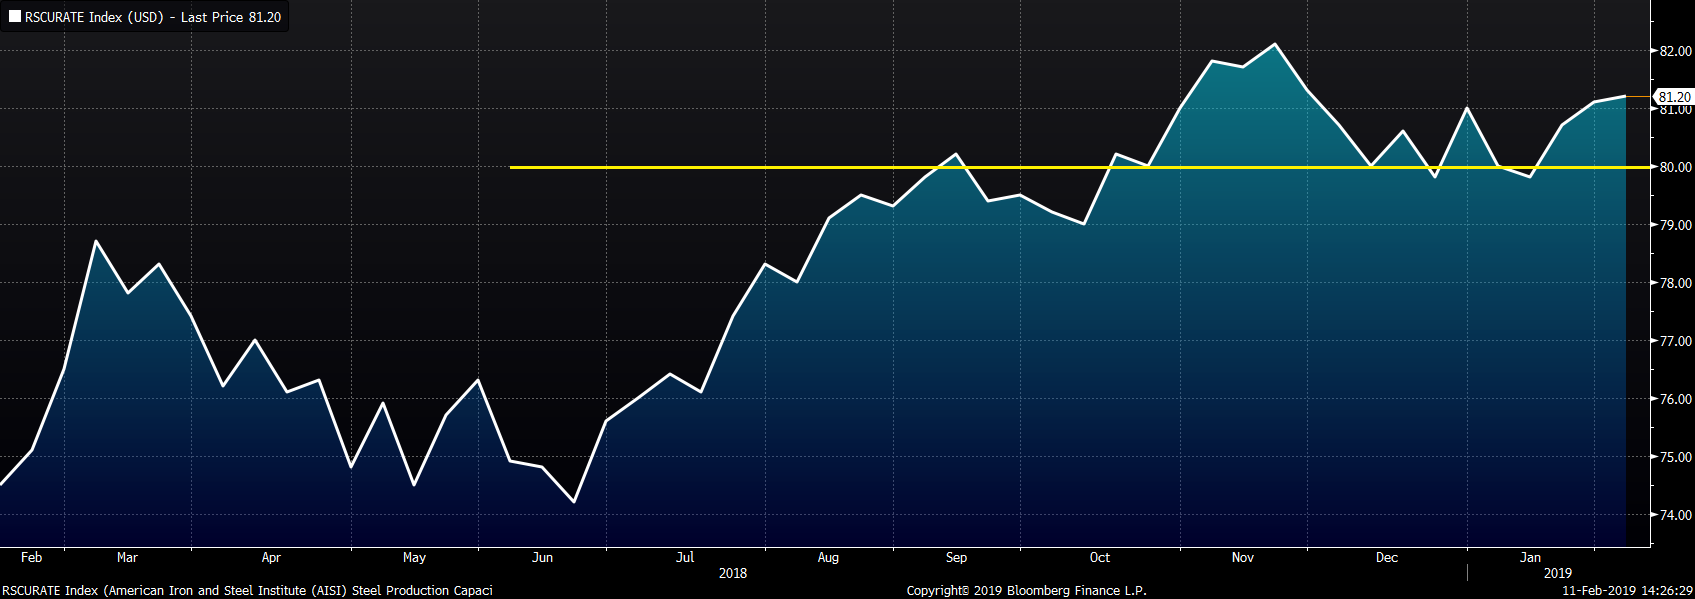
Steel capacity utilization continues to stay well above 80%.
Last week, we examined the balance sheet inventory build in these four steel mills based on their Q4 earnings released over the past few weeks.
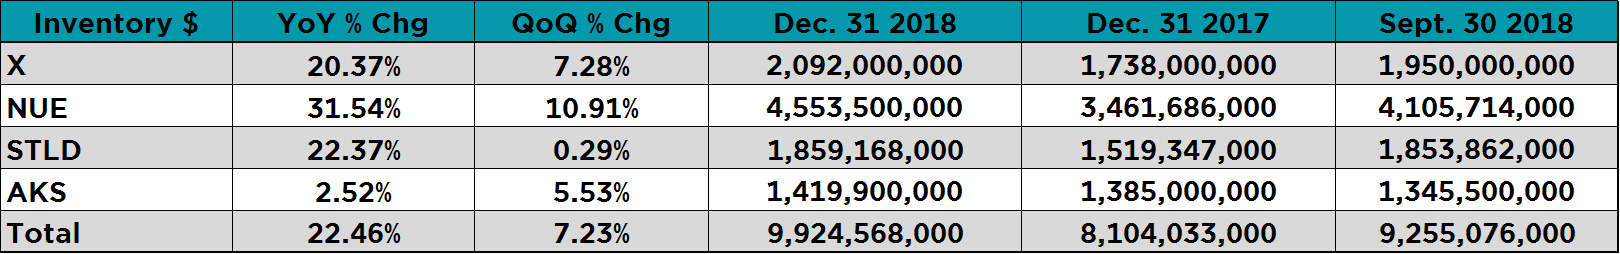
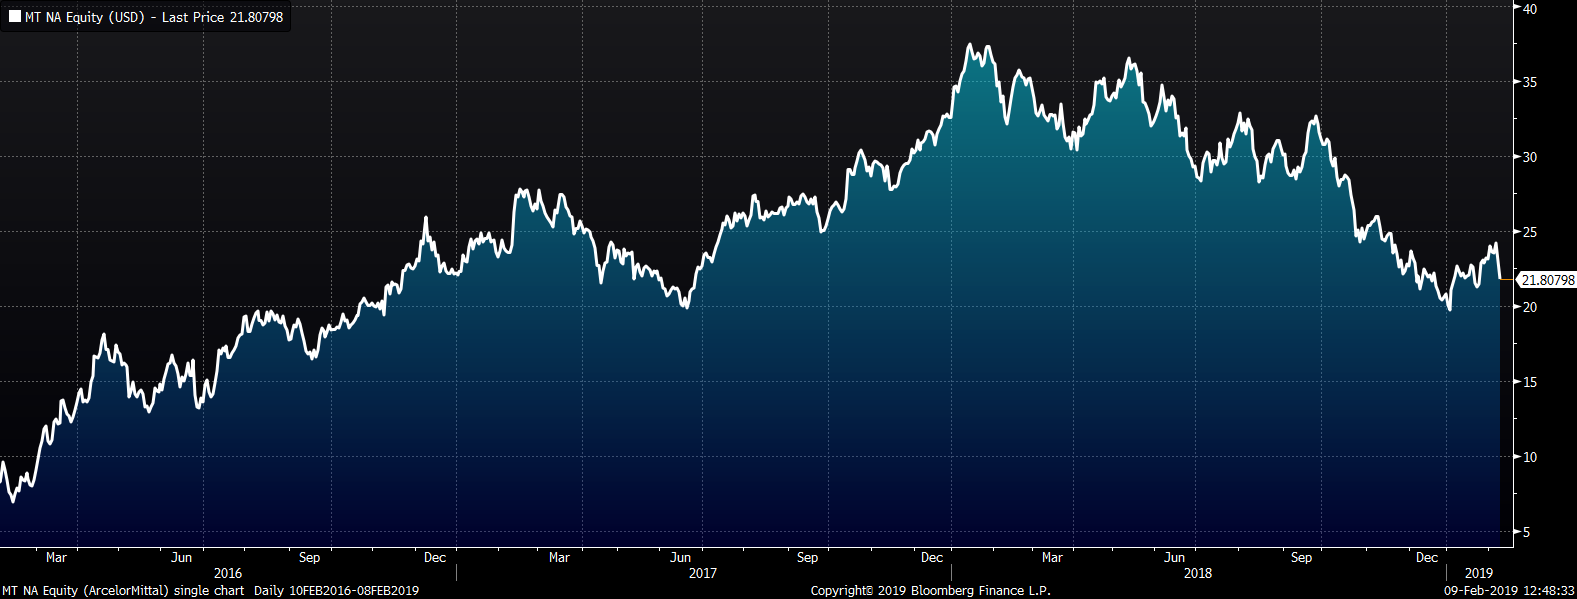
ArcelorMittal announced their earnings last week showing YoY and QoQ growth in their inventory levels in dollar terms and this is for their global business, not just U.S. based mills.
This increase looks to be a negative for higher prices, but it is far from clear what it means. First, what is the mix of this inventory between raw materials, semi-finished and finished goods? Second, of the finished goods, how much is flat rolled? Last, how much of the increase is due to higher prices in the mix. When asked during the conference call, ArcelorMittal CFO Aditya Mittal said:
In terms of excessive inventory, I would say that we talked about $1 billion reversal of 2019. That’s the overspend in 2018. A majority of that is inventory and there’s a small bit, which has to do with more efficient receivable collection. Out of that majority, half is stuck in raw materials and the other half is in finished goods.
So, lets revisit the question is there too much steel.
We know there is decreased demand and increased supply.
The evidence argues yes there unequivocally too much steel.
The third question is will there be a reversal of the steel tariffs? Last week, both the House and the Senate on a bipartisan basis introduced the Bicameral Congressional Trade Authority Act of 2019, which if passed, would remove trade authority under Section 232 from the President and put it back in the hands of congress. If passed, it will result in the removal of the 25% tariff on steel. This is not only a major downside risk to domestic steel prices, but also the risk in and of itself is likely a deterrent to boost apparent demand, especially in the face of recent price increases.
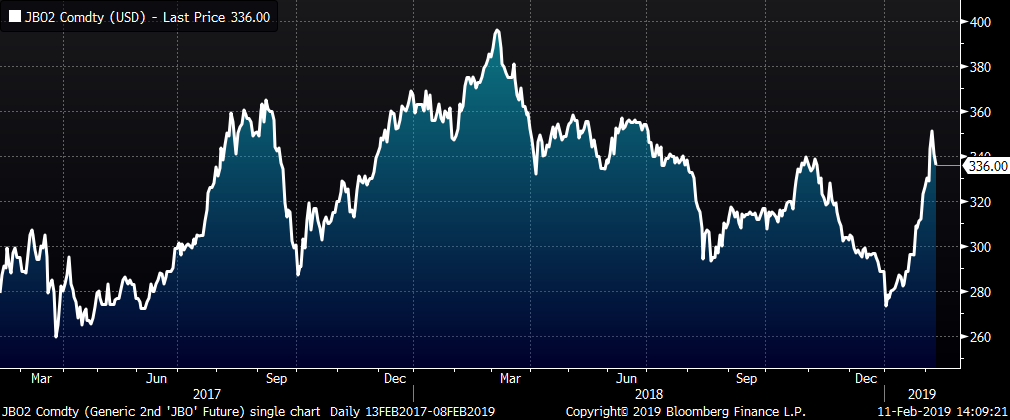
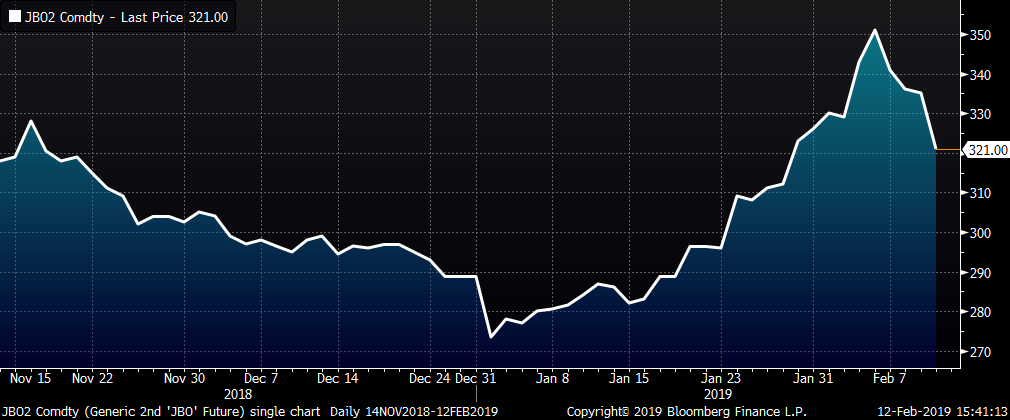
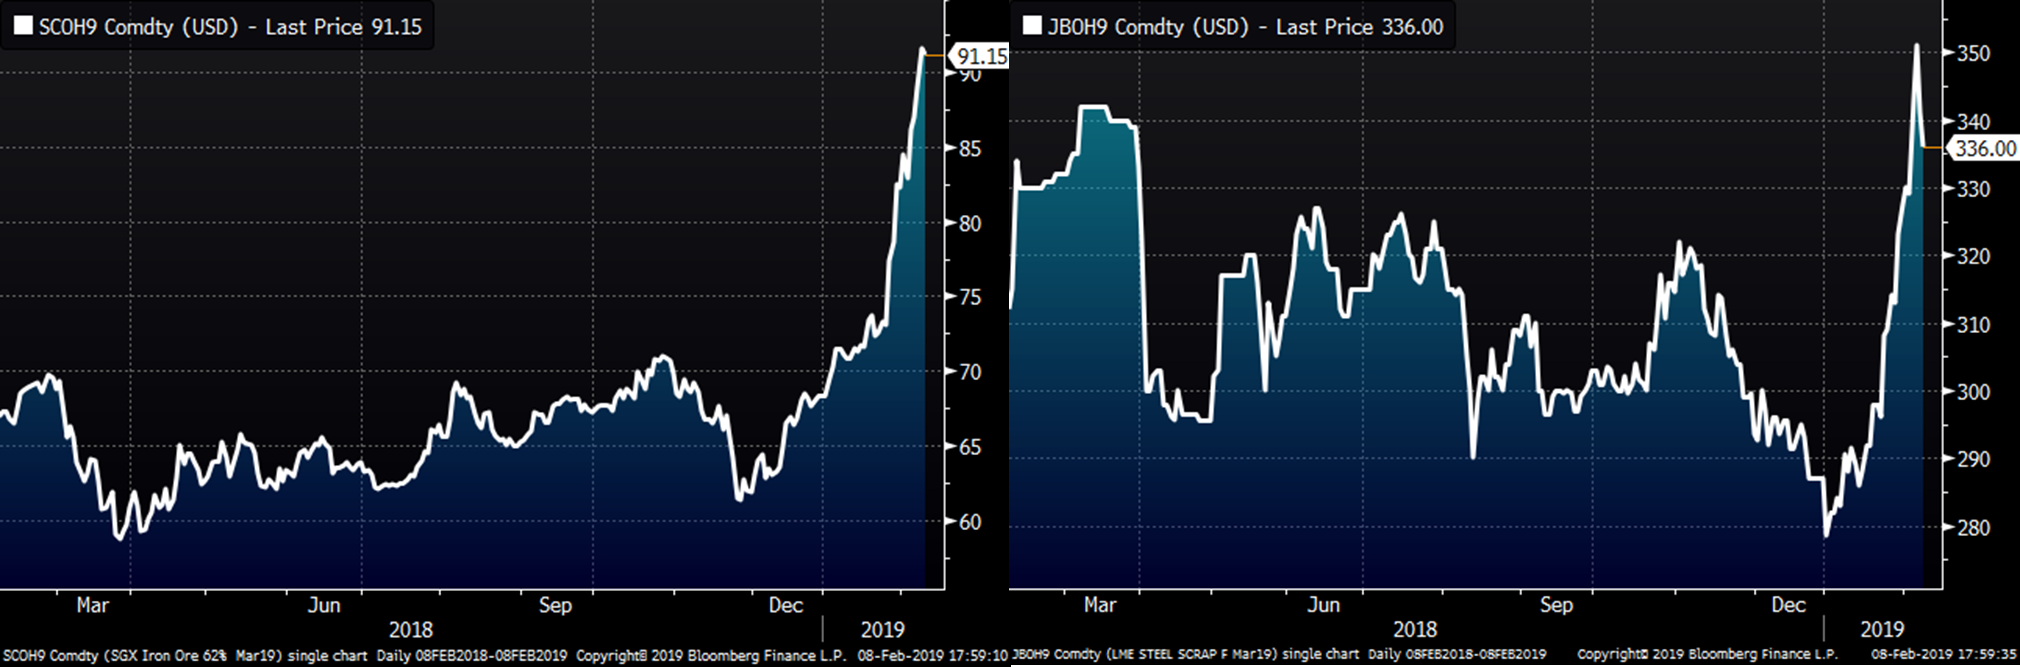
The rally in iron ore continued last week with the March SGX futures closing the week on highs at $88.88/t trading as high as $93.50.
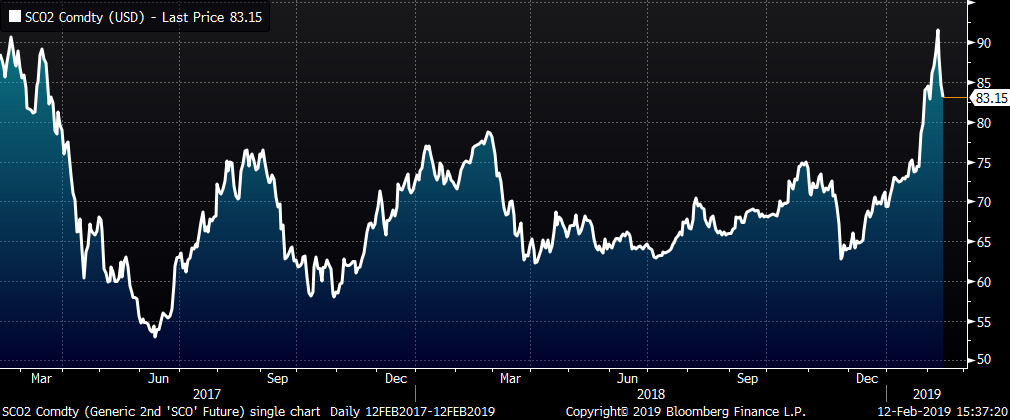
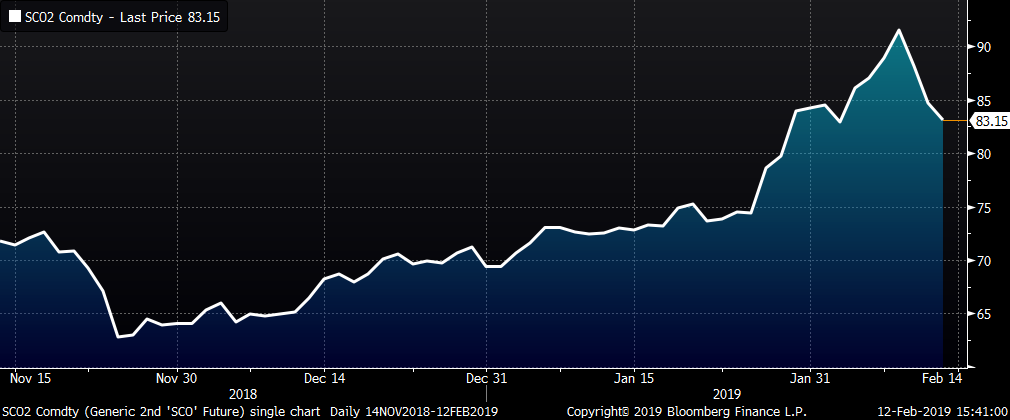
The rally in iron ore carried the Turkish scrap futures higher. The March LME Turkish Scrap future added another $6 on the week closing at $336, but settled as high as $351 during the week.
However, as of publication of this report, iron ore and scrap have sold off significantly since the Chinese markets reopened following the Chinese Lunar New Year.
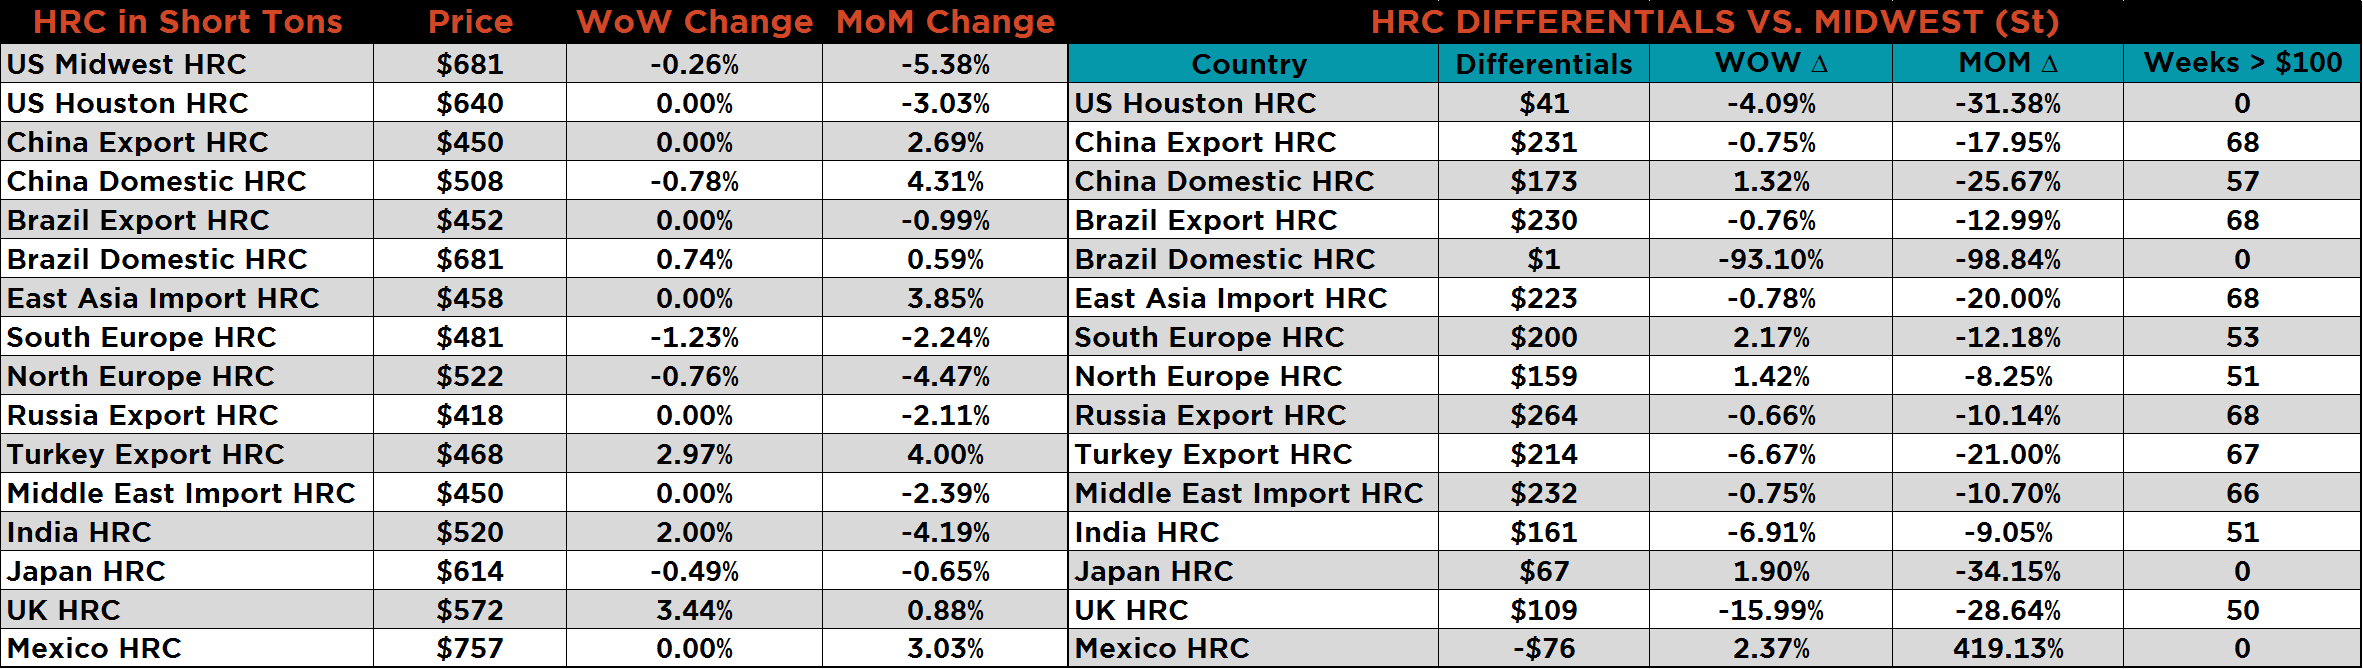
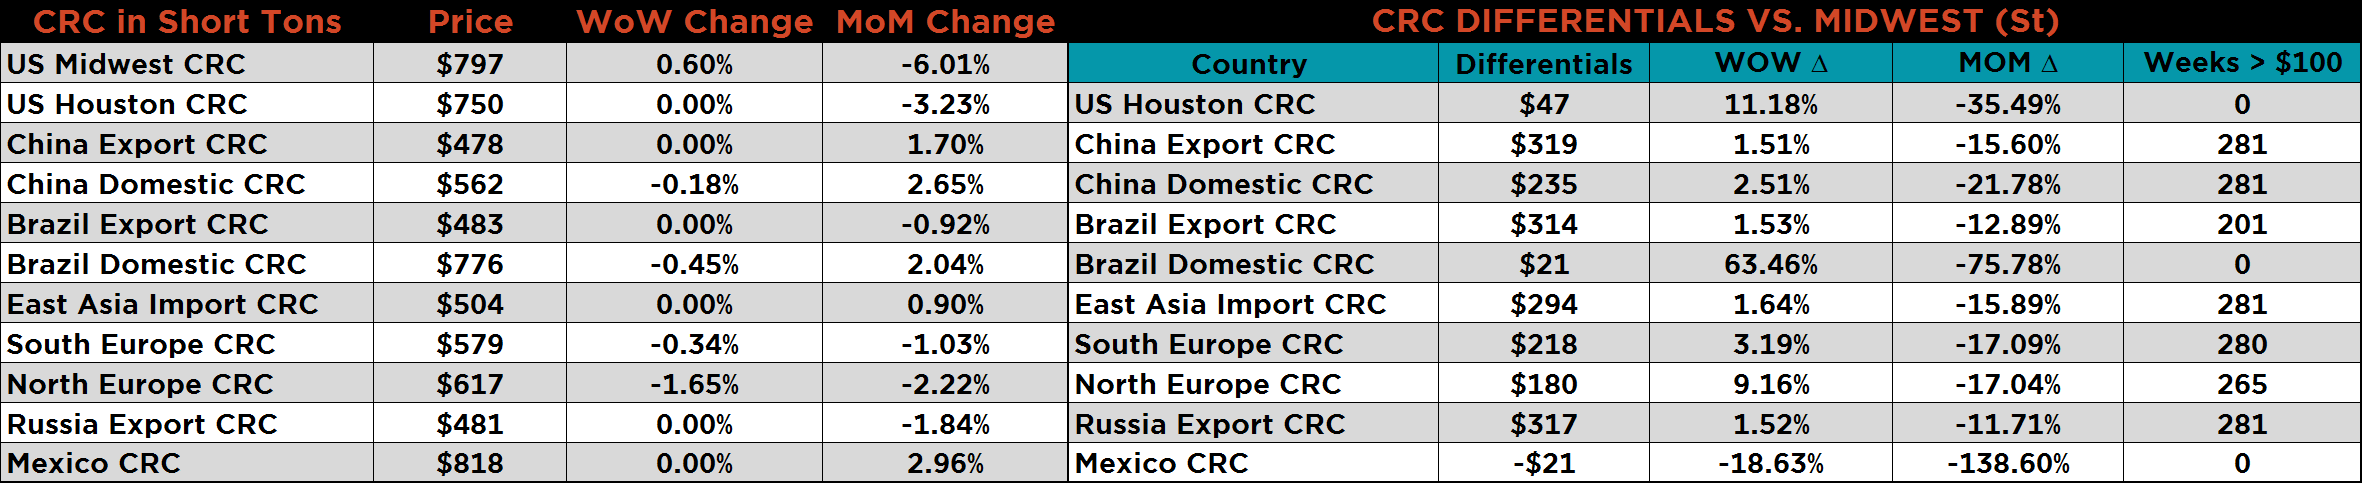
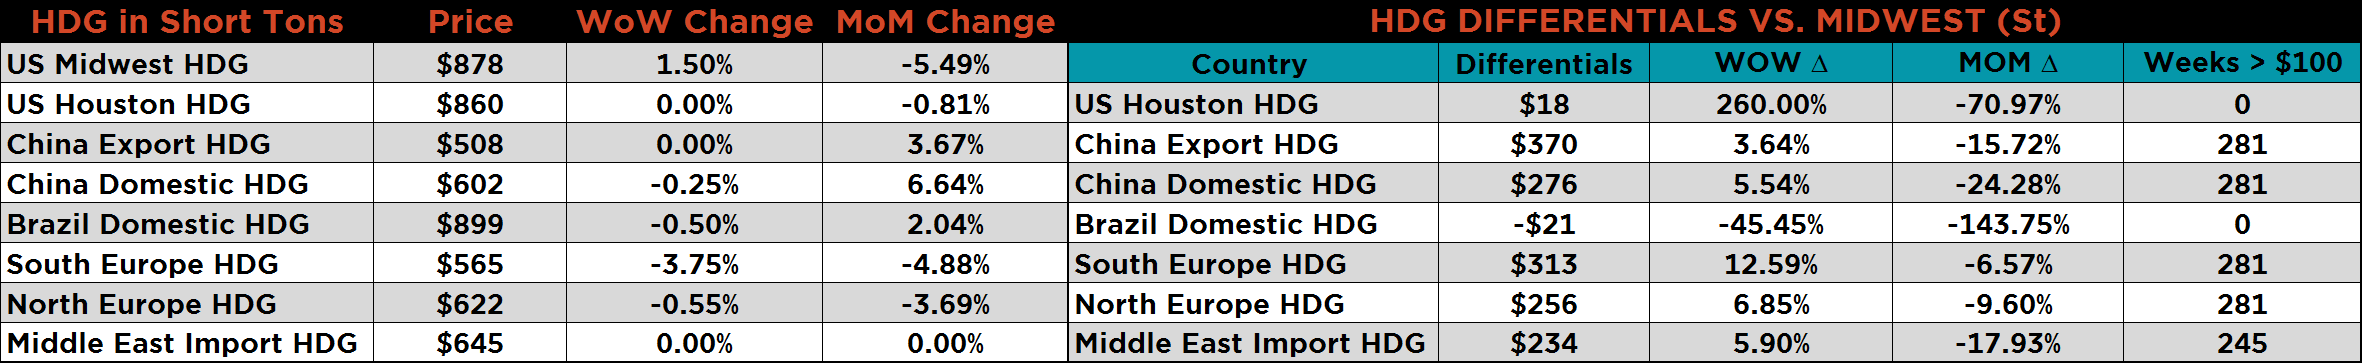
Higher global finished steel and raw materials have compressed import differentials toward the levels seen prior to rallies (differentials below are unadjusted pre-tariff). At current prices, tariff adjusted imports are unattractive. Imports should fall in the coming months tightening supply in the U.S. However, whether or not this tightening is enough to overcome increased production capacity remains to be seen. Also, if tariffs are removed, imports become attractive again.

The following issues provide the foundation of our view:
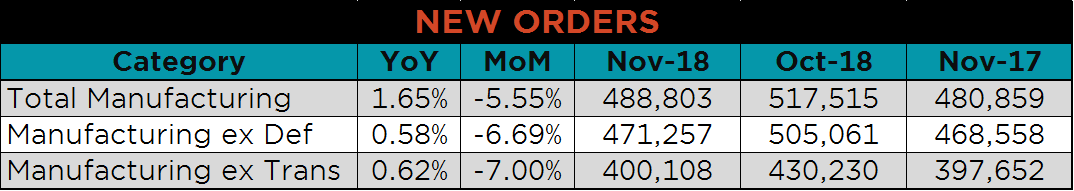
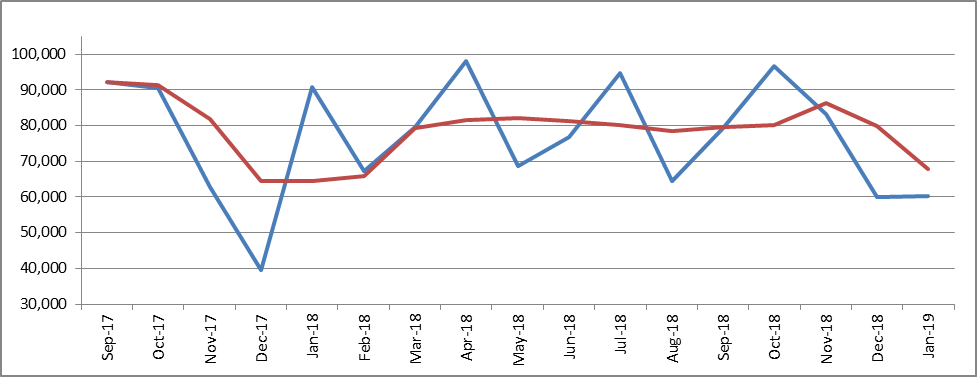
After being delayed due to the government shutdown, the November U.S. Durable Goods Report was finally released. New orders for durable goods and capital goods missed expectations. Seasonally adjusted new orders for durable goods ex-transportation fell 0.4% MoM, missing expectations of no change. The table below shows unadjusted YoY and MoM new orders for the top three categories.
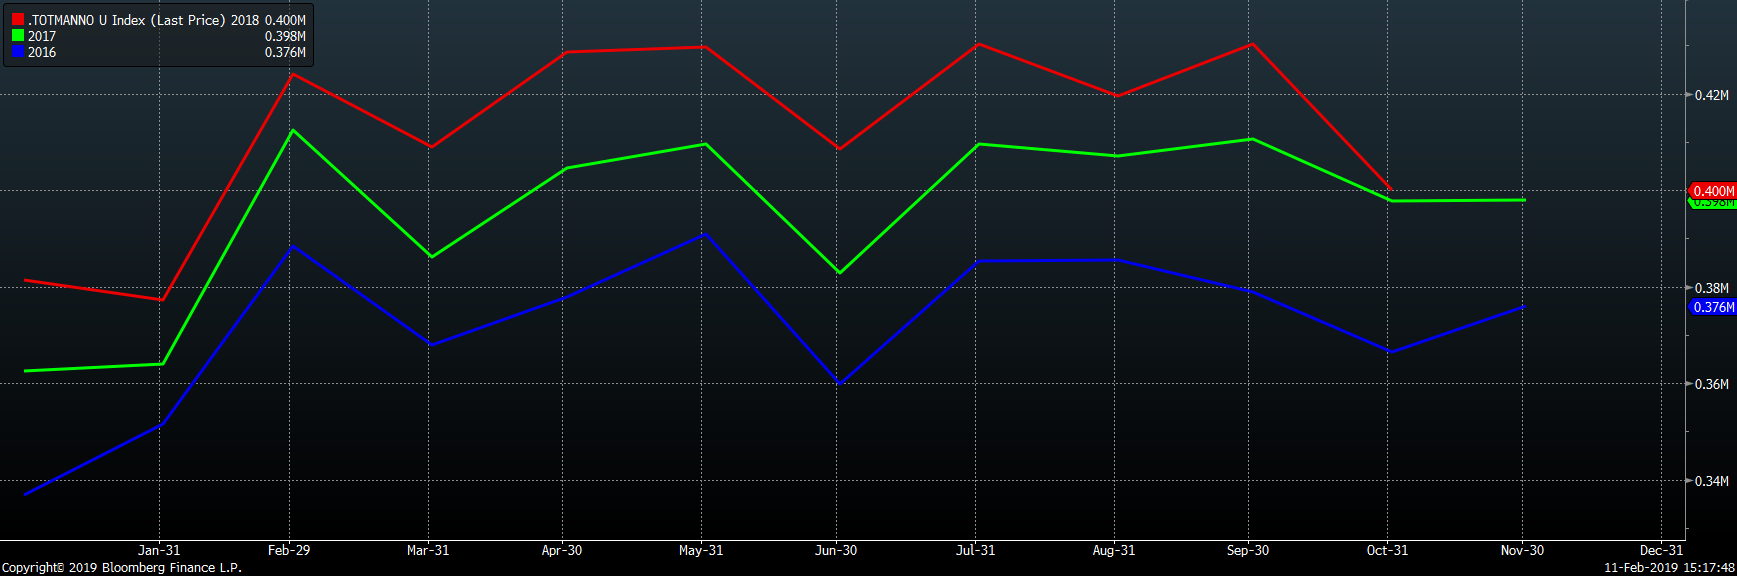
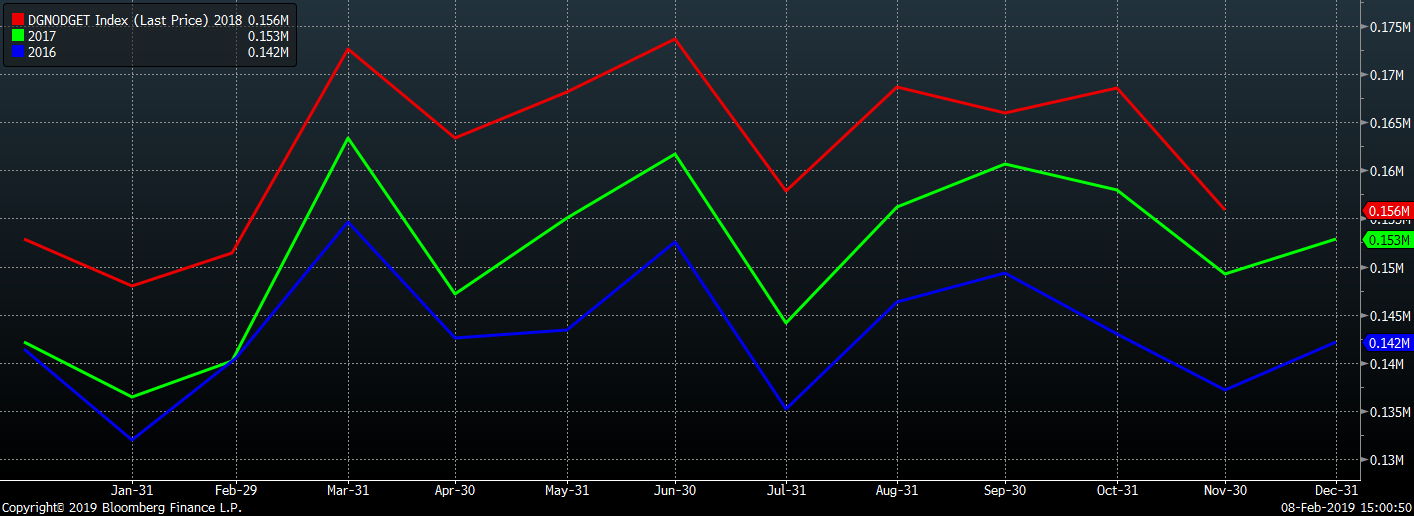
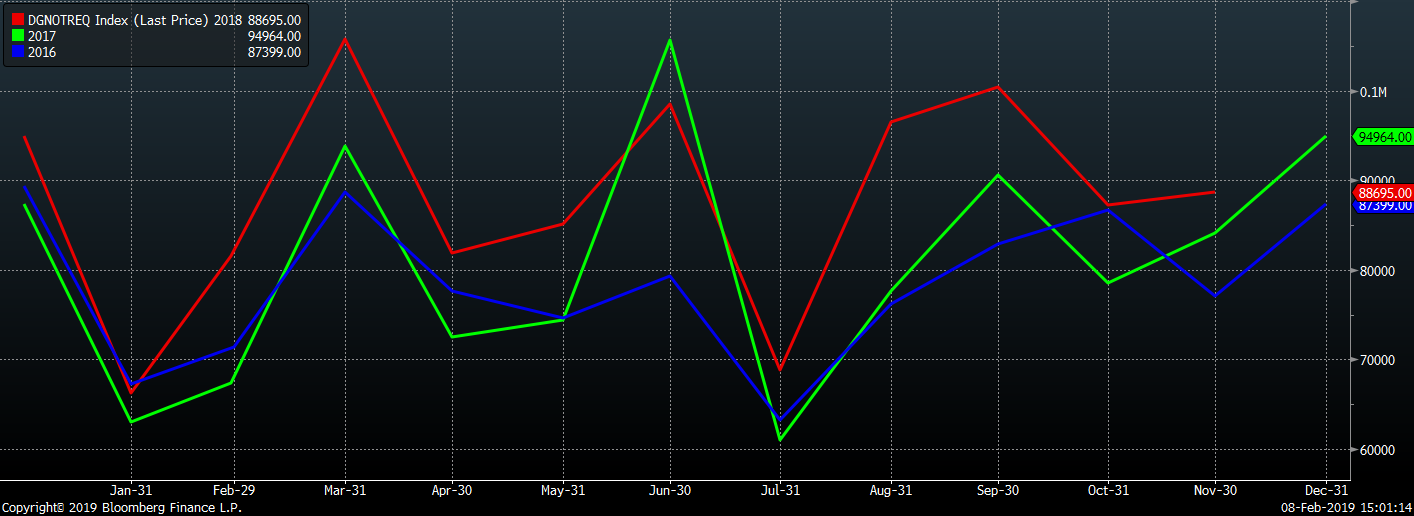
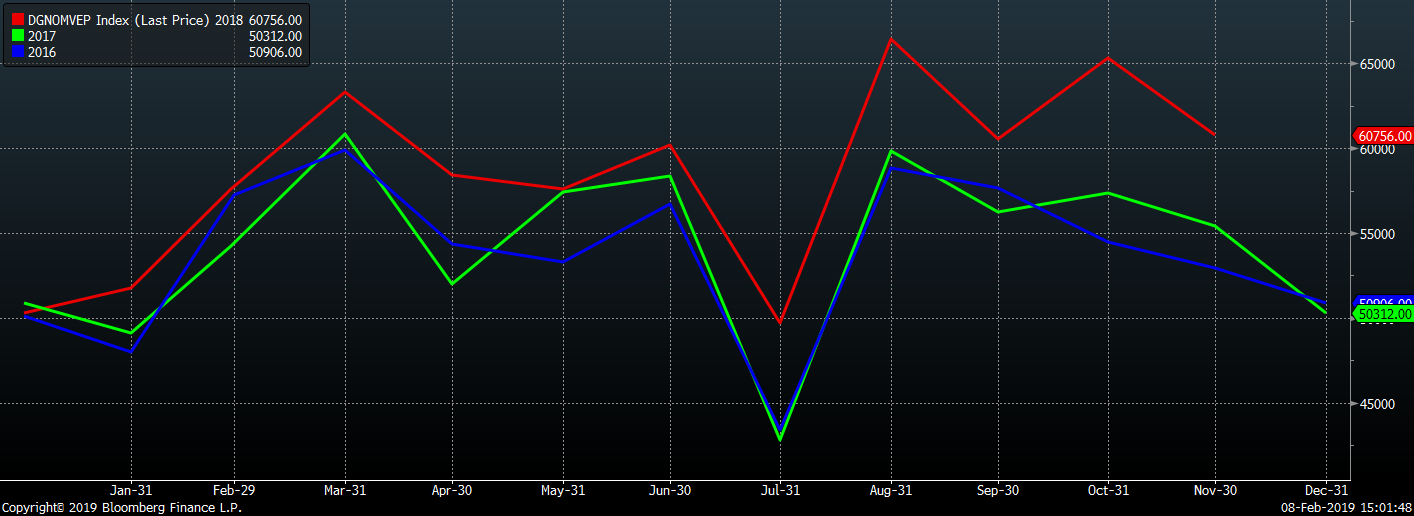
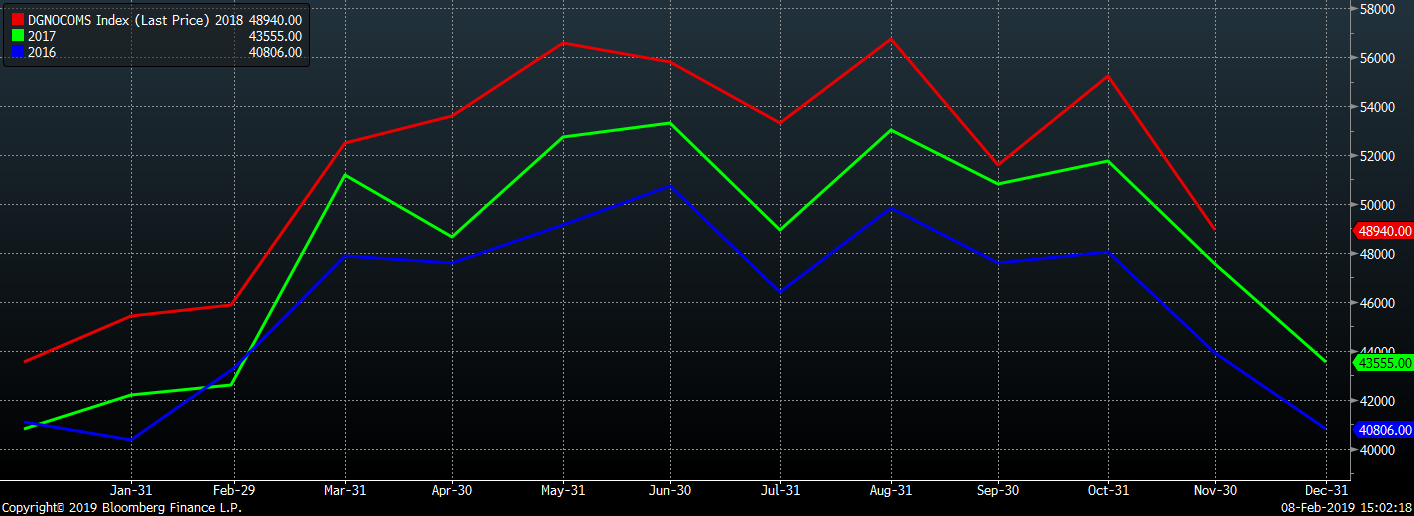
These charts show the YoY percentage change in new orders for each category. These charts show a clearer picture of slowing growth across the manufacturing industry.
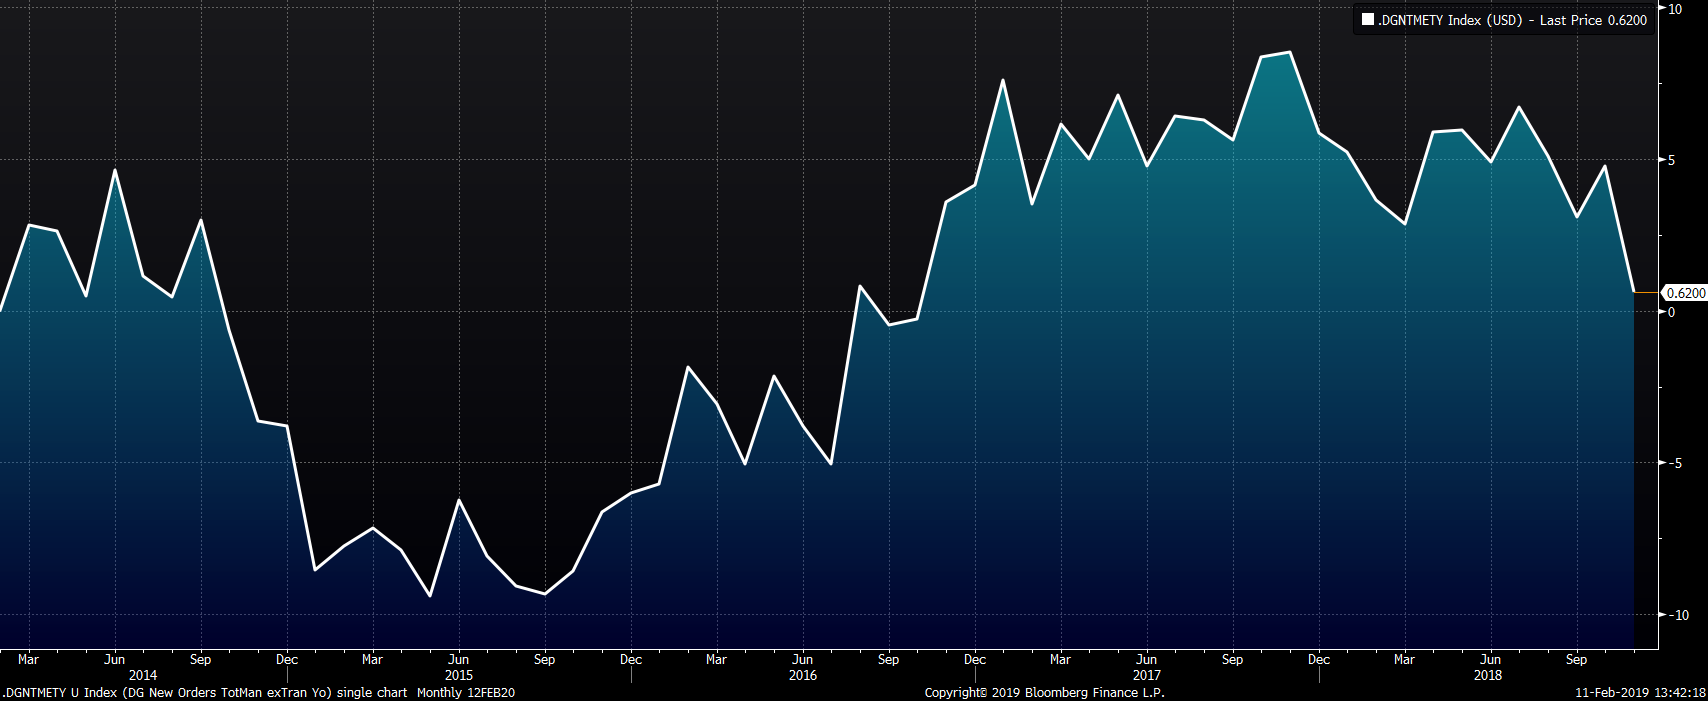
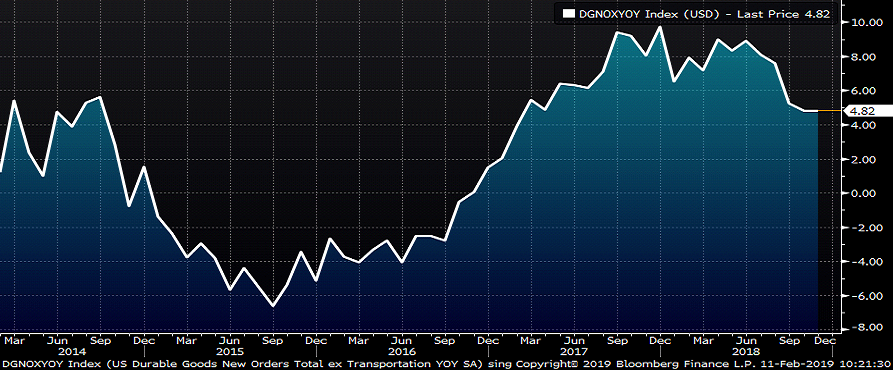
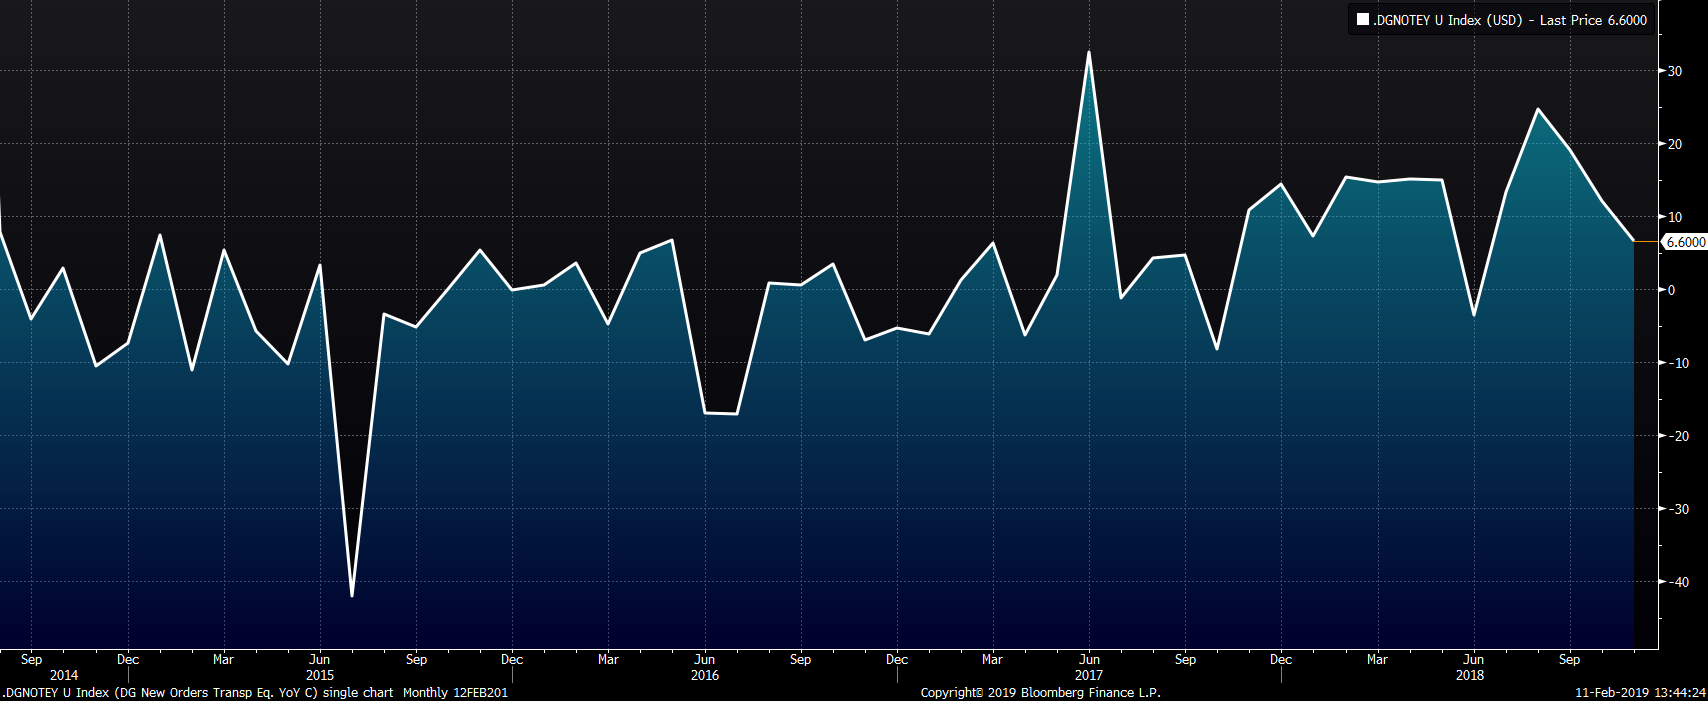
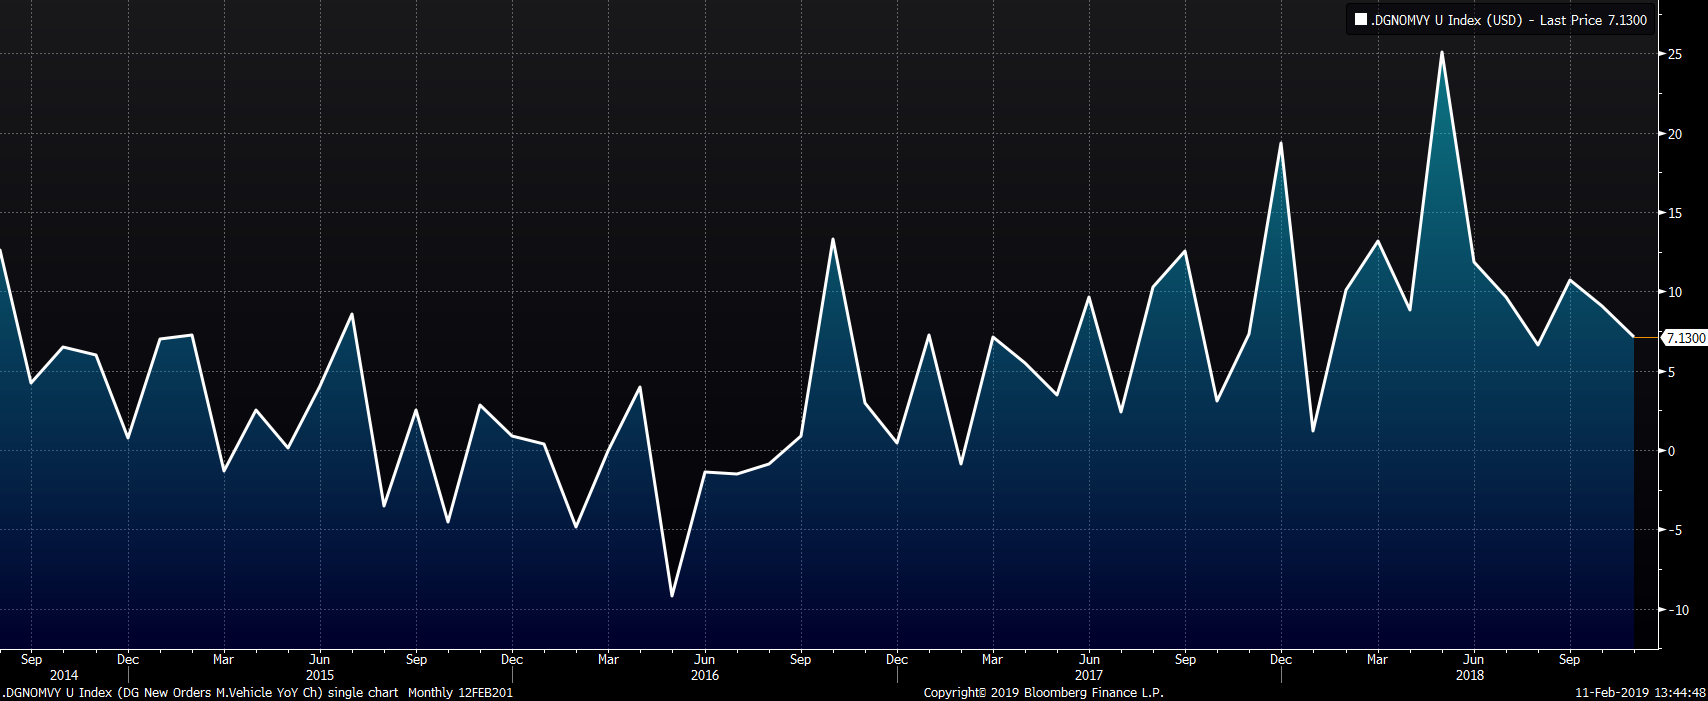
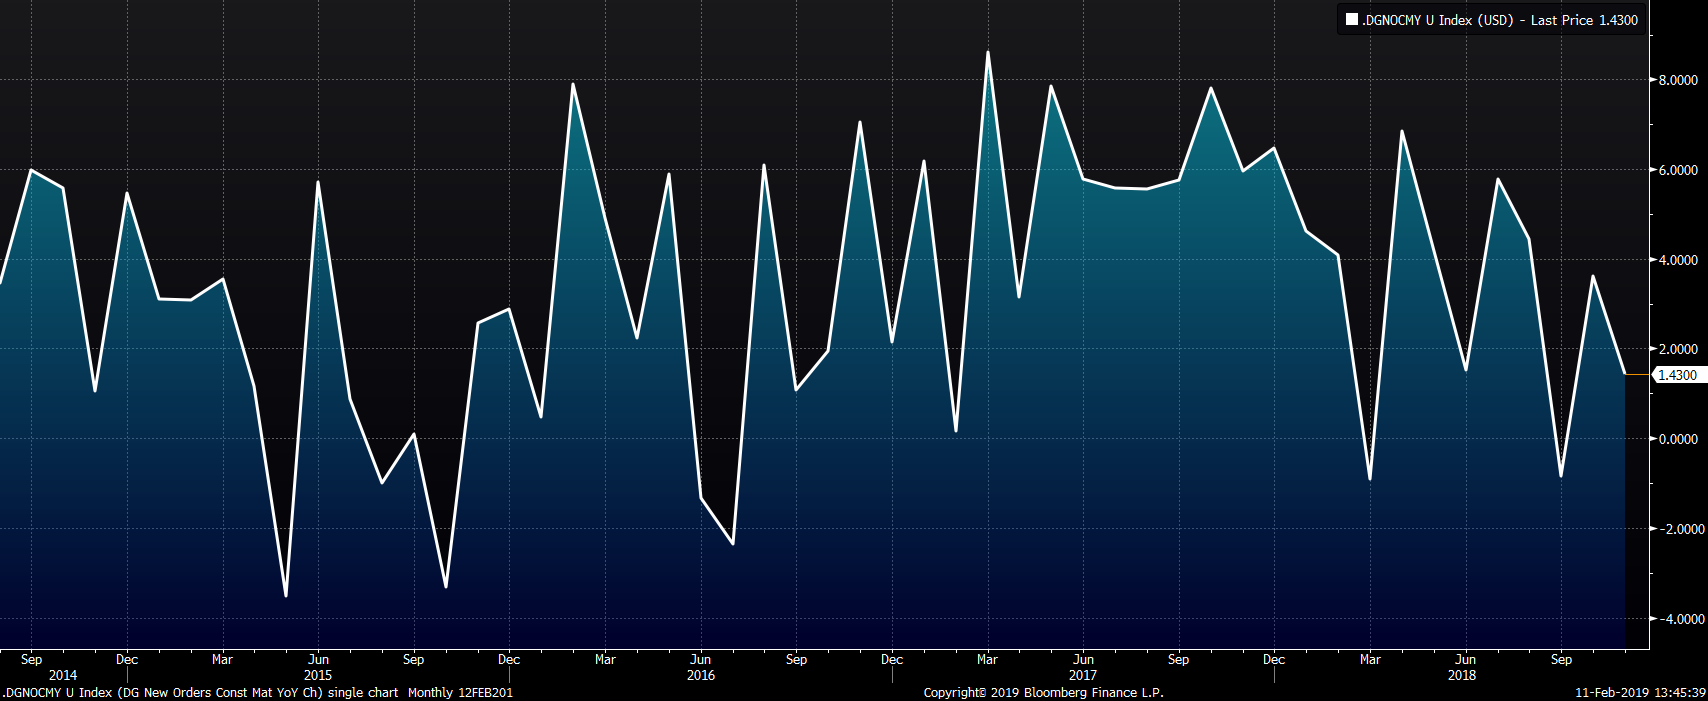
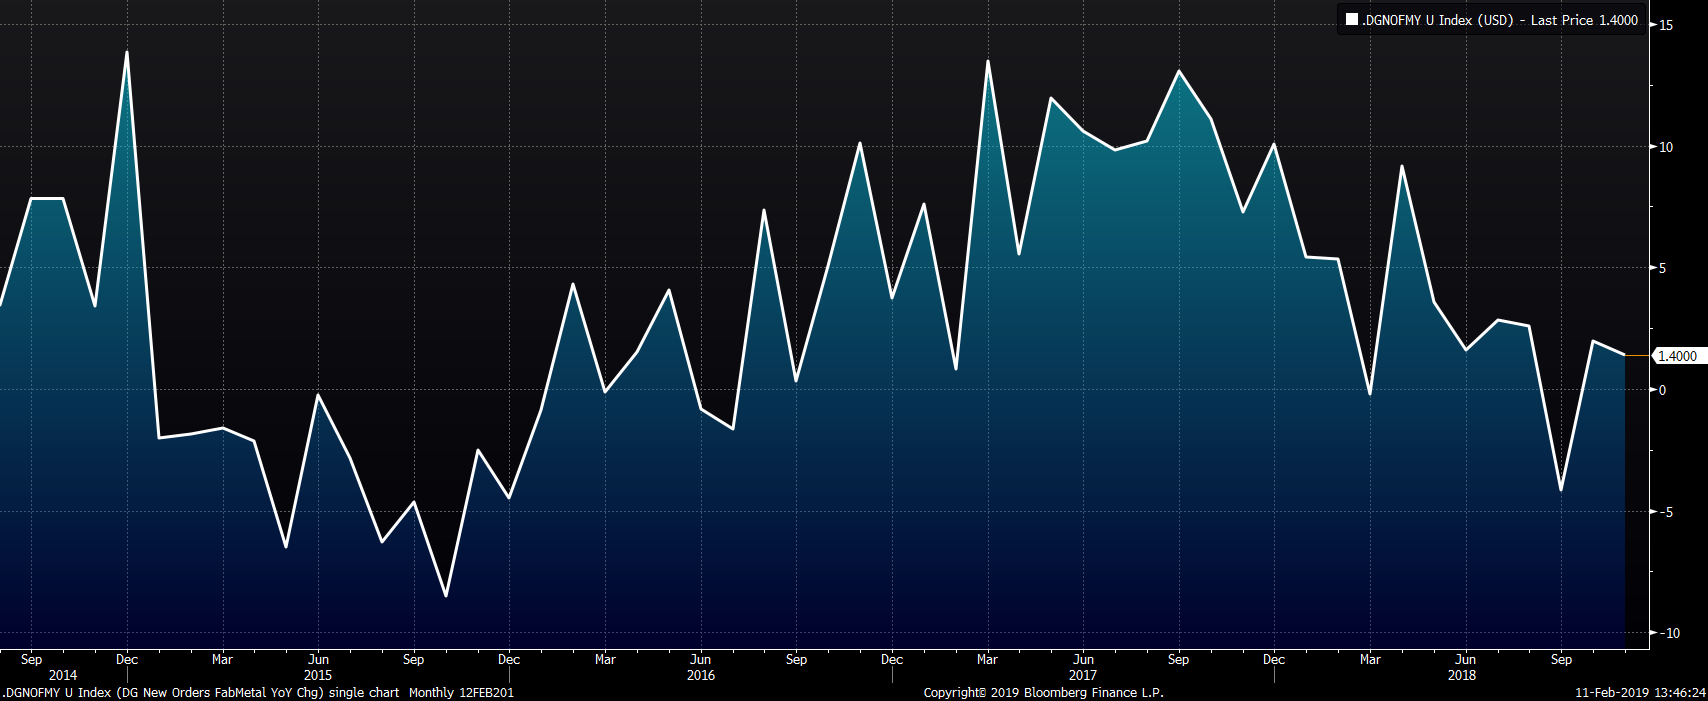
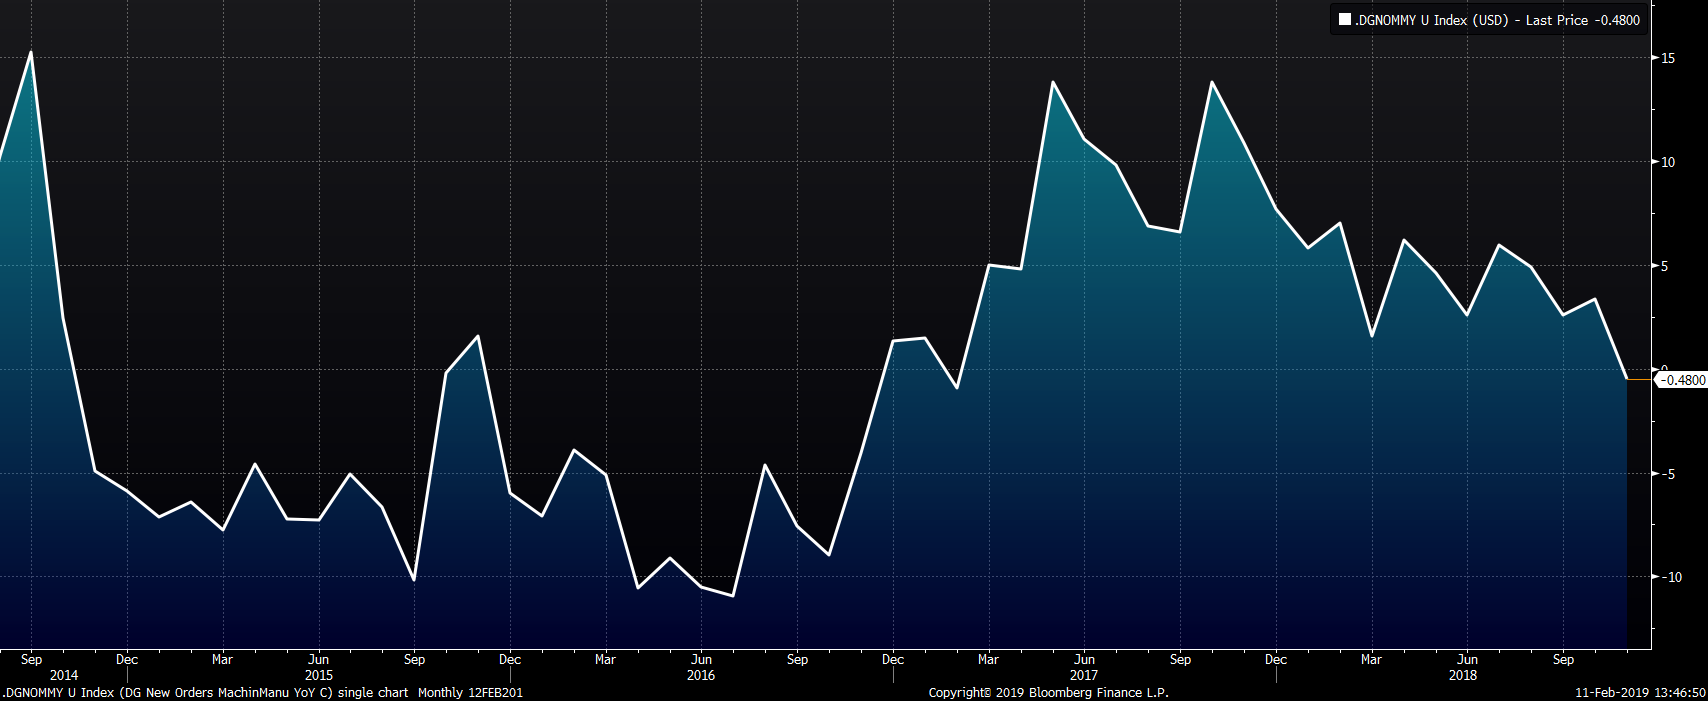
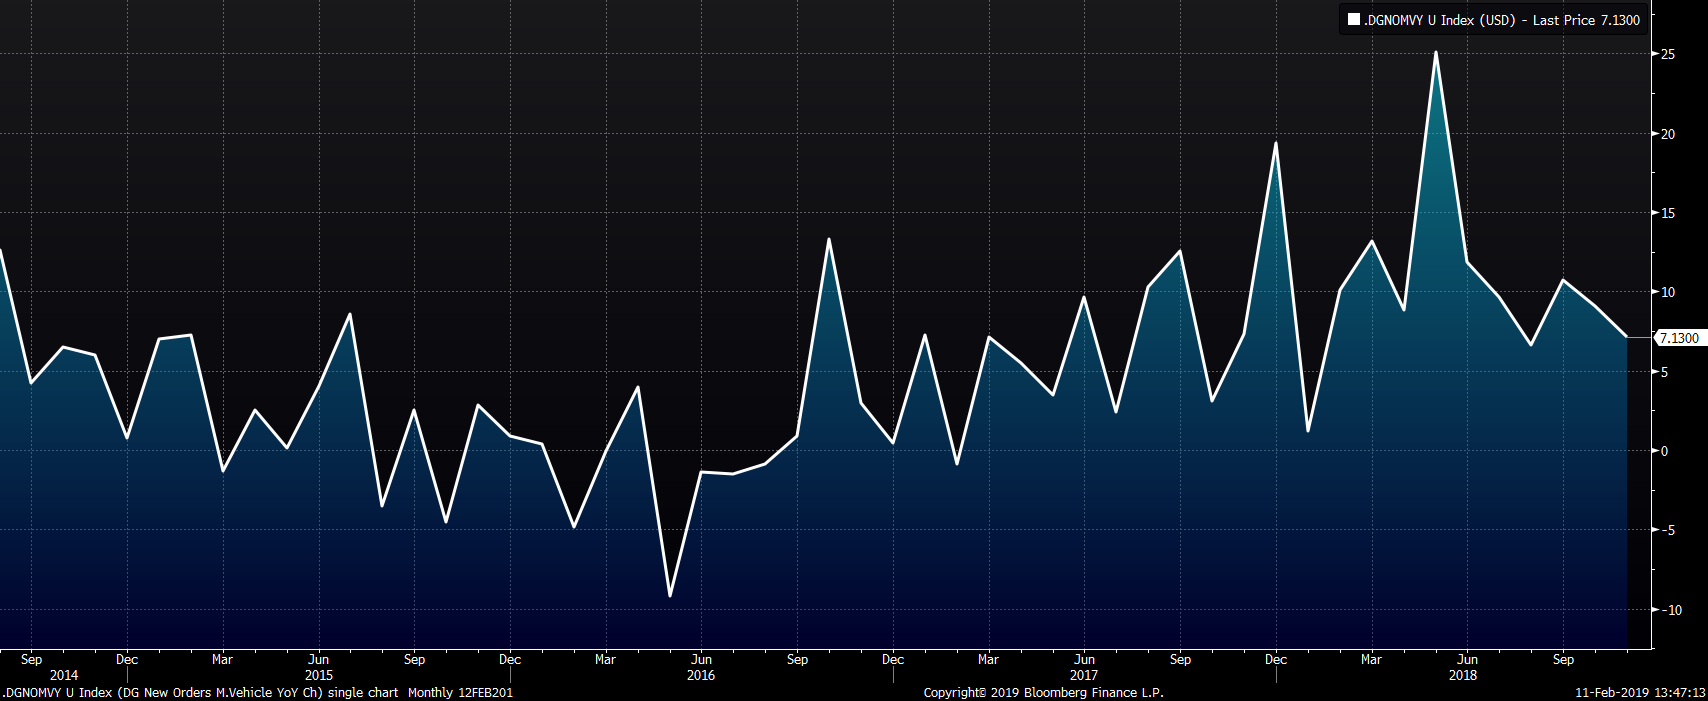
The charts consistently show slower growth, which will lead to decreased shipments if the trend continues. This data is old at this point, but if it is indicative of a downtrend and continued slowing in new orders, the drop in shipments will lead to lower demand.
Upside Risks:
Downside Risks:
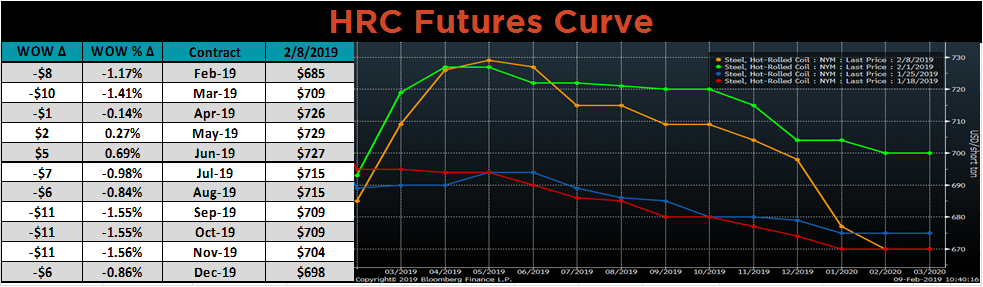
The February CME HRC future fell $8 to $685 while the Platts TSI Daily Midwest HRC Index was down $1.75 to $681.
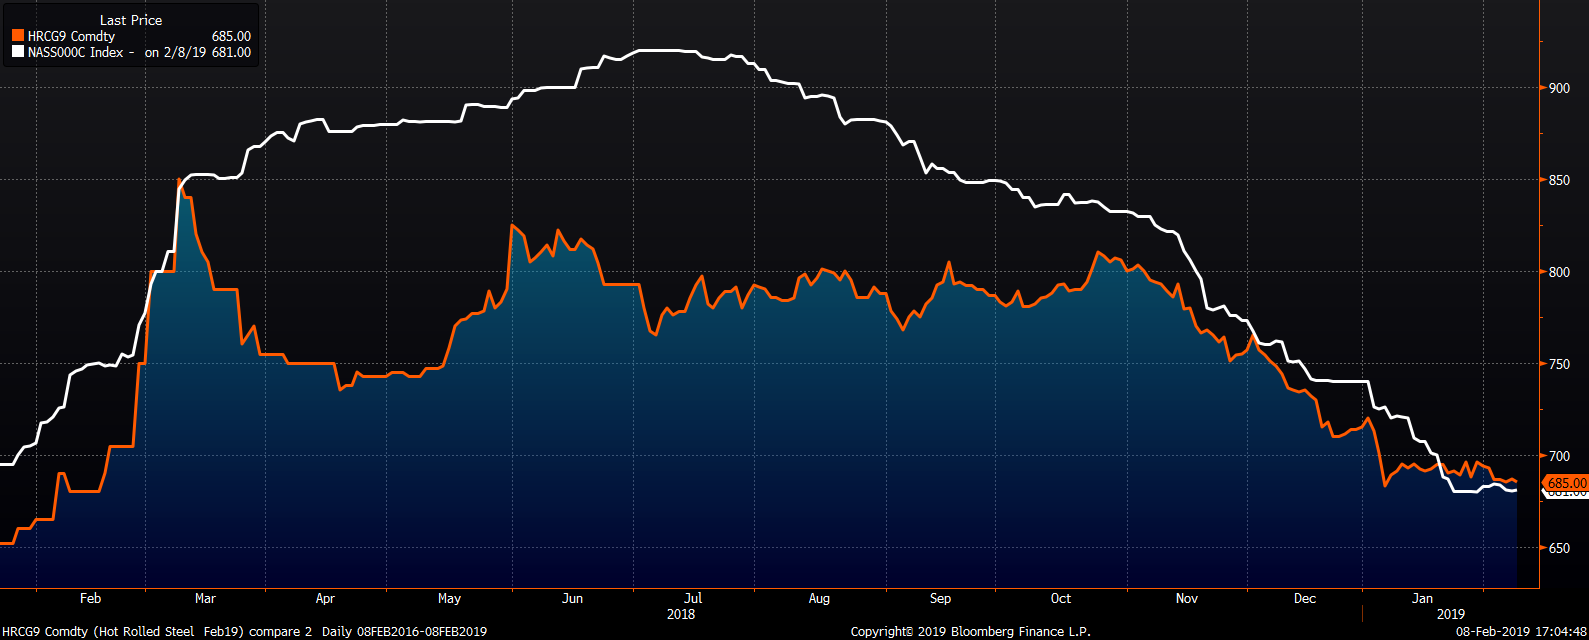
The CME Midwest HRC futures curve shown below with last Friday’s settlements in orange. Except for Q2, the curve fell $6 -$11.
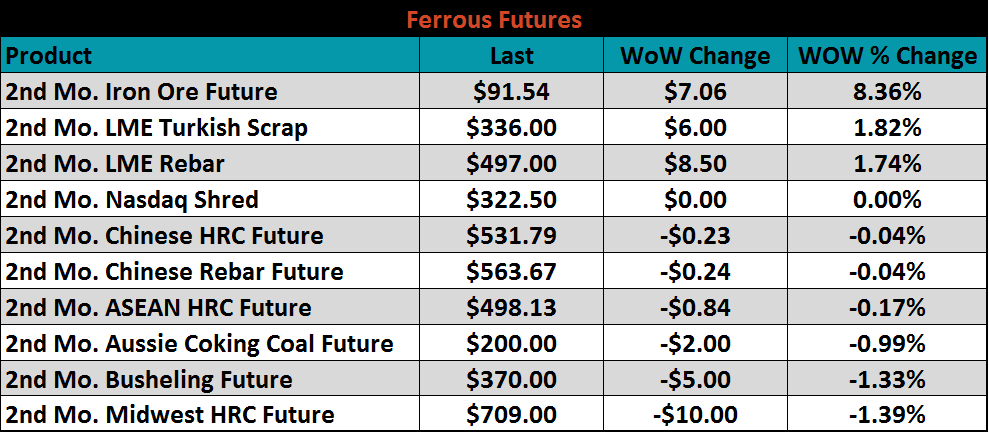
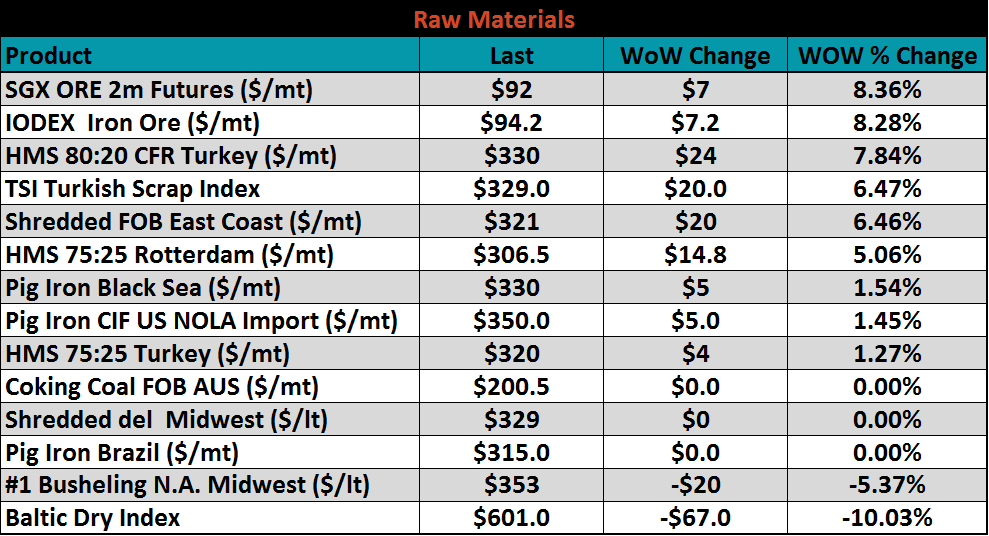
March ferrous futures are listed below. Iron Ore continued to rally on shortage concerns gaining 8.36%.
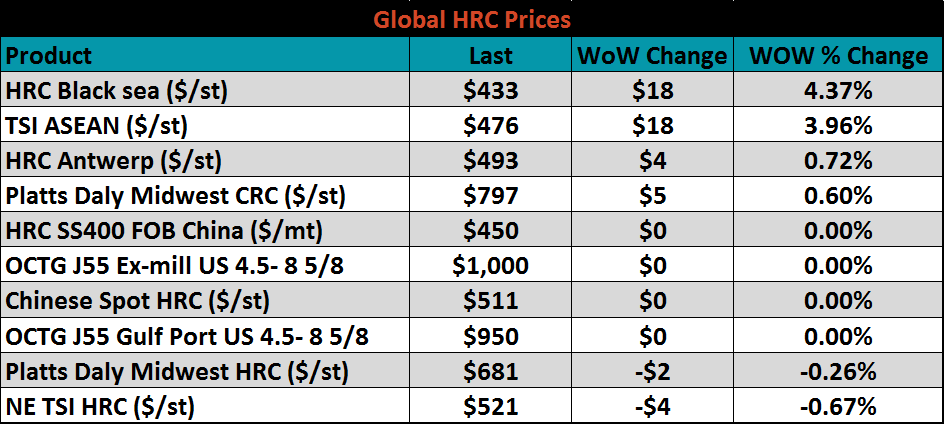
Flat rolled indexes were mixed.
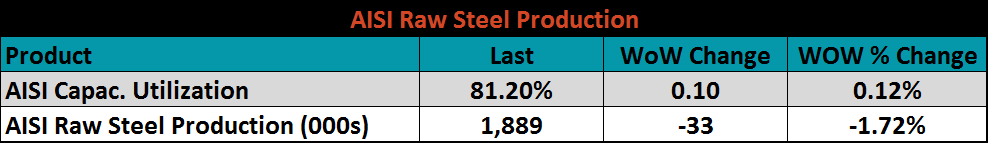
The AISI Capacity Utilization Rate increased to 81.2%.
January flat rolled import licenses are forecast to fall 31k tons MoM to 766k while December flat rolled import licenses are forecast to fall 61k MoM tons to 796k. HR, CR and AZ/AL are participating in the fall, while HDG imports saw a much smaller relative decrease.
January tube import license data is forecasting a massive 257k ton MoM gain mostly due to Korea’s quota being reset.
The combined flat and tube import license forecast is set for a sharp 226k tons increase to 1.51m, while December’s combined flat rolled and tube import license data fell 110k tons.
January AZ/AL import licenses are forecasting little MoM change vs. December at 60k, but December’s licenses look to be down 23k tons vs. November.
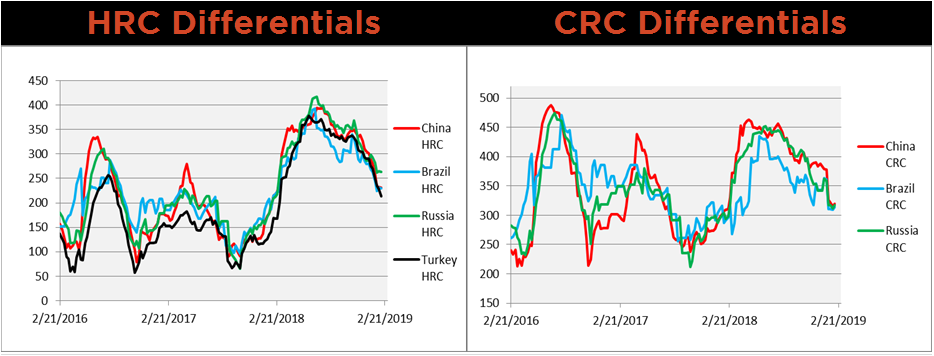
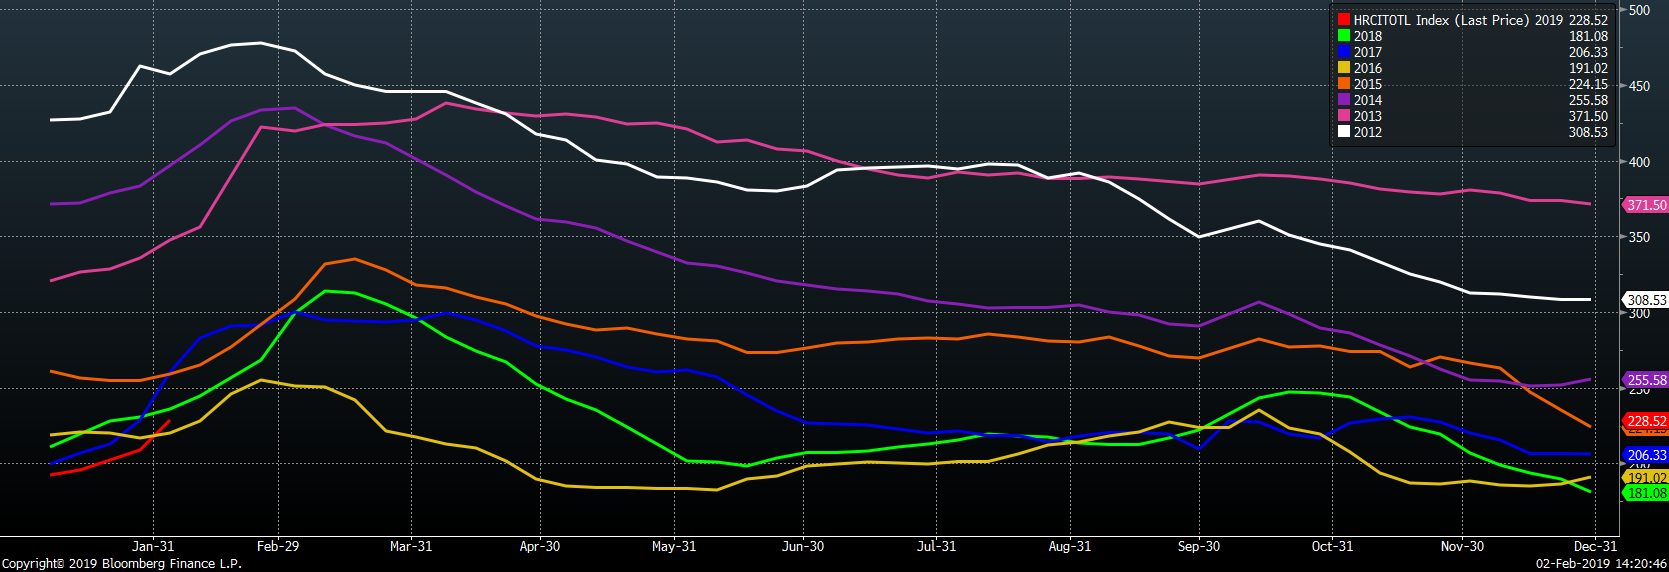
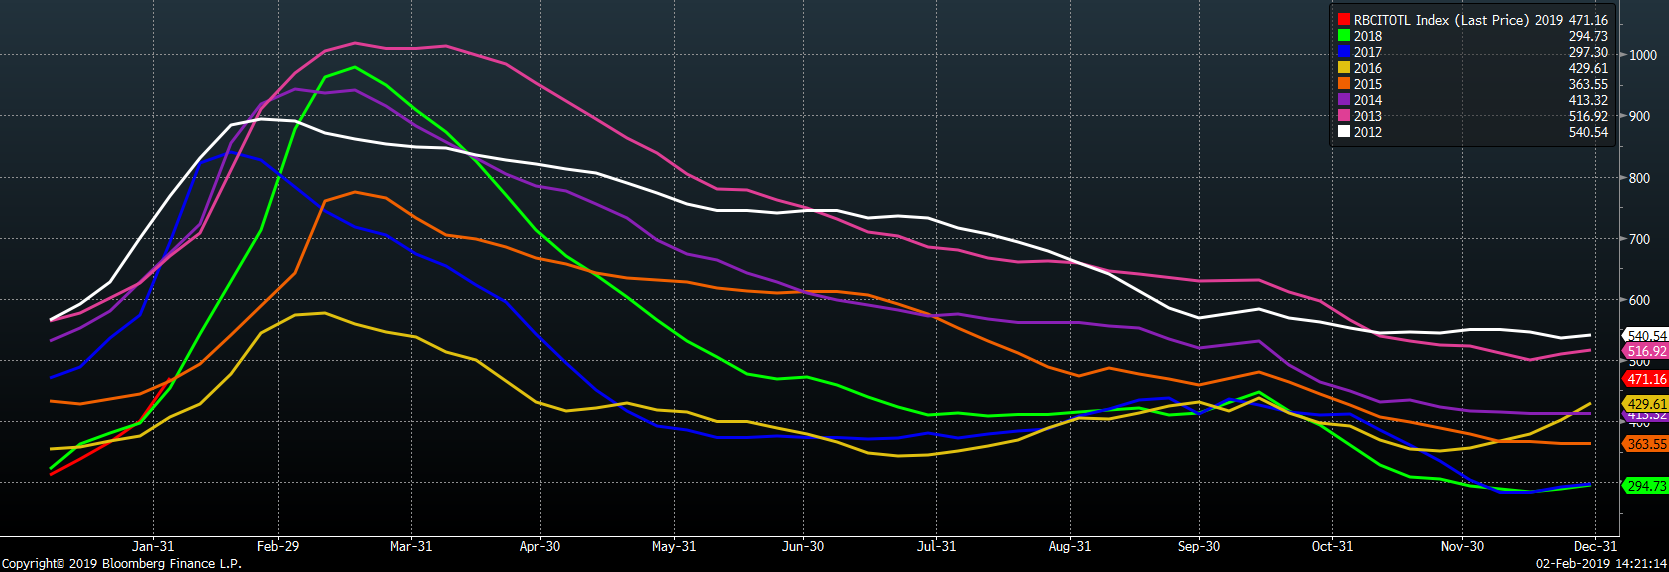
Below are HRC and CRC Midwest vs. each country’s export price differentials using pricing from SBB Platts. HRC and CRC prices remained flat for the most part, with the exception of Turkish HRC, which continued to decline sharply as prices responded to higher scrap. Taking into account tariffs, these differentials indicate imports will slow in Q2 and Q3.
SBB Platt’s HRC, CRC and HDG WoW pricing is below. Midwest prices saw little change. The UK and Turkish export HRC prices rose 3.4% and 3%, respectively. Northern European CRC prices fell 1.8% while South European HDG prices fell 3.8%.
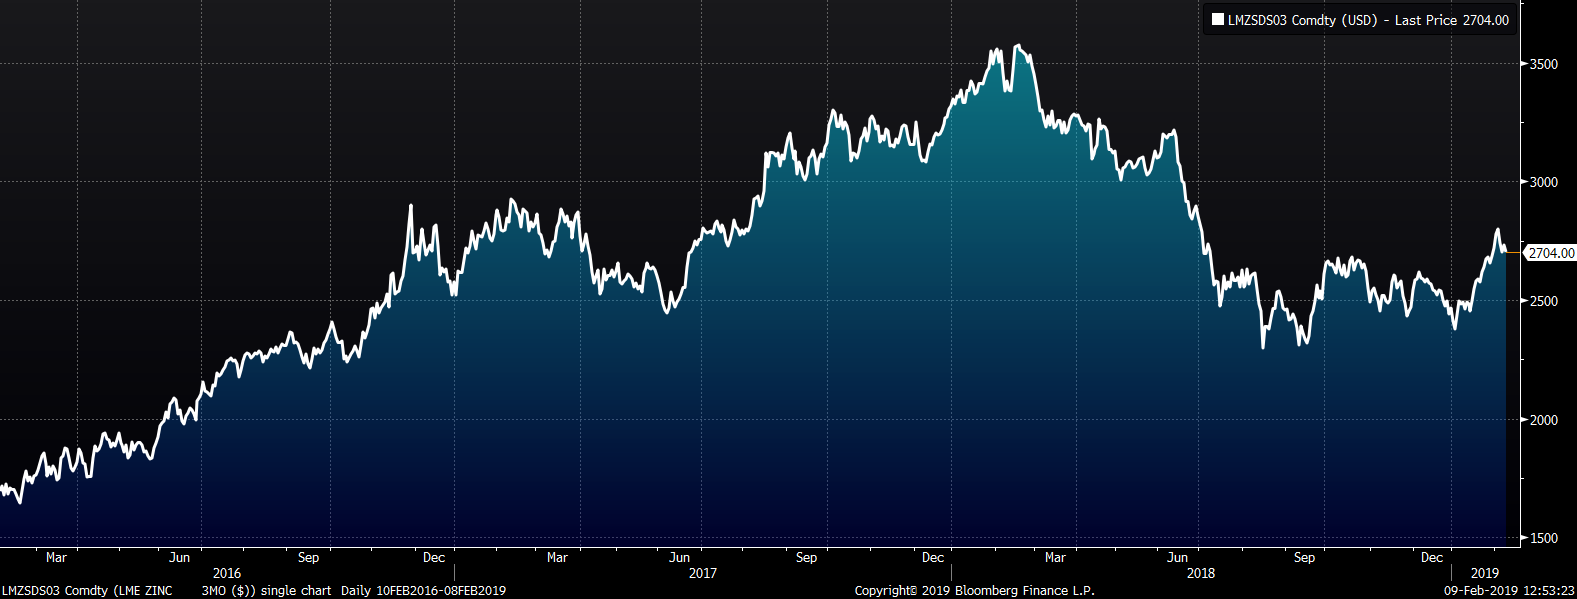
Ferrous raw materials continued to rally sharply following the dam collapse in Brazil. The March iron ore futures and IODEX gained 8.4% and 8.3%, respectively. Turkish, European and East Coast scrap rallied significantly as well following ore prices higher.
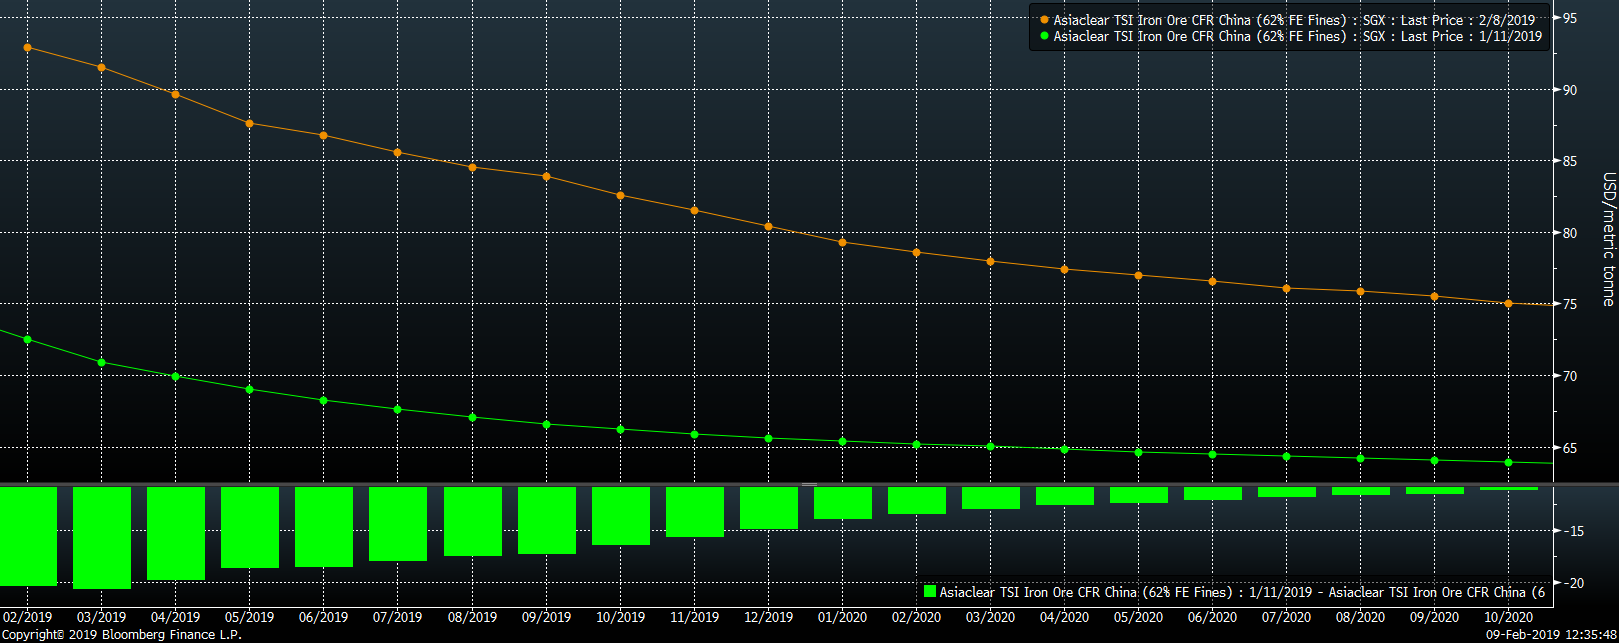
The March SGX iron ore future was up $6.67 to $91.15 while the March Turkish scrap future gained $6 to $336.00.
The SGX iron ore futures curve has continue to rally significantly with the front of the curve gaining as much as $10 over Q1 2020 and $15 over Q3 2020.
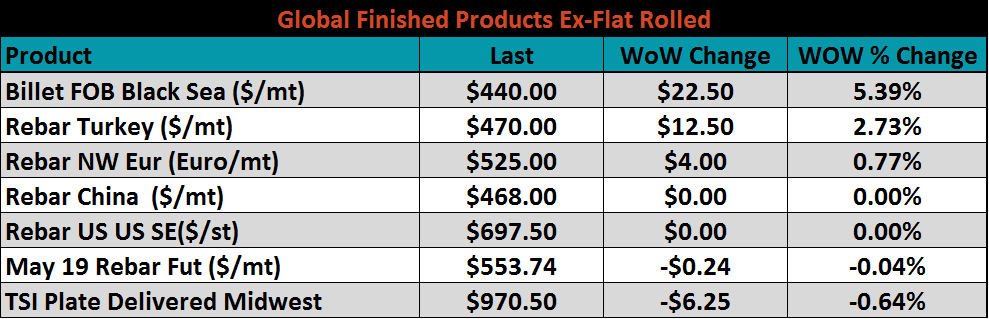
Ex-flat rolled prices shown below. Black Sea FOB billet increased 5.4% WoW.
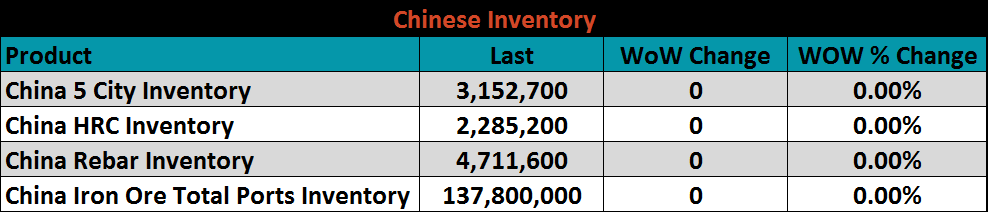
Below are inventory levels for Chinese finished steel products and iron ore. None of these inventory levels were updated due to the Lunar New Year.

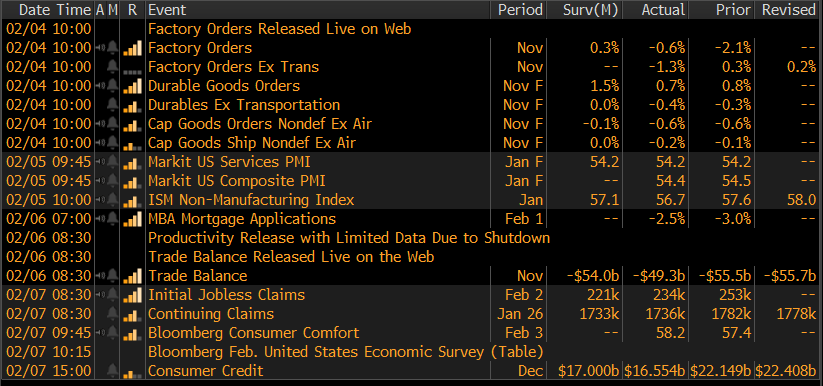
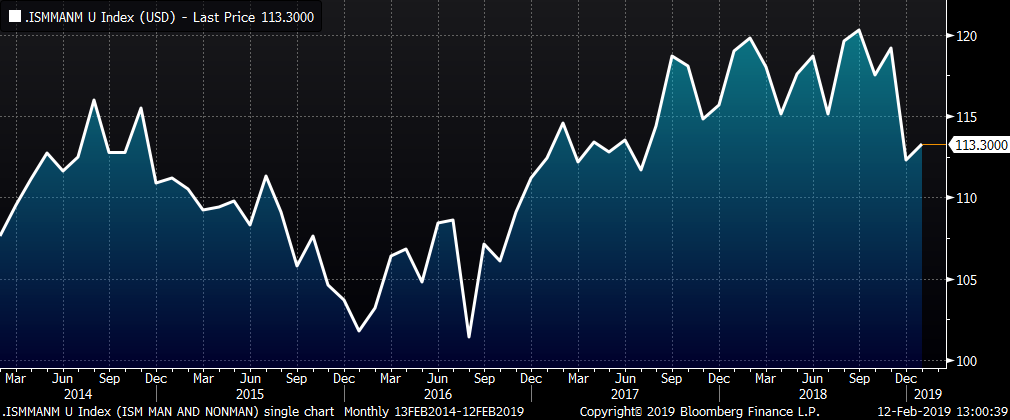
November factory orders were down 0.6% missing expectations of a 0.3% gain while factory order ex-transportation were down 1.3% MoM. The January ISM Non-Manufacturing Index fell 0.9 points to 56.7, missing expectations of a smaller drop to 57.1. The December Non-Manufacturing Index was revised lower to 57.6 from 58.
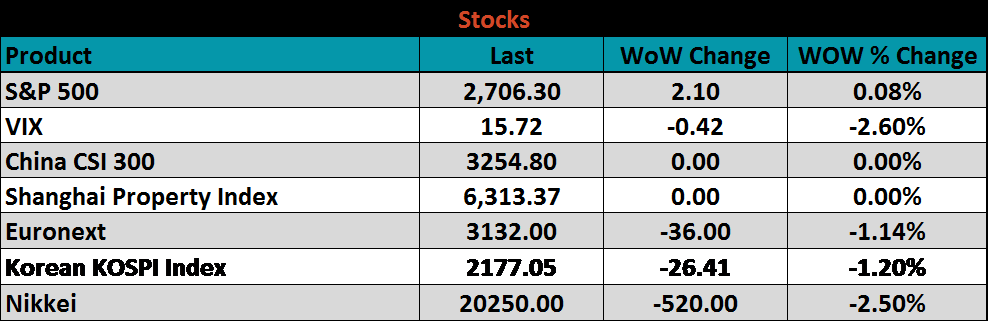
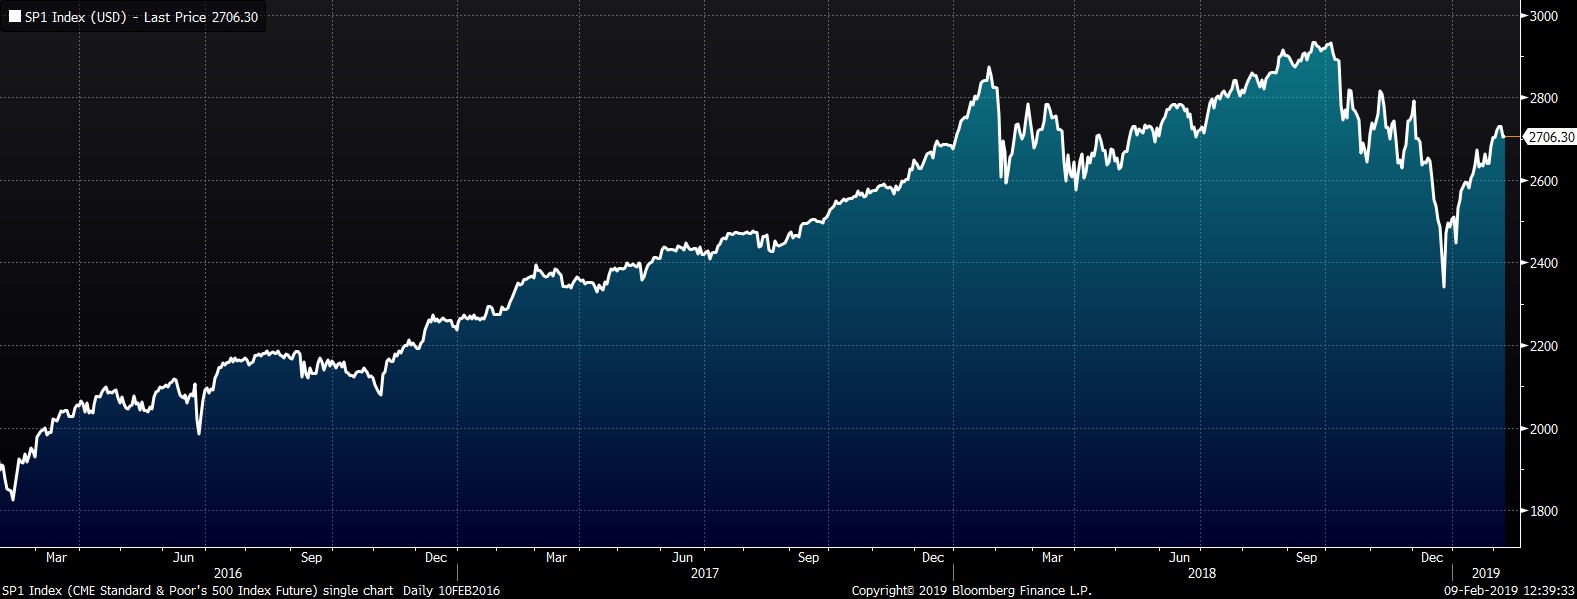
The S&P 500 showed little change, while the Nikkei, Kospi and Euronext all fell.
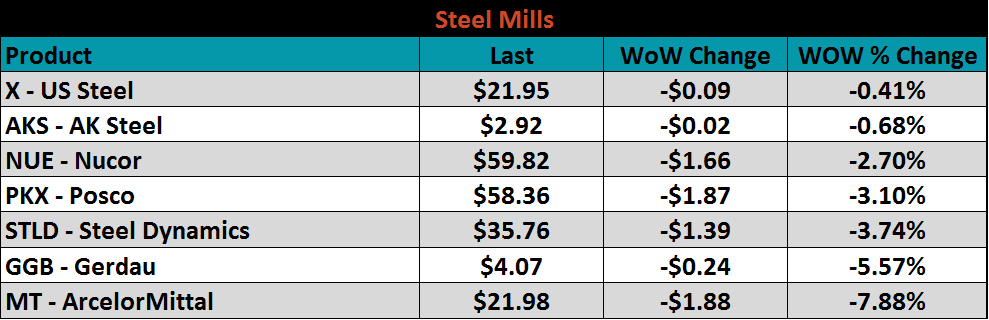
Steel mill stocks were all lower last week after ArcelorMittal, which led the group lower falling 7.9%, disappointed the market with their Q4 earnings.
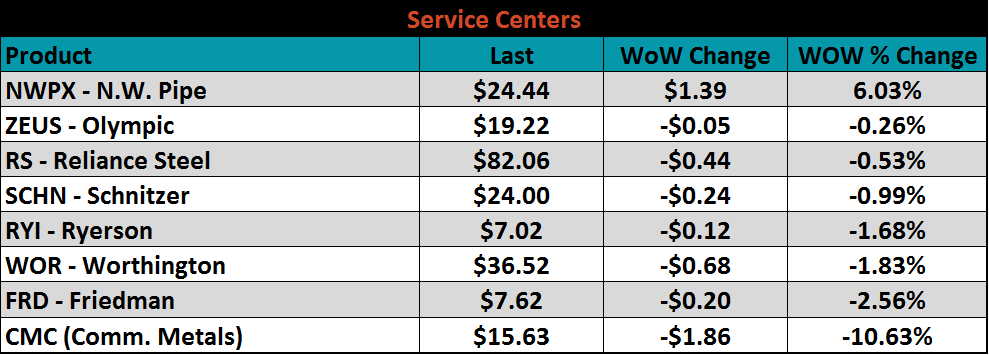
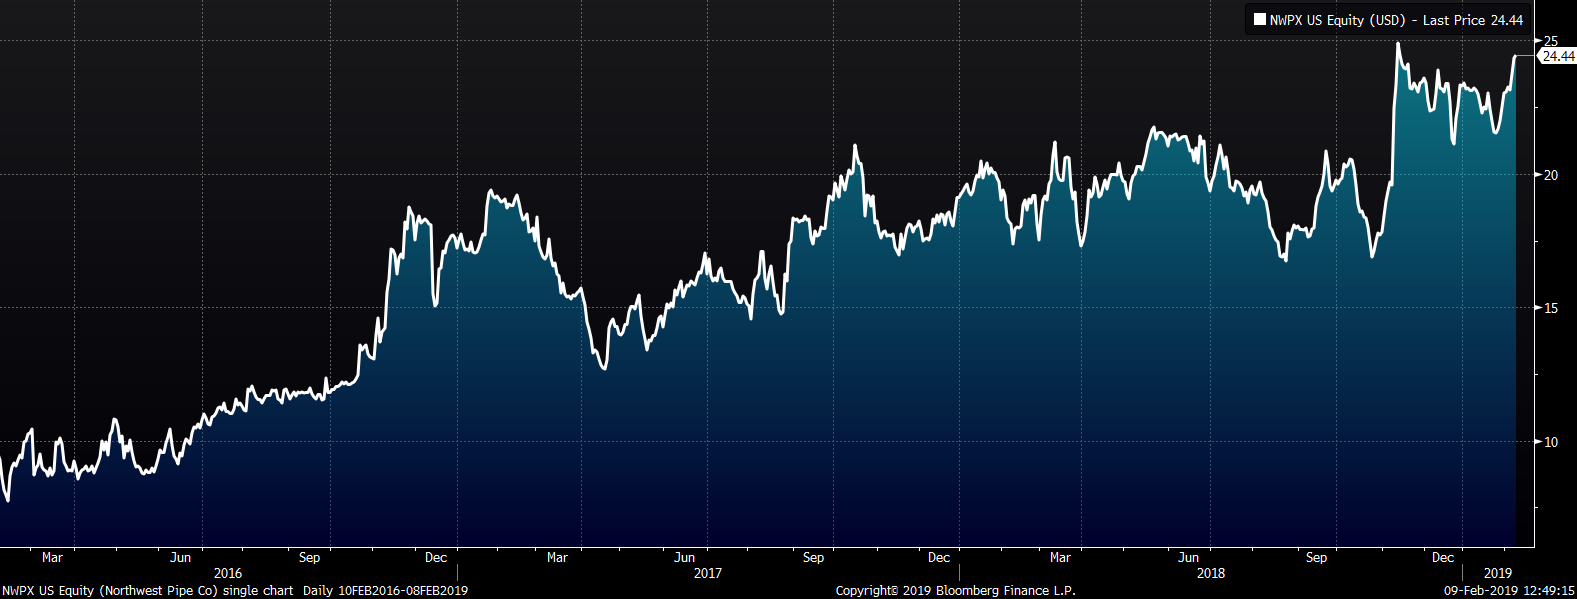
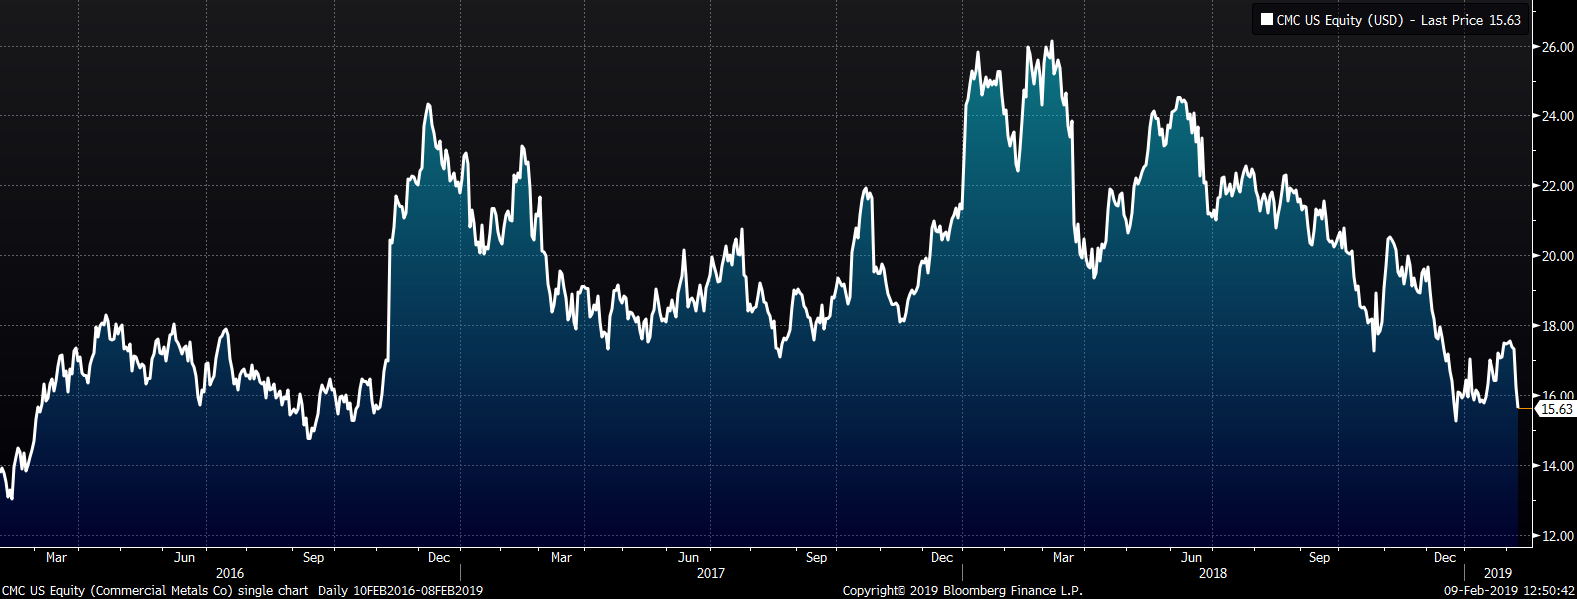
Service center stocks were mostly lower. Commercial Metals fell 10.6% after an analyst downgraded the stock.
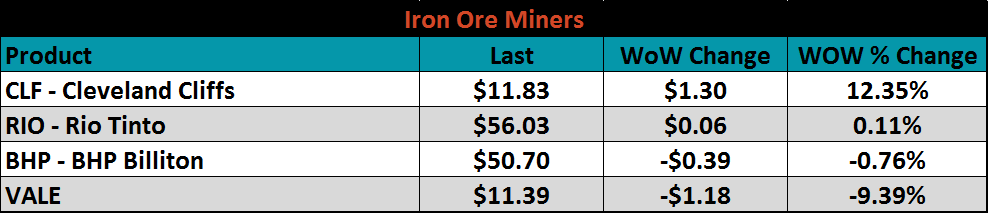
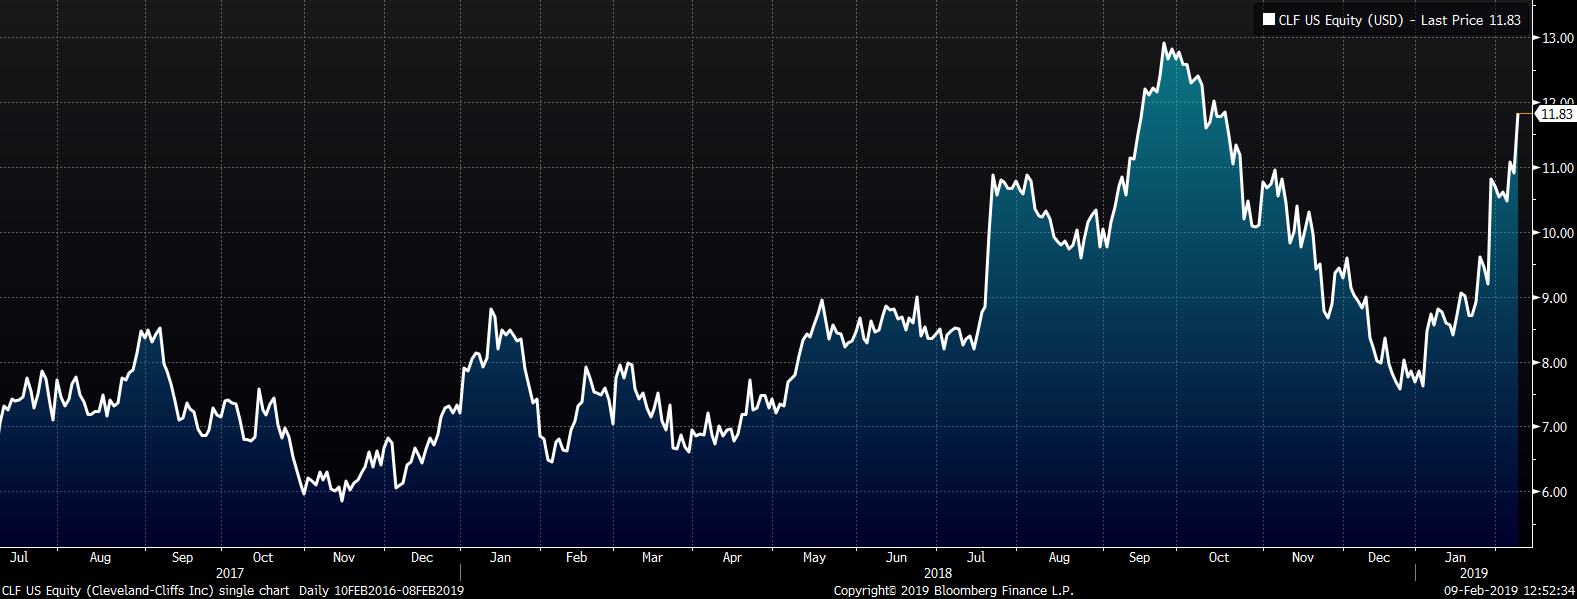
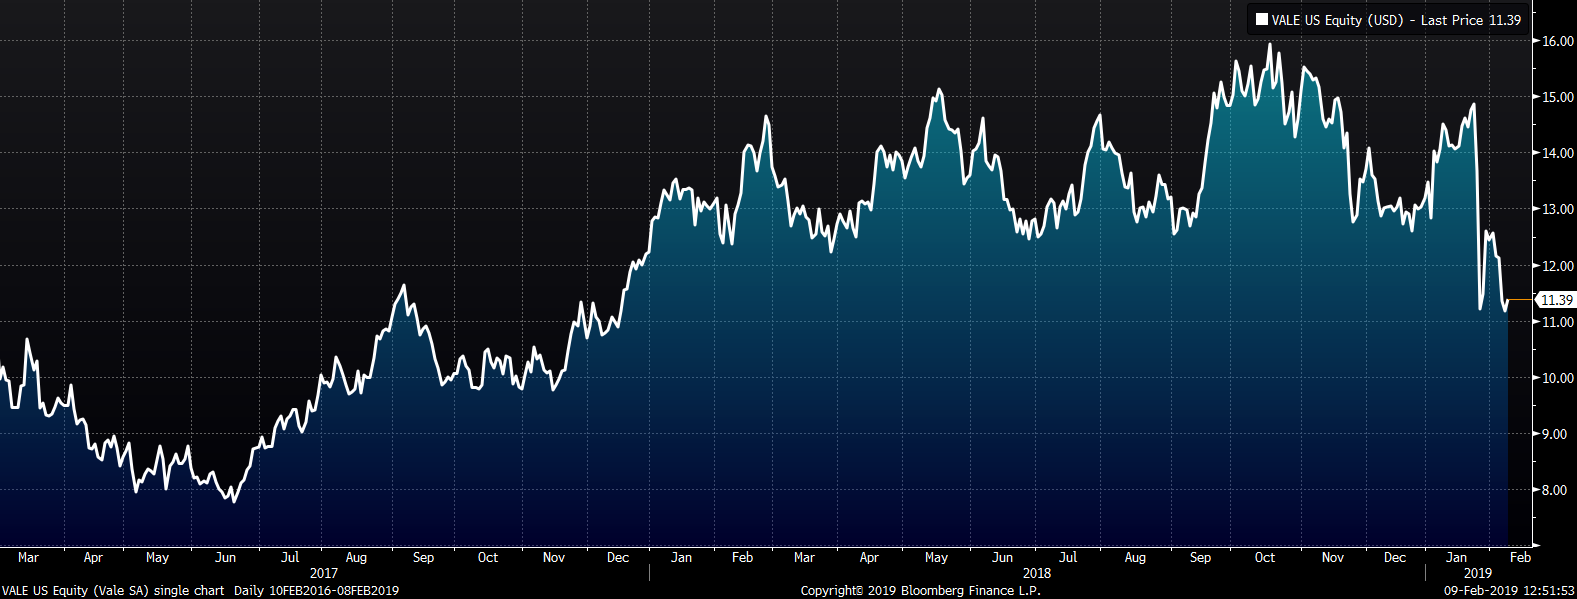
Mining’s stocks are listed below. Cleveland Cliffs was up 12.4% WoW, while VALE continues to be punished following their dam failure accident in Brazil.
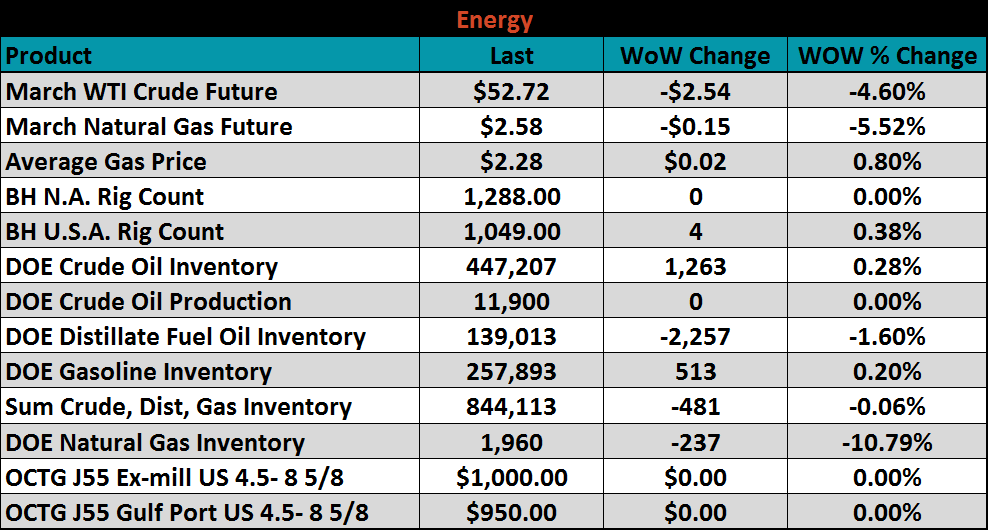
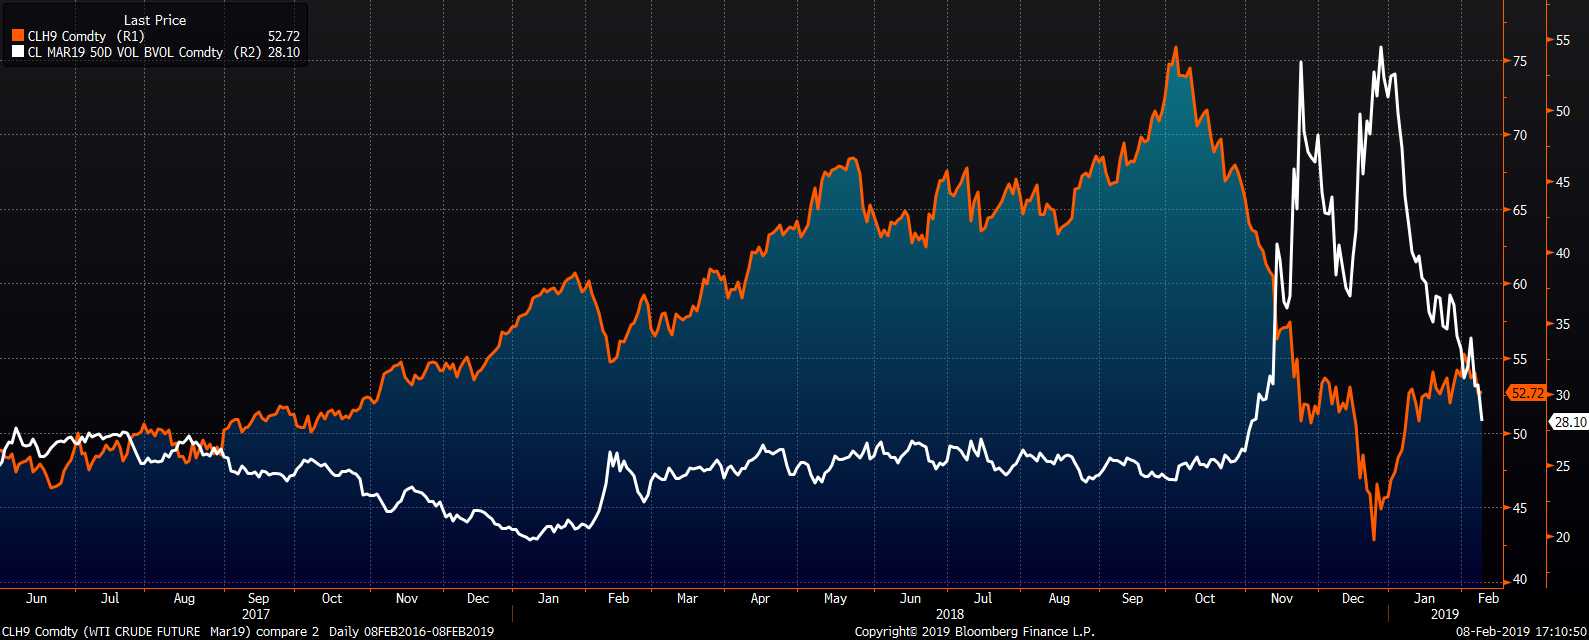
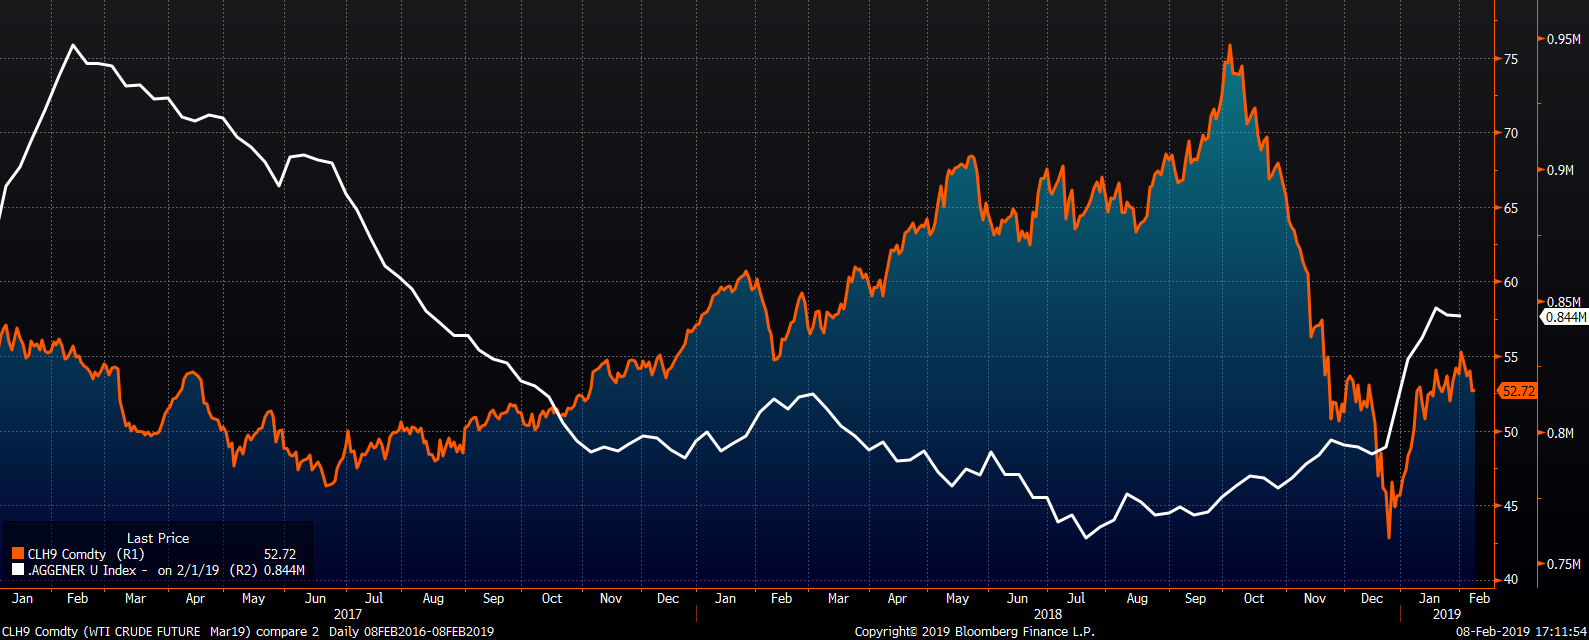
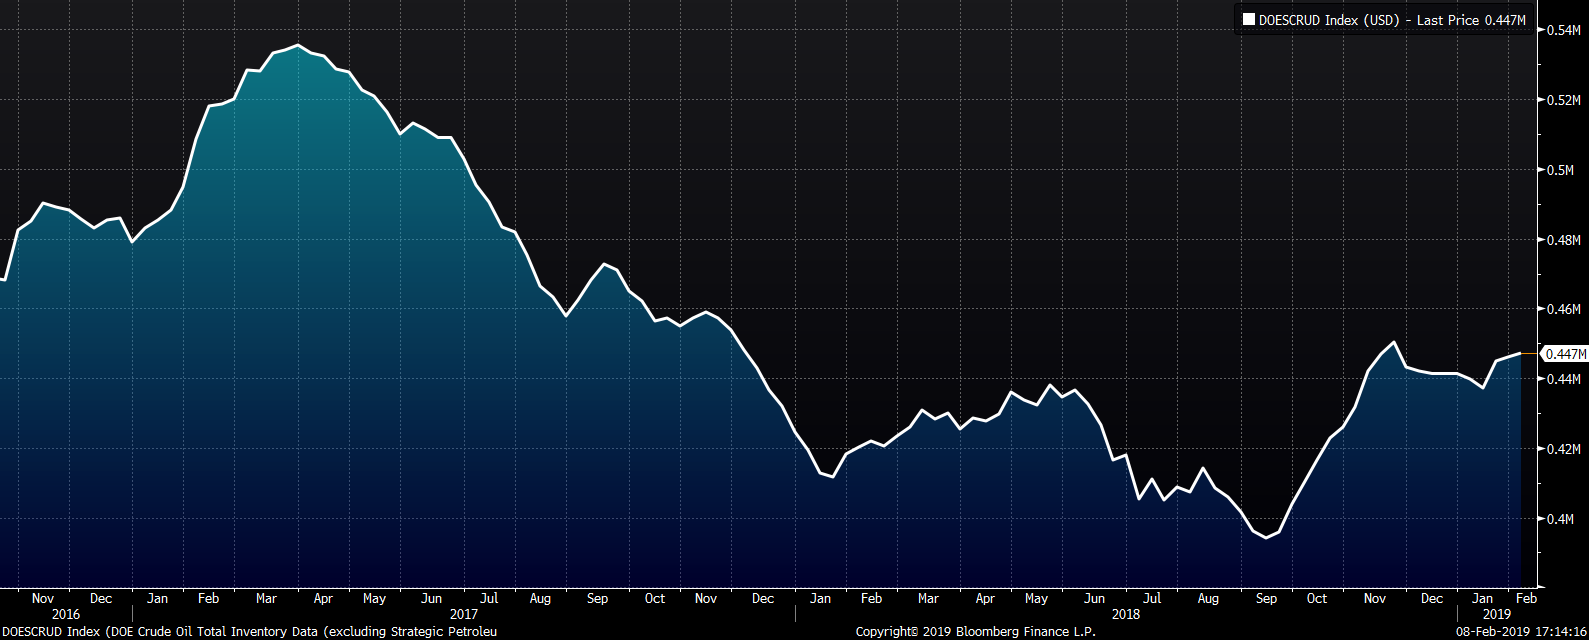
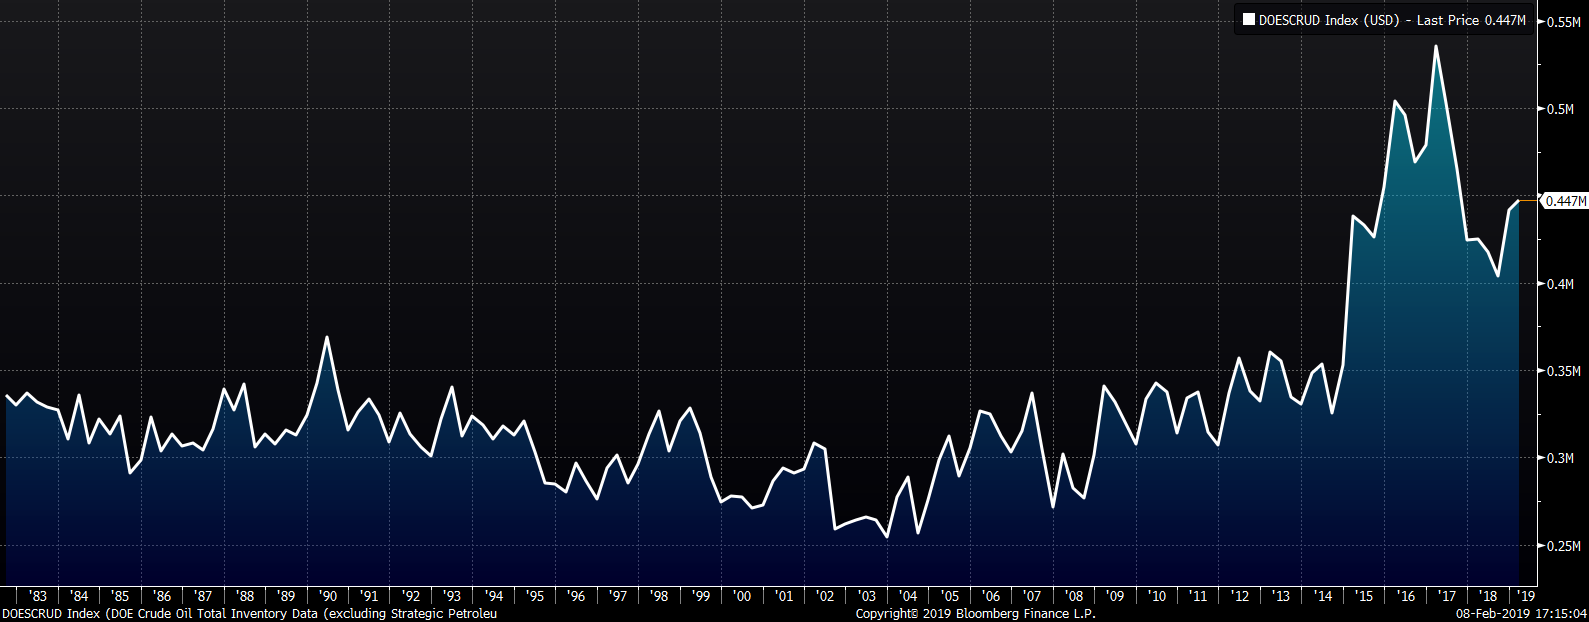
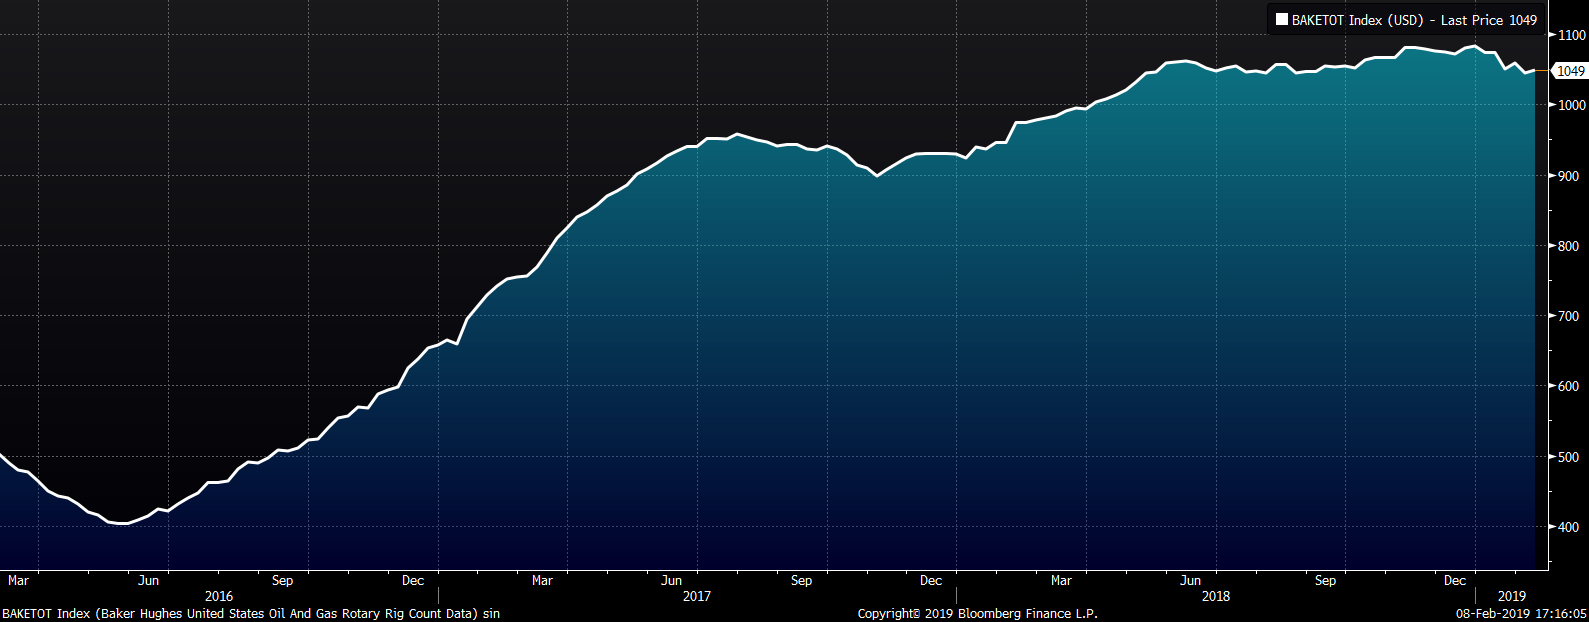
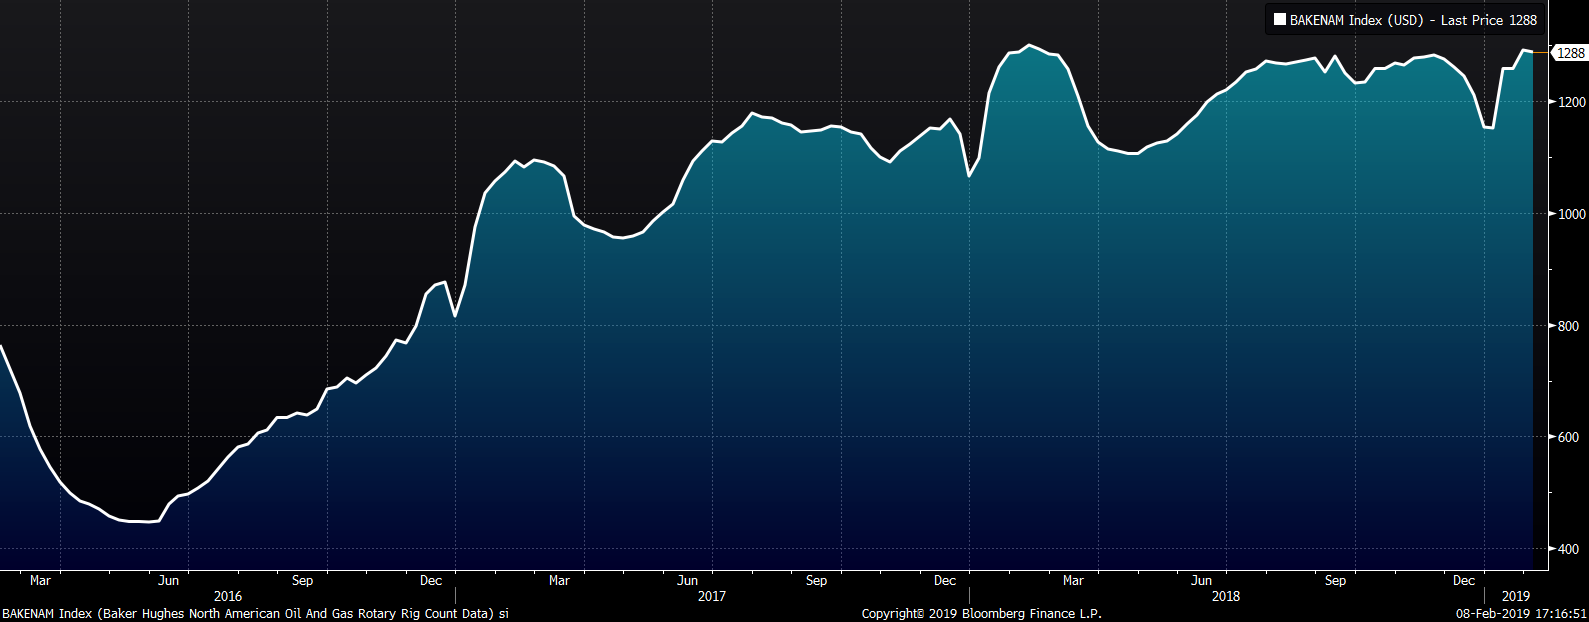
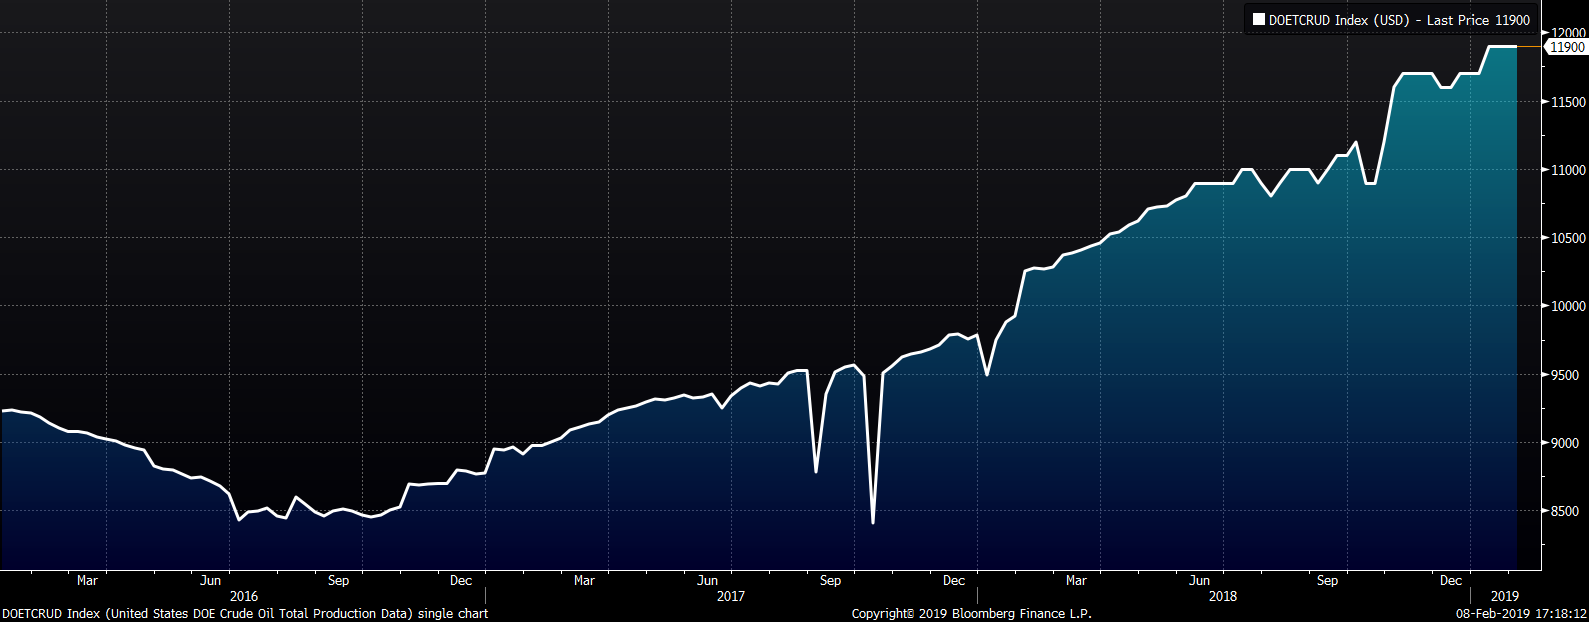
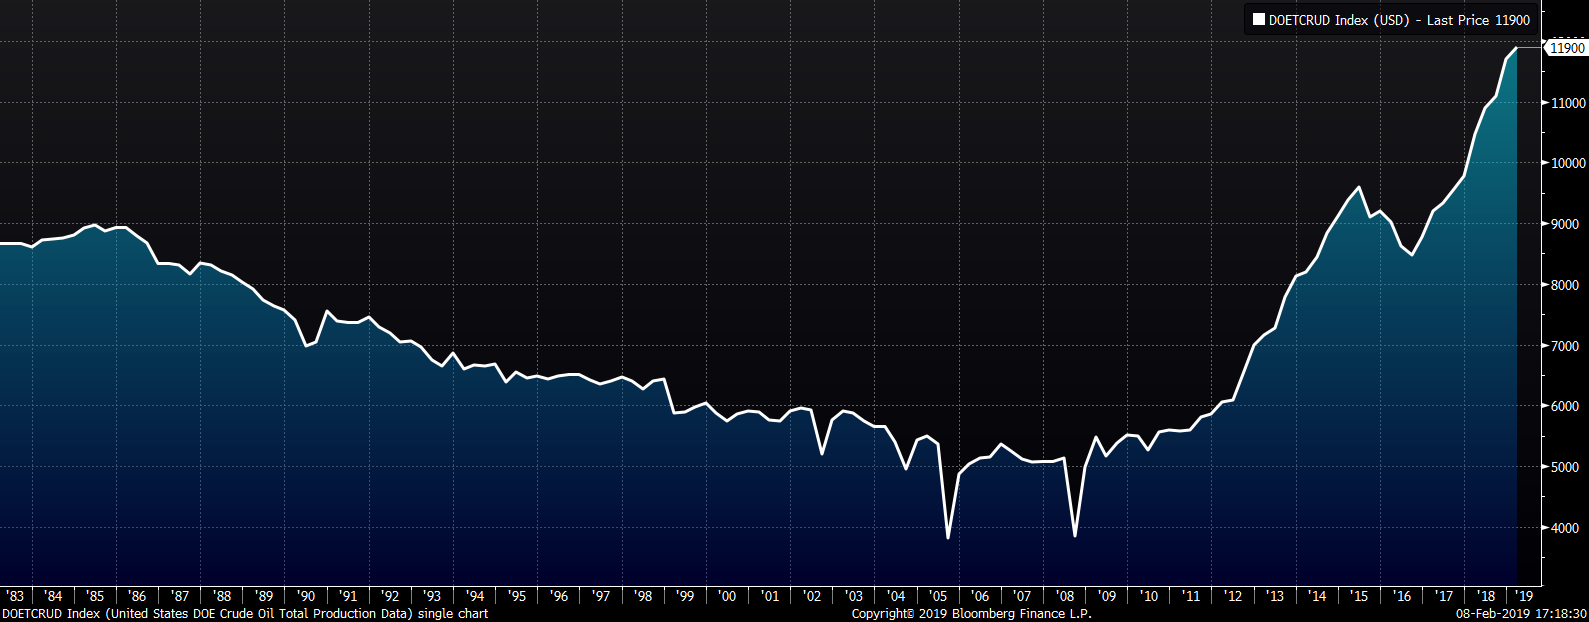
The March WTI crude oil future lost $2.54 or 4.6% to $52.72/bbl. The crude oil and gasoline inventories were up 0.3% and 0.2%, respectively, while distillate inventory fell 1.6%. The aggregate inventory level was unchanged. Crude oil production remains at 11.9m bbl/day. The U.S. rig count gained 4 rigs, while the North American rig count was unchanged. The March natural gas future lost $0.15 or 5.5% to $2.58/mmBtu. Natural gas inventory fell 10.8%.
The list below details some upside and downside risks relevant to the steel industry. The orange ones are occurring or look to be highly likely.
Upside Risks:
Downside Risks: