Content
-
Weekly Highlights
- Market Commentary
- Durable Goods Report
- Risks


The next few weeks will be critical for the domestic HRC market. As previously discussed, buyers will finally exhibit their willingness to pay higher prices for physical material. Even though the spot price has been above $600 for multiple weeks, many buyers have been able to work through inventory or purchase at much lower levels due to contracts based on lagging indexes.
A typical contract allows buyers to purchase material from the mill based on the index in the previous month i.e. February tons are priced off a January index reading. Because some indexes have lagged the spot market recently, actual transactions are still occurring well below $600, and buyers are deferring to increasing contract buys rather than spot buys. However, expectations displayed in the future market predict these indexes will move higher by February, which will result in a higher March price. Due to current lead times, orders for March delivery will need to be placed within the next few weeks, and buyers will only do so if they see support in their order book for $600+ steel.
This contract construct allows mills to easily fill order books in a rising price environment because buyers will max out the number of tons placed on the contract. This reduces the need to sell spot tons and allows mills to maintain elevated lead times, thus keeping prices higher for a longer period.
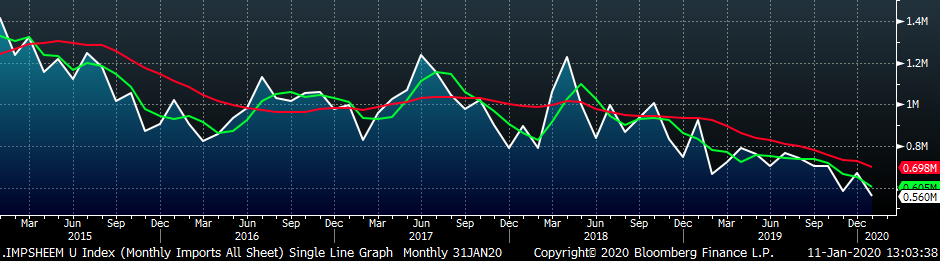
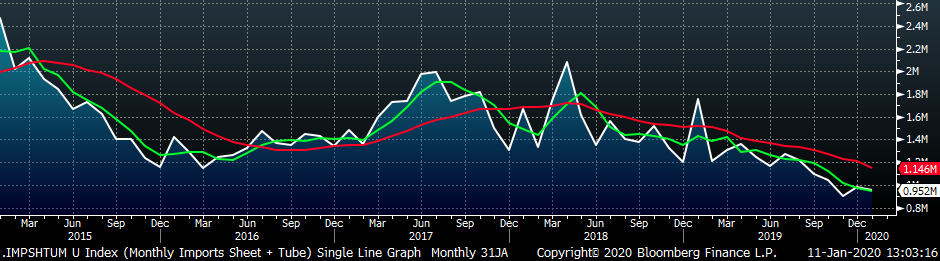
While current buying in this upcycle is shifting to contracts, there is another, protracted shift occurring in sourcing method resulting from the almost two years of Section 232 tariffs. Buyers are shifting an increasing portion of their orders to domestic mills for material that was previously imported. The chart below shows the trailing 12-month sum of net sheet and tube imports (imports minus exports) in yellow compared to the trailing 12-month average of U.S. raw steel production from AISI in red.
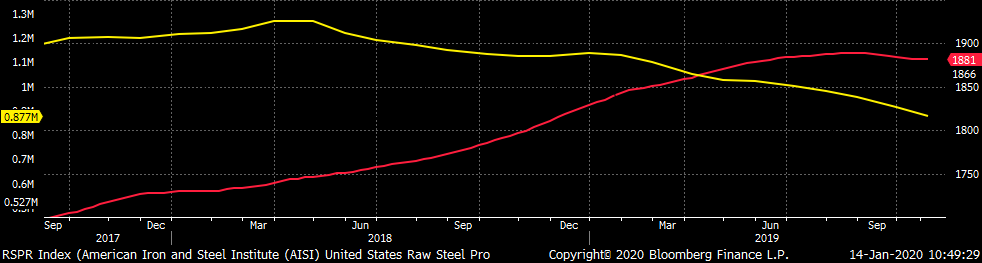
Many analyzing the domestic steel market over the last year have pointed to an increase in production capacity announced or brought on. However, net imports have declined over the same time, with the most dramatic monthly shifts coming at the end of 2019. Based on current pricing differentials and lead times, we expect net import levels to remain low well into 2020, which will continue to drive this 12-month average lower. Moreover, as buyers increase their purchases at domestic mills with shorter lead times compared to foreign material, service centers and end users will be able to manage their inventory to lower levels.
These changes in purchasing method result in three key dynamics, all serving to increase upside price risks that have been previously identified. First, the shift to contract from spot buys means mills will be less aggressive in negotiating lower prices for spot orders because they have filled more of their order books with contracted tons. Second, less competition from imported material gives the buyer fewer options for sourcing, which also strengthens the domestic mill in negotiating price. Finally, lower inventory levels within the supply chain will amplify any supply shock, driving prices higher than would be the case at previously normal inventory levels. The current spot price does not appear to reflect the total contribution of these additional risks. Additionally, the future curve priced below the current spot price certainly does not account for these upside risks.
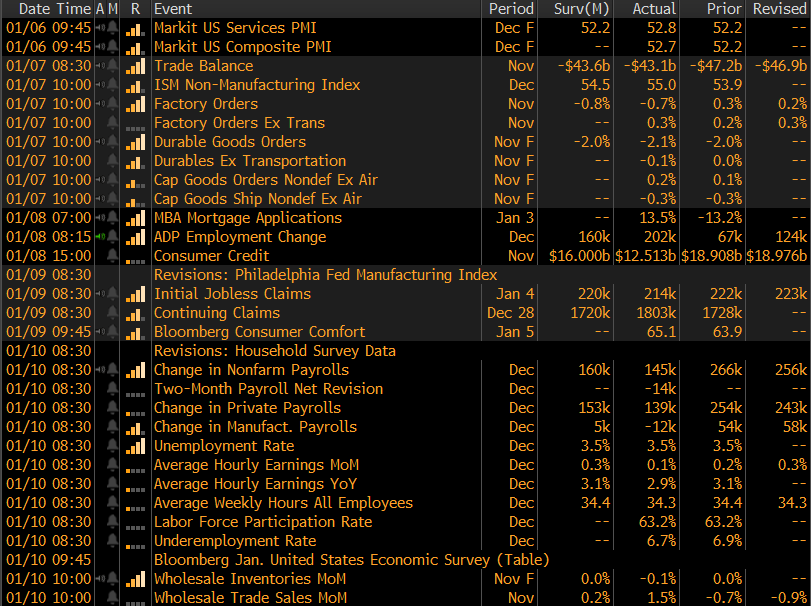
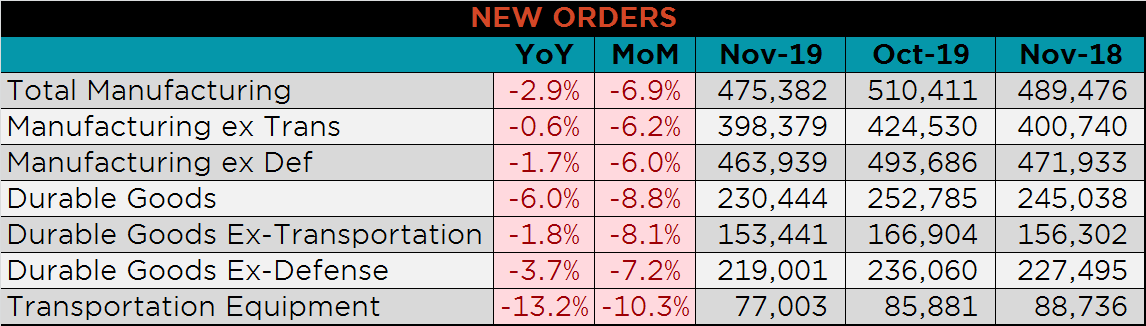
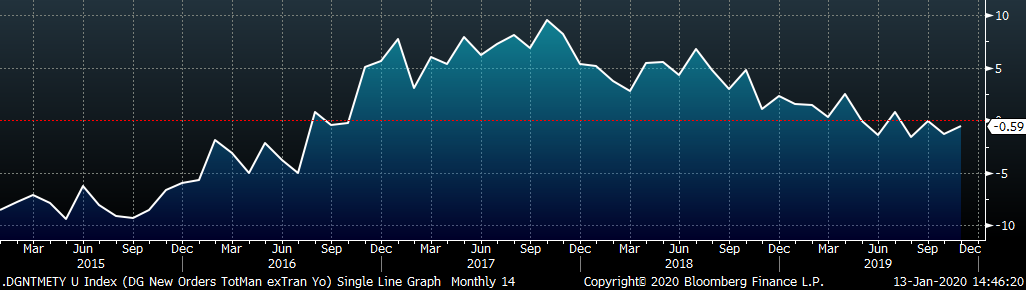
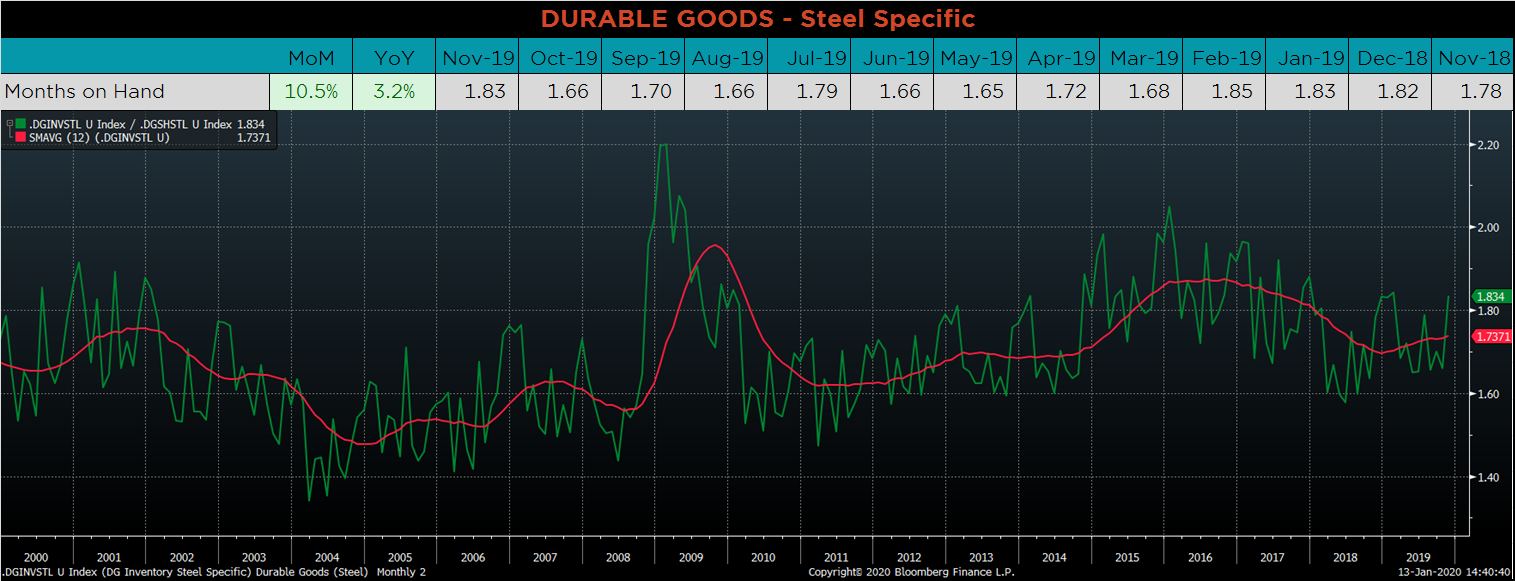
Below are final November new orders from the Durable Goods report. Overall, new orders were lower MoM and YoY. Manufacturing new orders ex-transportation decreased slightly compared to November 2018. The final chart looks at the months on hand (inventory divided by shipments) for durable goods categories that are steel intensive. MOH moved jumped as monthly shipments decreased more significantly than inventories, which historically is normal for the end of the year.
Below are the most pertinent upside and downside price risks:
Upside Risks:
Downside Risks:
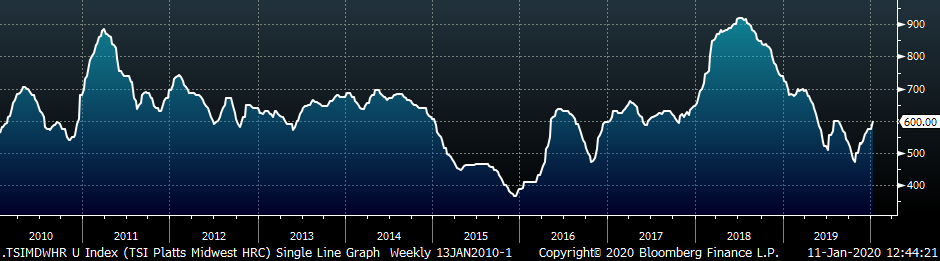
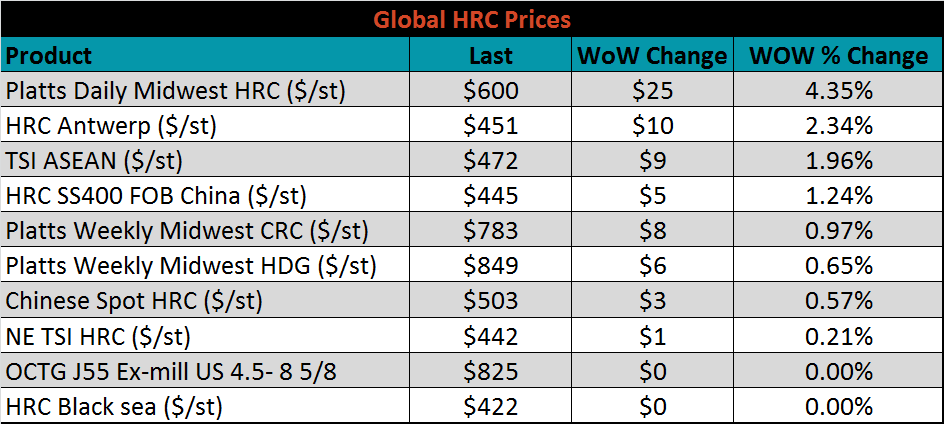
The Platts TSI Daily Midwest HRC Index was up $25 to $600.
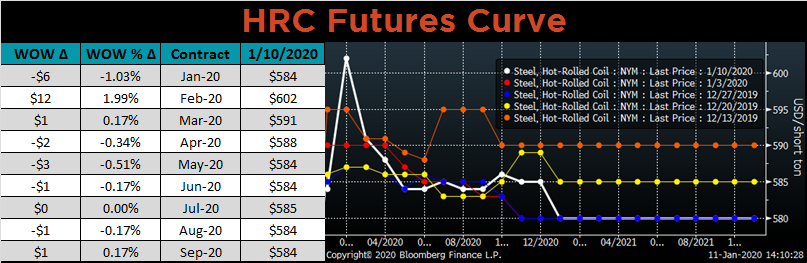
The CME Midwest HRC futures curve is below with last Friday’s settlements in white. February jumped significantly, while the remainder of the curve changed very little.
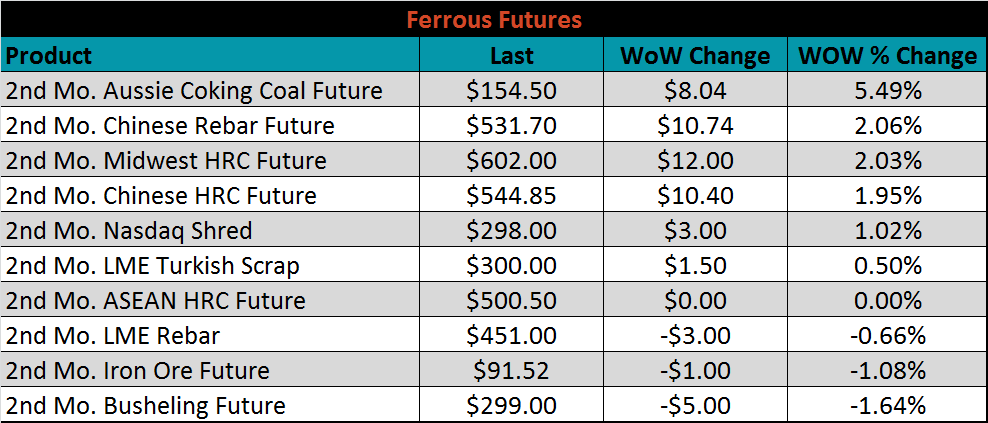
March ferrous futures were mixed. The Australian coking coal future gained 5.5%.
The global flat rolled indexes were mostly higher, led by TSI Midwest HRC, up 4.4%.
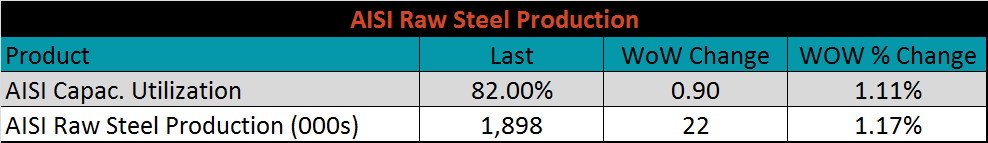
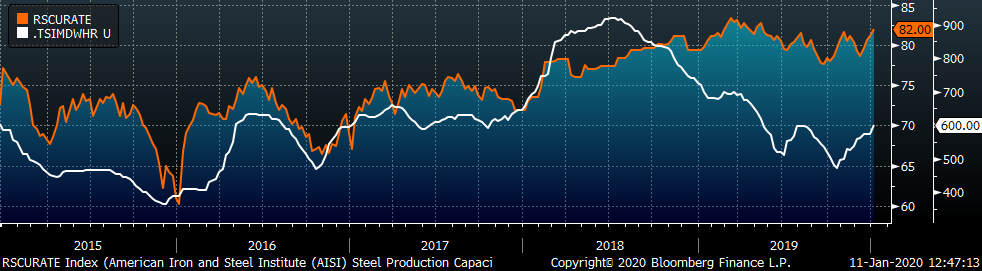
The AISI Capacity Utilization Rate was up 0.9% to 82%.
January flat rolled import license data is forecasting a decrease of 112k to 560k MoM.
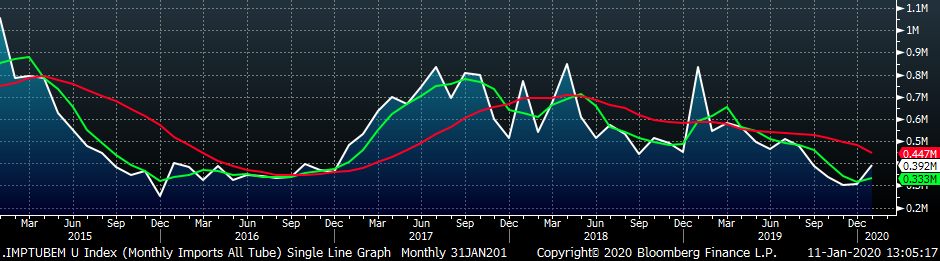
Tube imports license data is forecasting a MoM increase of 85k to 392k tons in January.
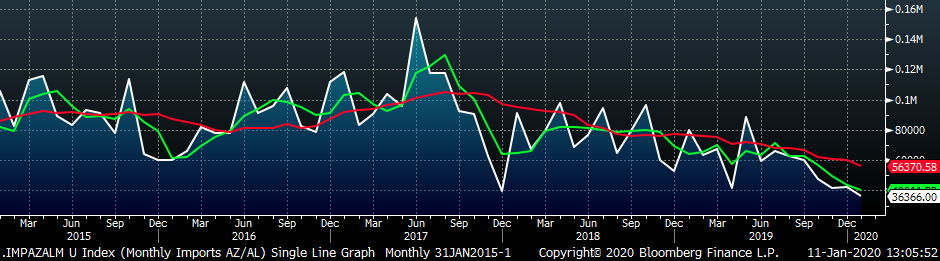
AZ/AL import license data is forecasting a decrease of 6k in January to 36k.
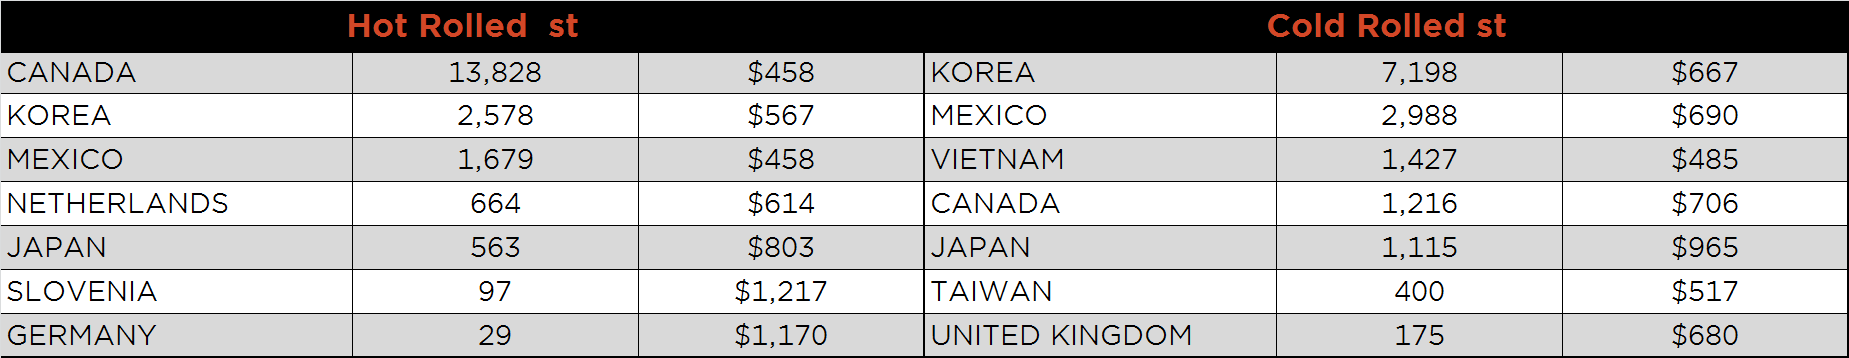
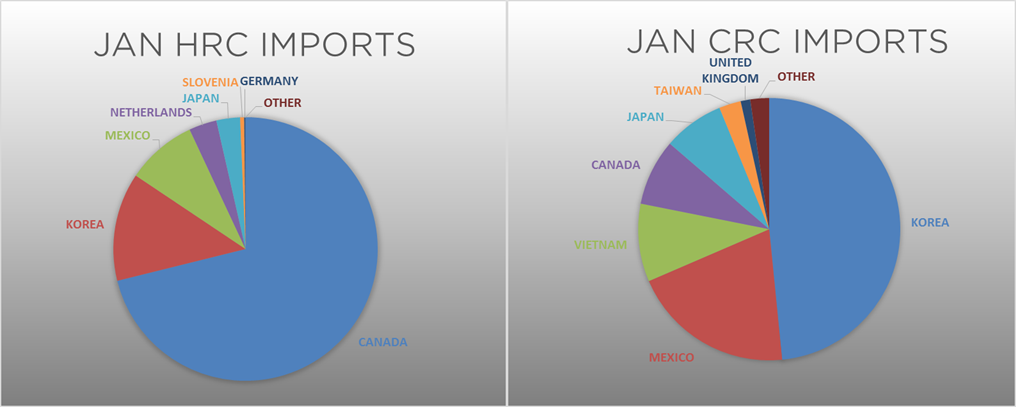
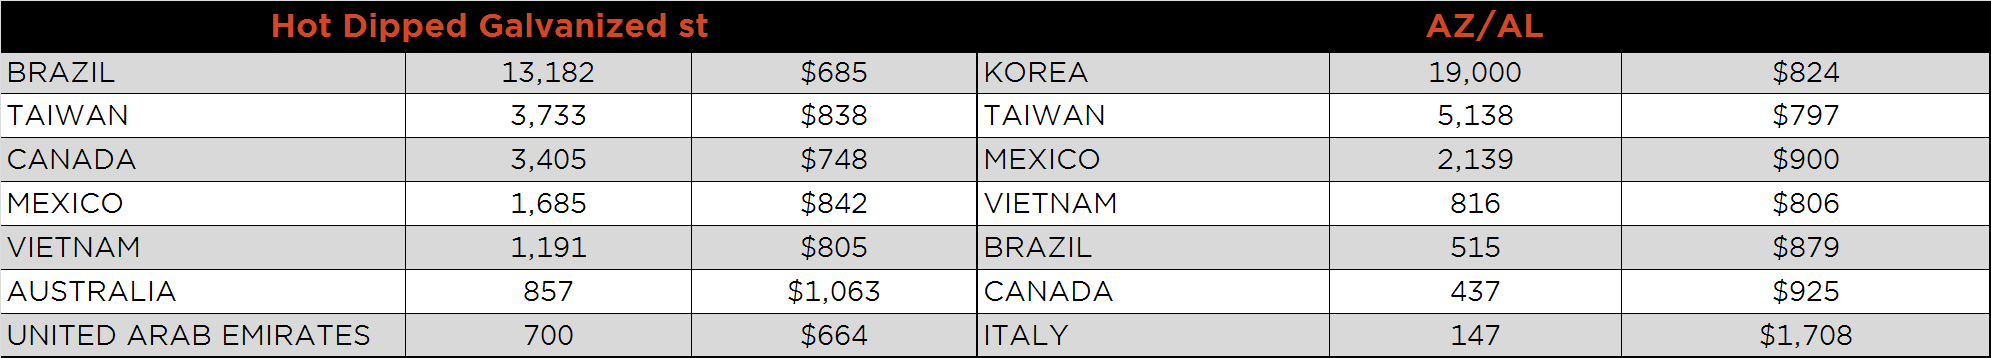
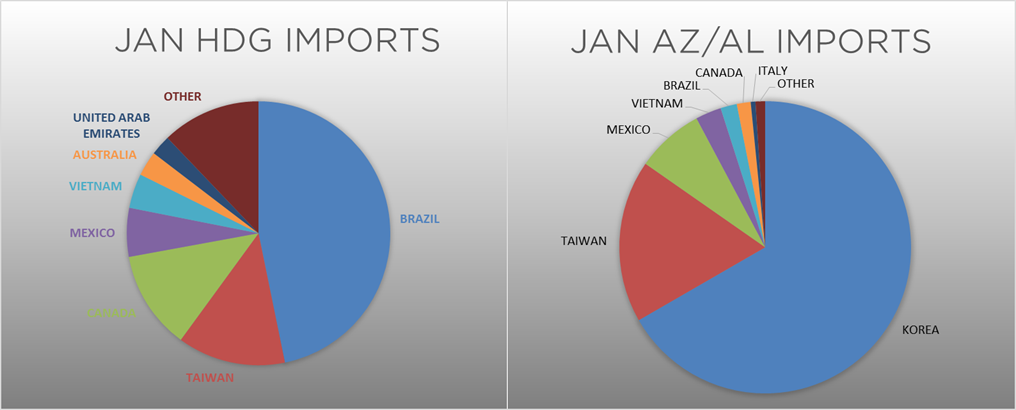
Below is January import license data through January 7, 2020.
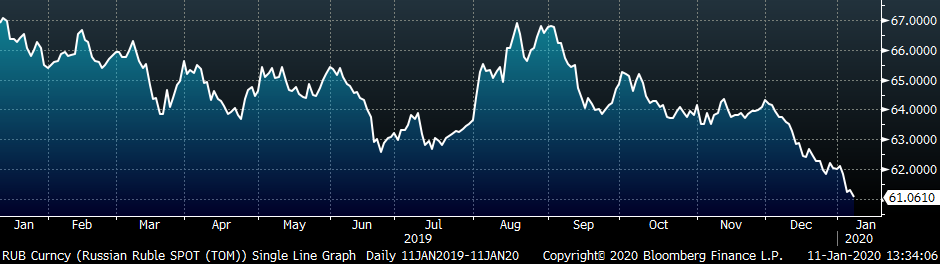
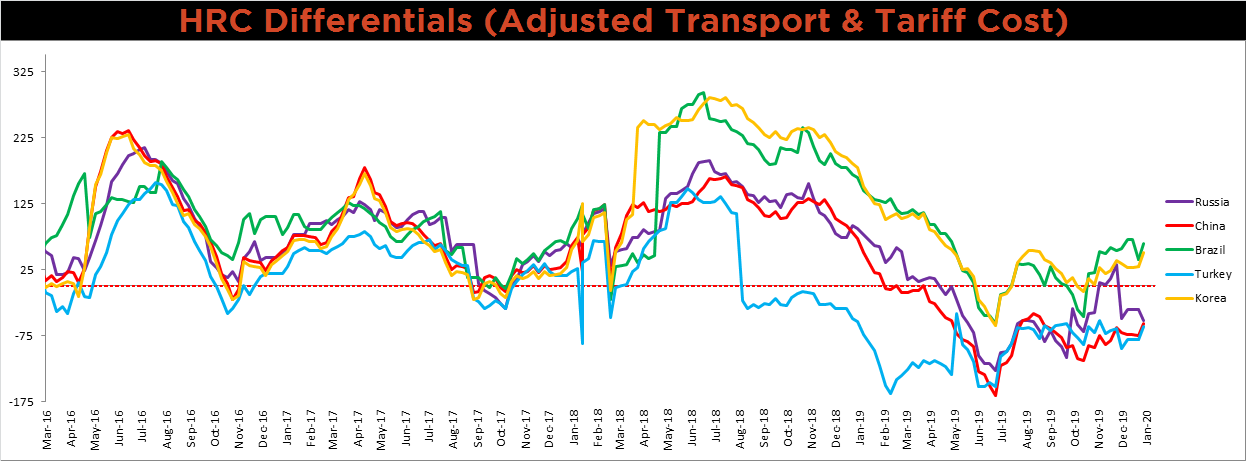
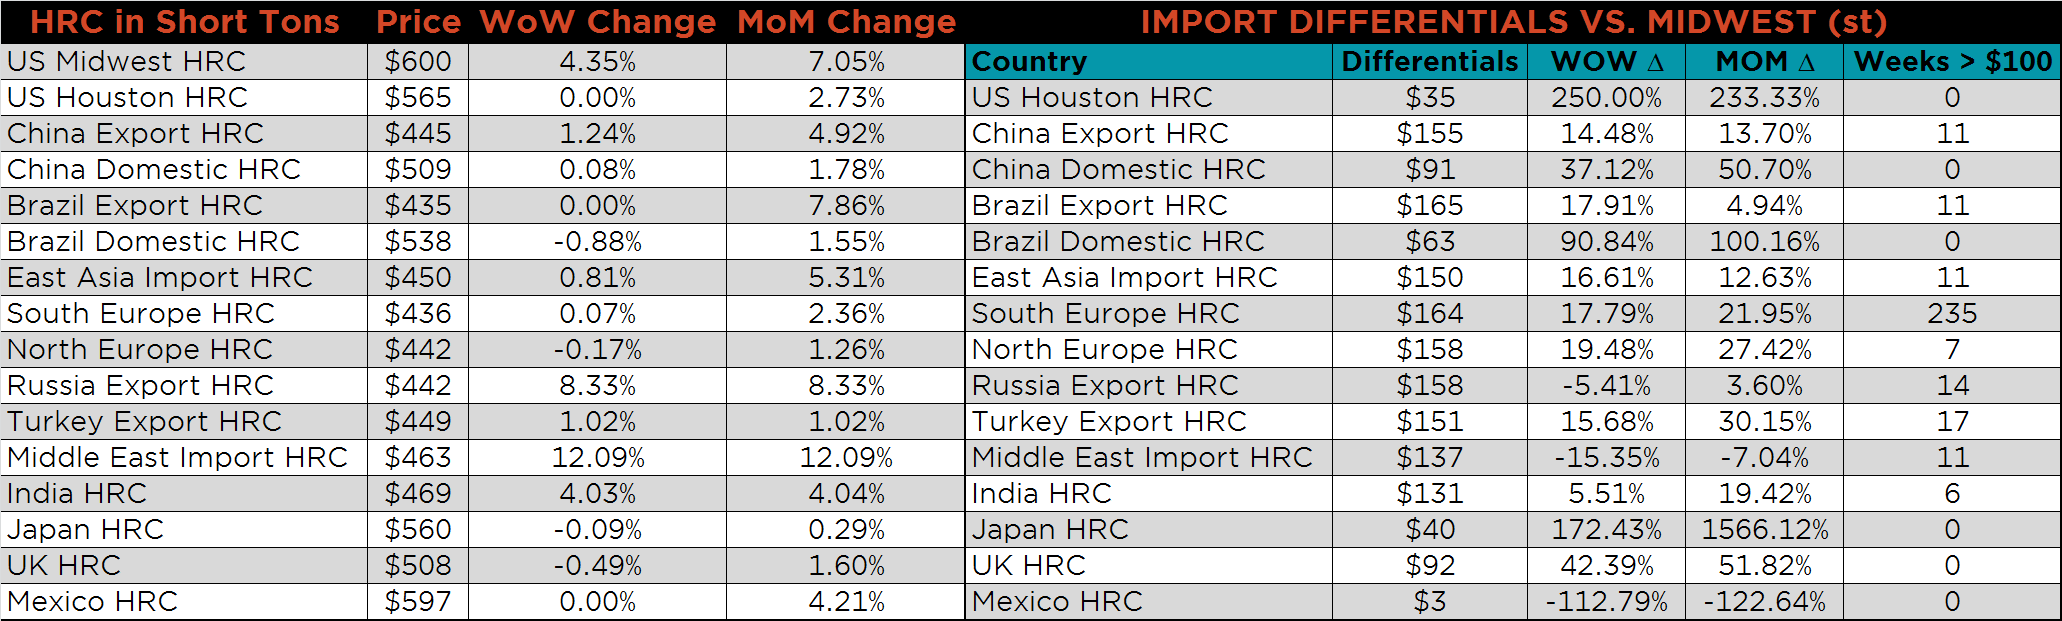
Below is the Midwest HRC price vs. each listed country’s export price using pricing from SBB Platts. We have adjusted each export price to include any tariff or transportation cost to get a comparable delivered price. The Turkish, Chinese, Brazilian and Korean price differentials all increased, while the Russian decreased.
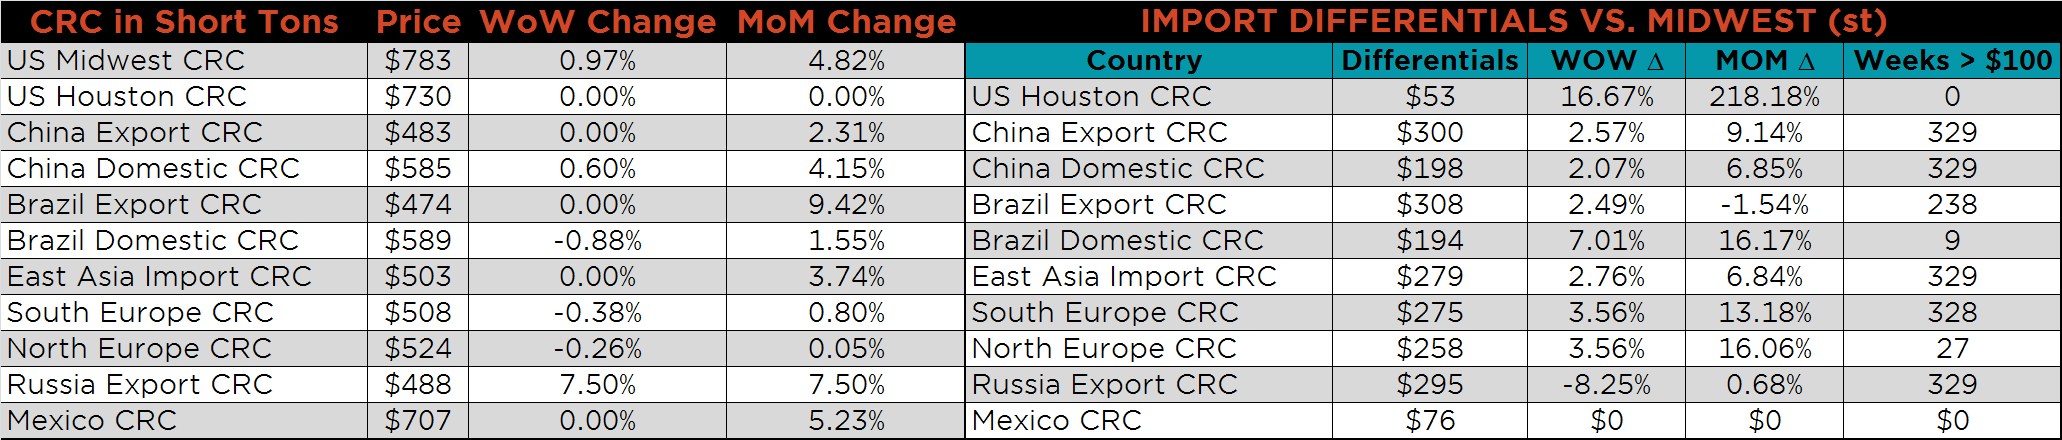
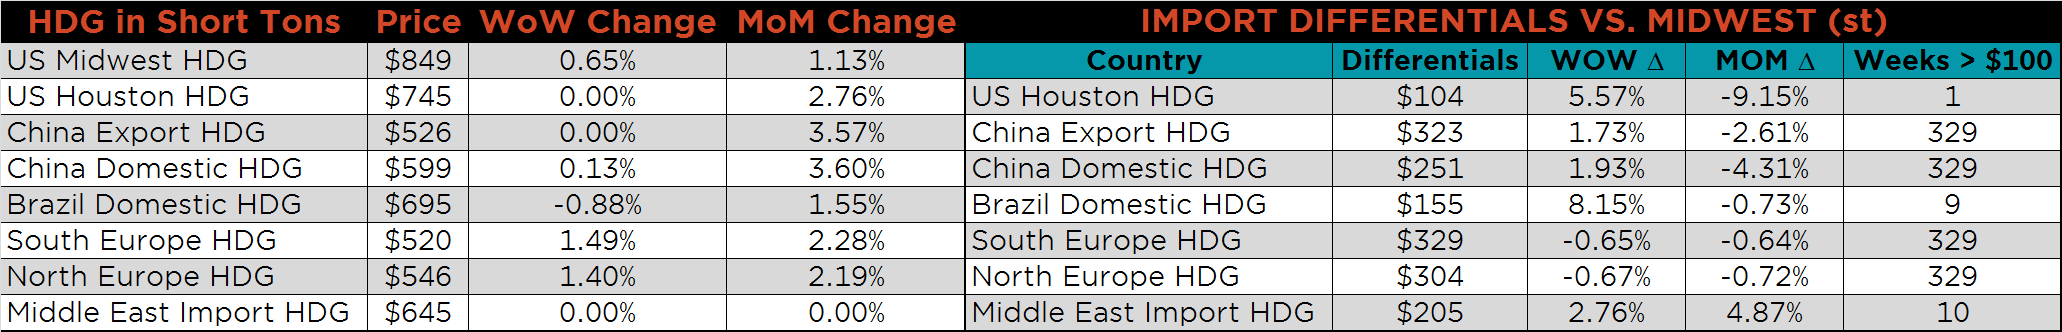
SBB Platt’s HRC, CRC and HDG pricing is below. The Midwest HRC, CRC and HDG prices were up, 4.4%, 1% and 0.7%, respectively. Globally, the Russian HRC and CRC export prices were up, 8.3% and 7.5%, respectively.
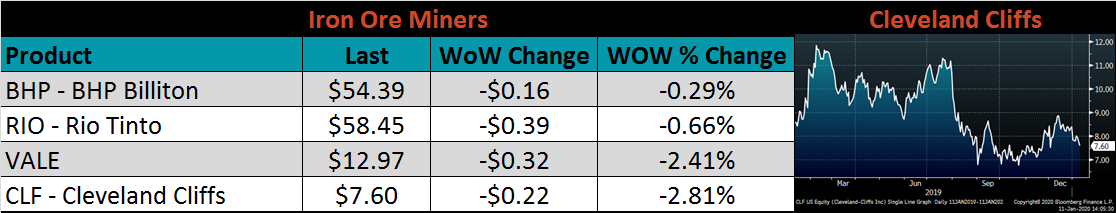
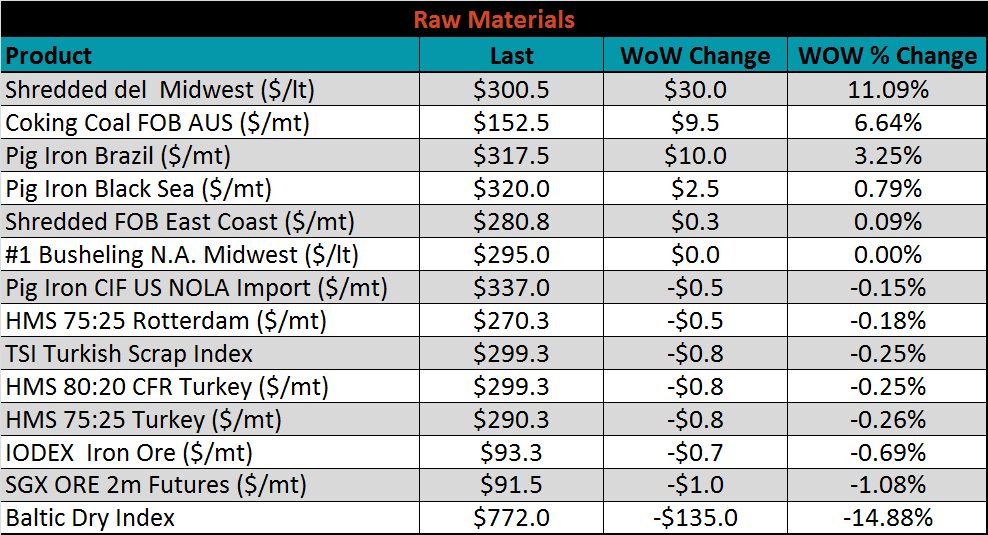
Raw material prices were mixed. Midwest shredded was up 11.1%. Scrap increasing in January further supported recent price increases, and the current outlook for scrap remains stable.
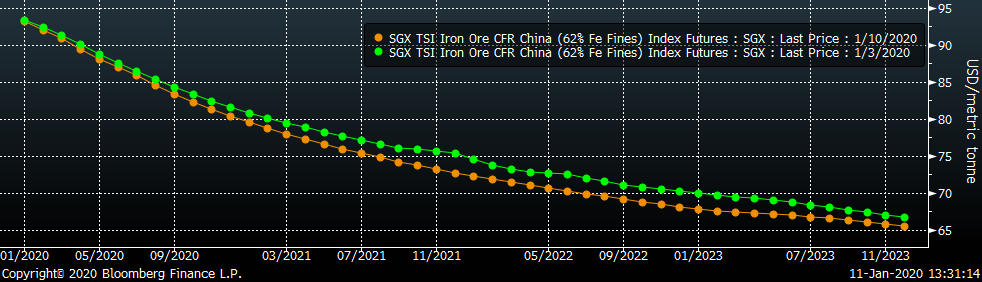
Below is the iron ore future curve with Friday’s settlments in orange, and the prior week’s settlements in green. The curve shifted lower, more significantly in the back.
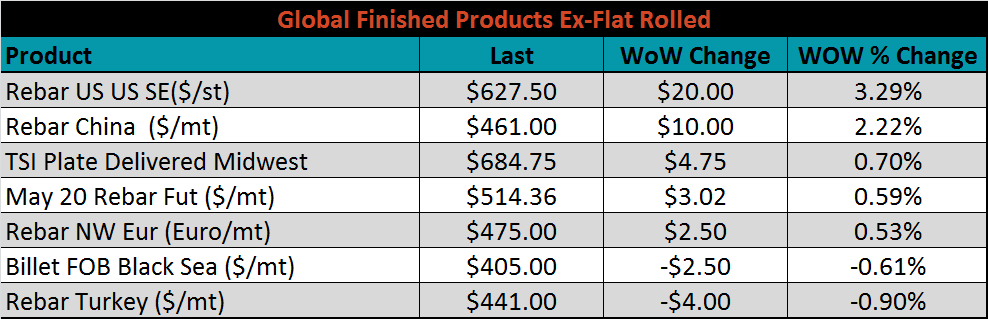
The ex-flat rolled prices are listed below.

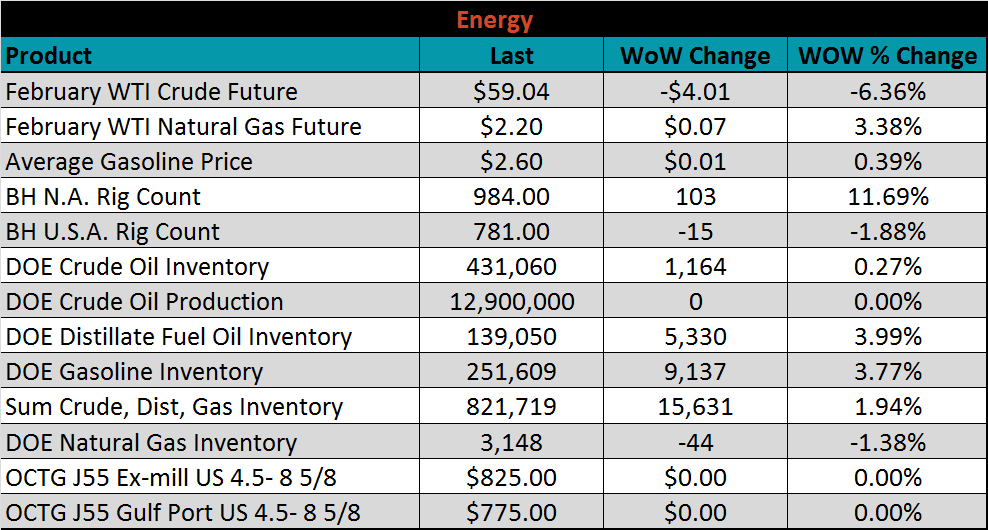
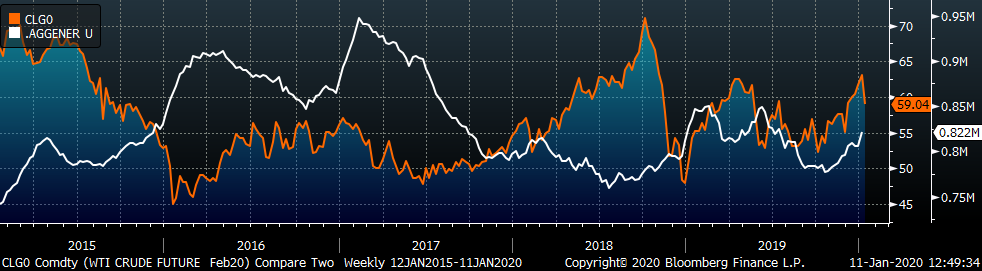
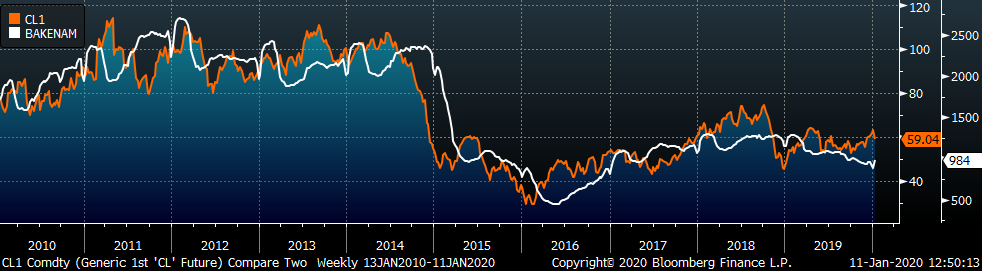
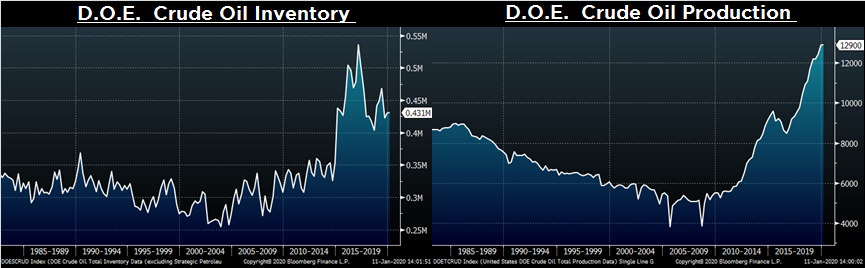
Last week, the February WTI crude oil future lost $4.01 or 6.4% to $59.04/bbl. The aggregate inventory level was up 1.9% and crude oil production remains at 12.9m bbl/day. Historically, the crude oil exhibits more upside price risk with Middle East tensions looming, but increased domestic supply has muted the price volatility. Additionally, increasing aggregate energy inventory and rising North American rig count have reduced oil price gains. As far as the steel industry is concerned, demand from the energy sector will remain depressed with a cap on the crude oil price.
The list below details some upside and downside risks relevant to the steel industry. The orange ones are occurring or look to be highly likely. The upside risks look to be in control.
Upside Risks:
Downside Risks: