Content
-
Weekly Highlights
- Market Commentary
- Durable Goods
- Upside & Downside Risks


Prices continue to slide in both the physical and financial markets with a steady drumbeat of bearish news around mill orderbooks, elevated imports, and growing inventories. As downward pressure mounts, all eyes should turn to the side of domestic producers as we look for the bottom. In the next couple of weeks, these mills will report Q4 earnings. These earnings calls will provide insight into how aggressively they plan on confronting this falling price environment from a production and outages standpoint. Under current market dynamics, mills are more profitable selling spot tons, even $200 below published prices, than at any point in 2018. They have also negotiated favorable lagging index contracts and fixed price contracts for the rest of 2022, which will allow them to continue producing significant profits. With all signs clearly pointing to lower prices ahead and mills continuing to generate outsized profits, will they really take down production? Or are they better off maintaining or increasing production to drive the domestic price to, or below, global prices and stem the flow of imports? We will be looking for these answers in the weeks and months ahead.

Below are final November new orders from the Durable Goods report. New orders for manufactured goods were up 16.8% compared to November 2020, but down 1.3% compared to October. Manufacturing ex-transportation new orders were up 16.3% compared to November 2020, but down 2.7% compared to October.


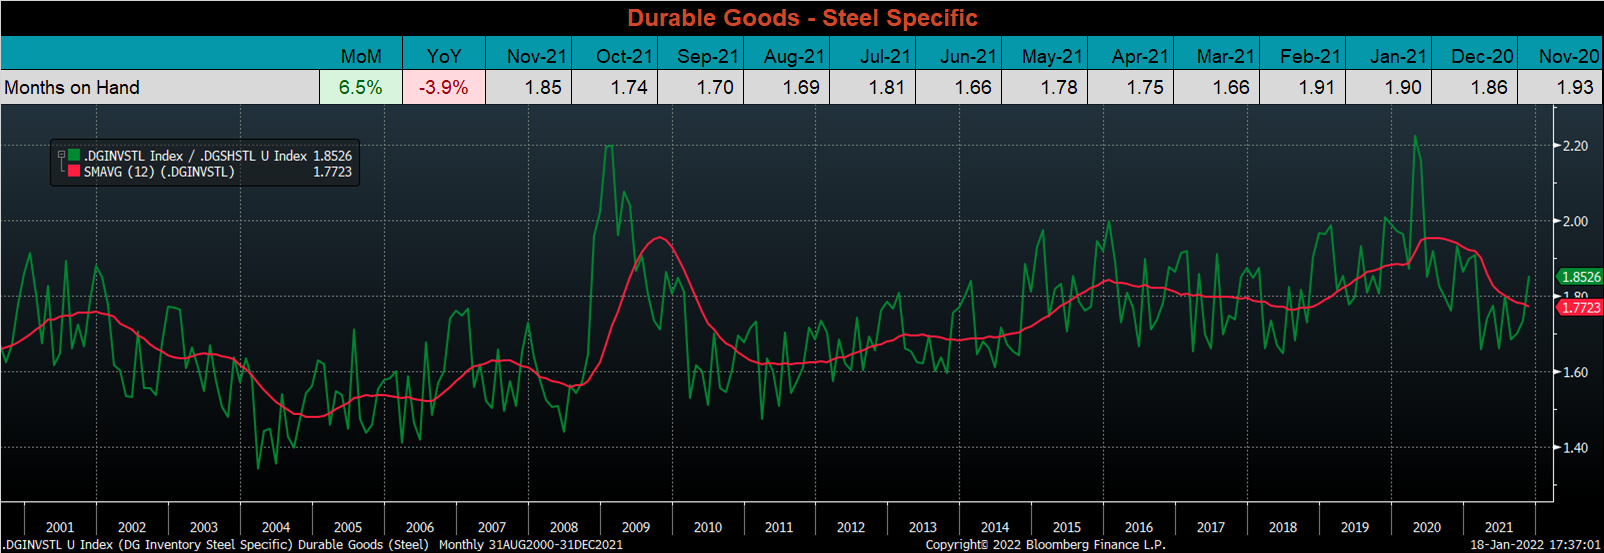
The chart looks at the months on hand (inventory divided by shipments) for durable goods categories that are steel intensive. Since December 2020, inventories for steel intensive manufactured goods have steadily grown, while shipments have dipped in the last three months. This caused MOH to increase in November and continue its 4-month trend higher, while the 12-month moving average leveled off. November’s reading, while lagged, is in line with healthy economic activity within the manufacturing sector.

Below are the most pertinent upside and downside price risks:
Upside Risks:
Downside Risks:

The Platts TSI Daily Midwest HRC Index decreased by another $80 to $1,400.

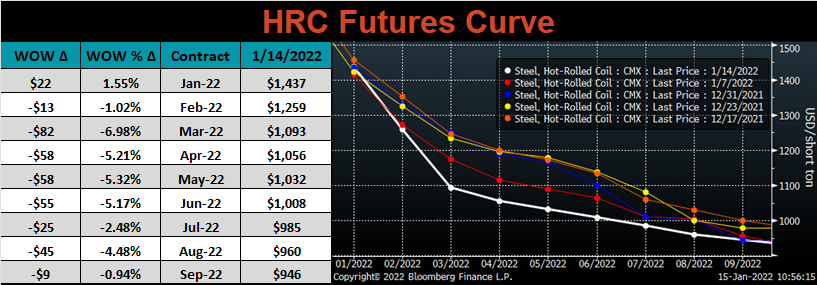
The CME Midwest HRC futures curve is below with last Friday’s settlements in white. The front of the curve was down sharply for the second week in a row, while further out expirations were down only slightly. The overall result is the flattening of the futures curve beyond the March expiration.
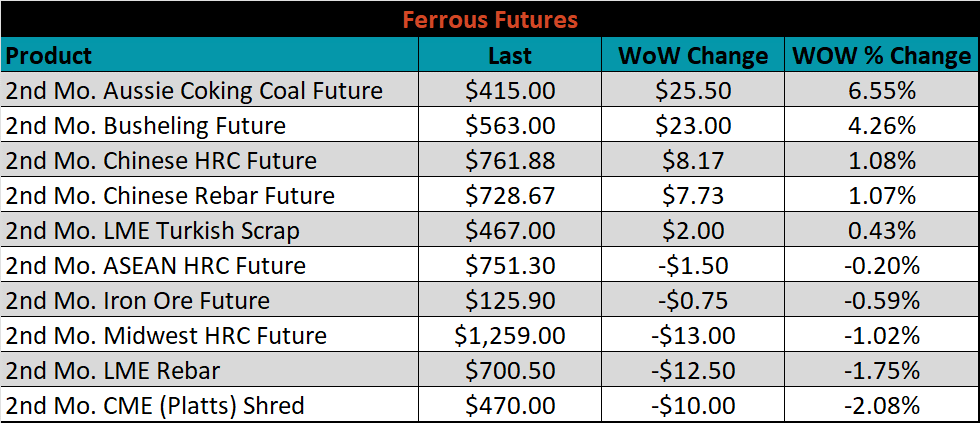
February ferrous futures were mixed. Aussie coking coal gained another 6.6%, while shredded lost another 2%.
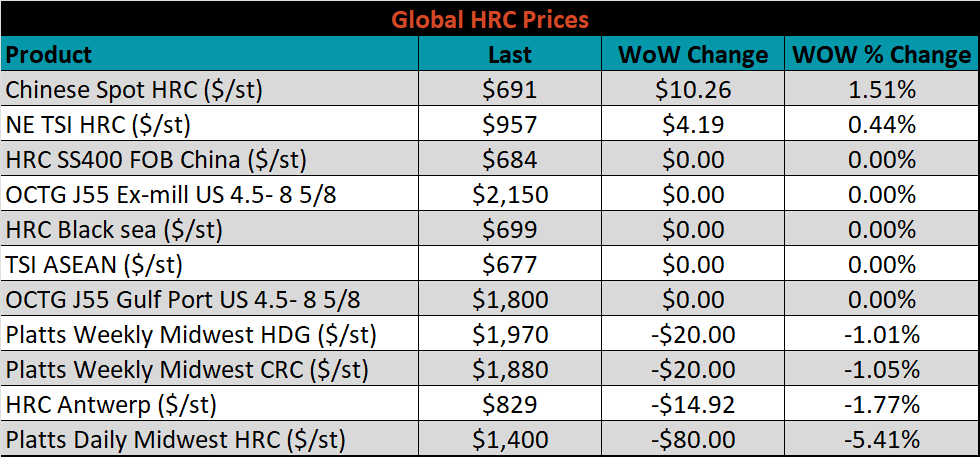
Global flat rolled indexes were mostly lower again this week, led by Midwest HRC, down 5.4%, while Chinese spot HRC was up for the second week in a row, 1.5%.
The AISI Capacity Utilization rose 1.4% to 82.3%.


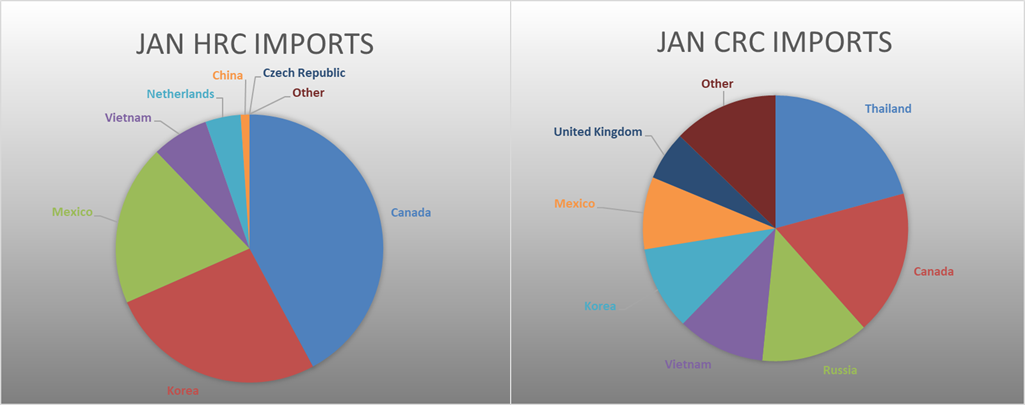
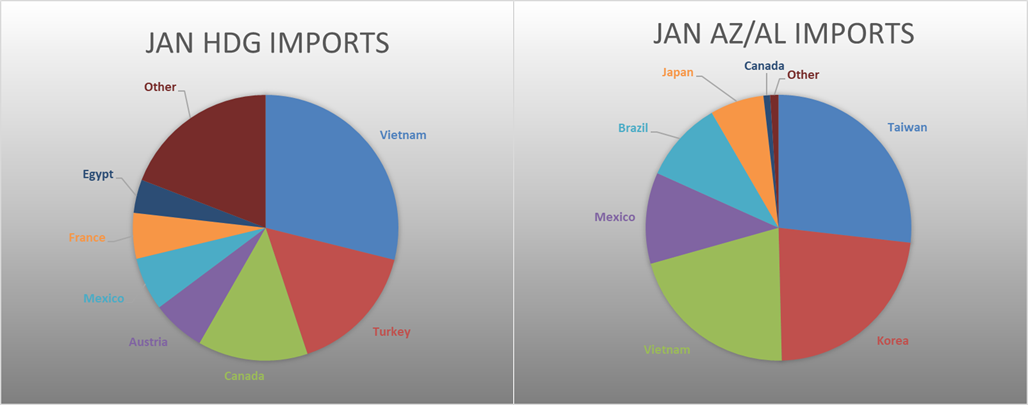
January flat rolled import license data is forecasting a decrease of 77k to 1.16M MoM.

Tube imports license data is forecasting an increase of 73k to 545k in January.


January AZ/AL import license data is forecasting a decrease of 19k to 111k.

Below is December import license data through January 10th, 2022.


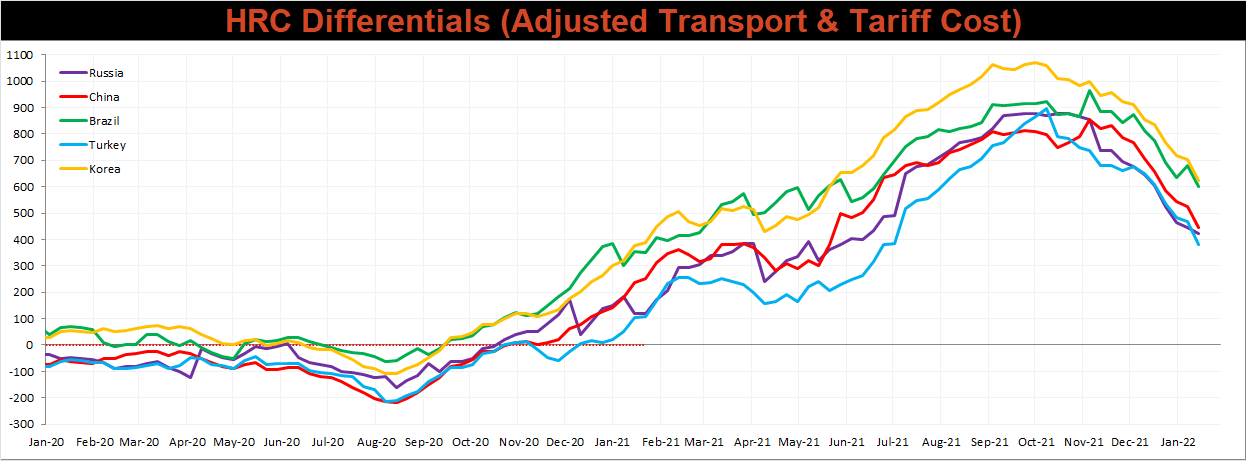
Below is the Midwest HRC price vs. each listed country’s export price using pricing from SBB Platts. We have adjusted each export price to include any tariff or transportation cost to get a comparable delivered price. All the watched countries differentials decreased this week, with China, Turkey, and Russia consolidating around a $400 differential and Brazil and Korea around a $600 differential. Although the trend is clearly lower, prices still have a long way to go to reach parity.
SBB Platt’s HRC, CRC and HDG pricing is below. The Midwest HRC, CRC & HDG prices were all lower this week, down 5.4%, 1.1% and 1%, respectively. Outside of the U.S., the Russian HRC export price was down 6.1%.


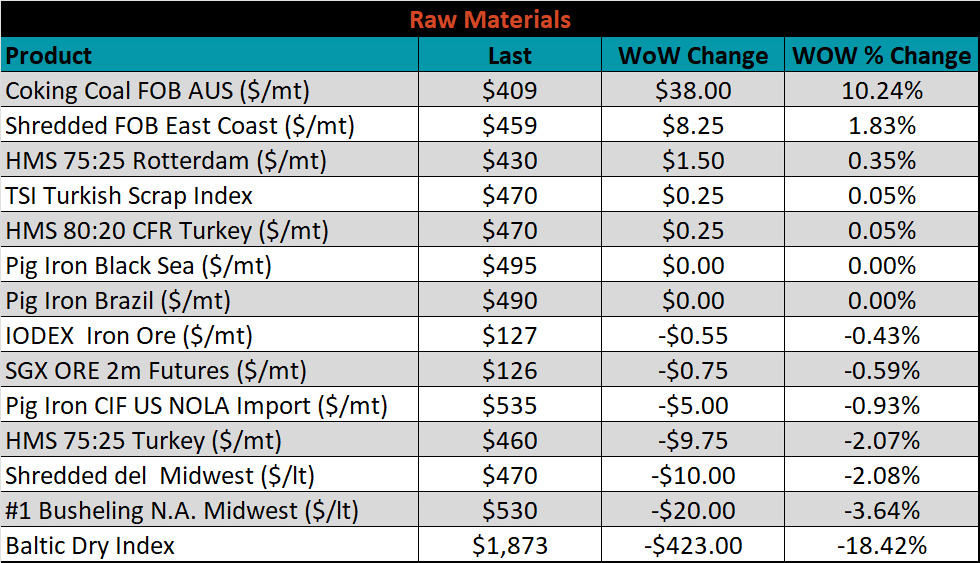
Raw material prices were mixed. Aussie coking coal was up 10.2%, while Midwest busheling was down 3.6%.
Below is the iron ore future curve with Friday’s settlements in green, and the prior week’s settlements in orange. Last week, the entire curve shifted slightly lower, more so in later expirations.

The ex-flat rolled prices are listed below.


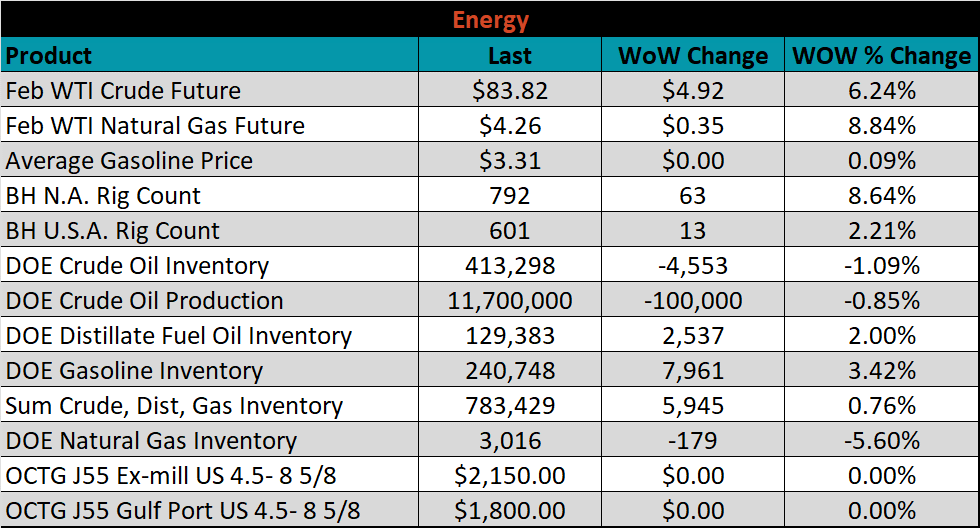
Last week, the February WTI crude oil future gained another $4.92 or 6.2% to $83.82/bbl. The aggregate inventory level was up 0.8%, while crude oil production dipped to 11.7m bbl/day. The Baker Hughes North American rig count was up by another 63 rigs, and the U.S. rig count was up 13 rigs.


The list below details some upside and downside risks relevant to the steel industry. The bolded ones are occurring or highly likely.
Upside Risks:
Downside Risks: