Content
-
Weekly Highlights
- Market Commentary
- Risks


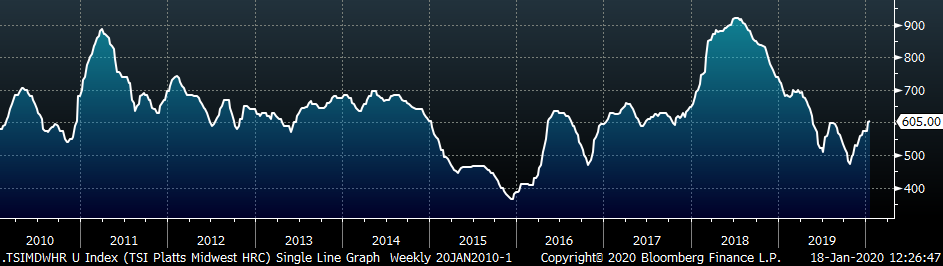
The physical HRC market continued to strengthen over the last week as mills maintained their offers in the $600-$640 range, with most mills moving to the higher end of the range. The daily TSI Platts Midwest HRC Index reflected this, and moved up $5 on the week. With the spot market continuing to strengthen and mills holding above $600, it is curious that future curve moved lower last week by approximately $25 in Q2 beyond. To understand this move and inform our market outlook, we will look to changes in the scrap futures and inventory levels across the supply chain.
The outlook for scrap pricing, as displayed by the future curve, moved lower last week after remaining stable over the past month. The chart below shows the February LME Turkish Scrap future price over the last two months, which is more liquid than the domestic busheling or shredded scrap contract.
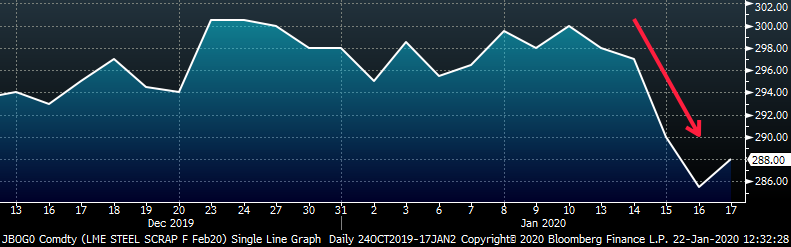
The price fell to $288/mt last week from the $300/mt level it had been sitting. Mills used increasing scrap prices as support for their recent round of price increase announcements. If scrap prices are going lower next month as the futures market expects, this may be viewed as less support for finished product pricing. There is a historic correlation between scrap and HRC pricing, signaling that weakness in scrap is likely to translate to weakness in HRC.
Another explanation for the HRC future curve shifting lower last week may be in recent activity at service centers. Full mill order books during December were driven by contract orders and service centers restocking at low prices. However, lower December shipments at service centers, due to seasonal effects around the holiday, means they went into January with sufficient inventory. End users continue to only buy material when they need it, allowing service centers to draw from inventory to fill orders rather than going to the mills with new orders. With fewer orders going to mills from service centers, lead times could compress and pressure elevated prices, which is what the future curve is expecting. For prices to move higher from here, restocking must also occur further down the supply chain at the end user, on the back of increasing demand for their products.
Below are the most pertinent upside and downside price risks:
Upside Risks:
Downside Risks:
The Platts TSI Daily Midwest HRC Index was up $5 to $605.
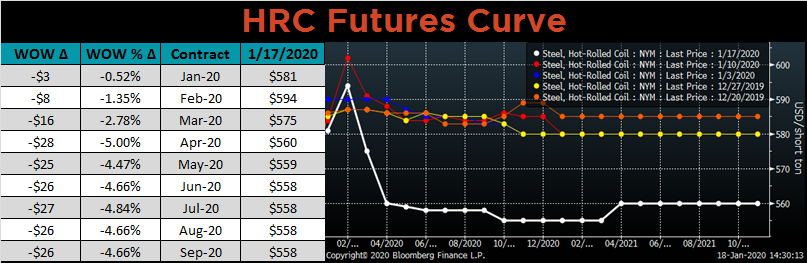
The CME Midwest HRC futures curve is below with last Friday’s settlements in white. The entire curve shifted lower, most significantly in 2Q20 and beyond.
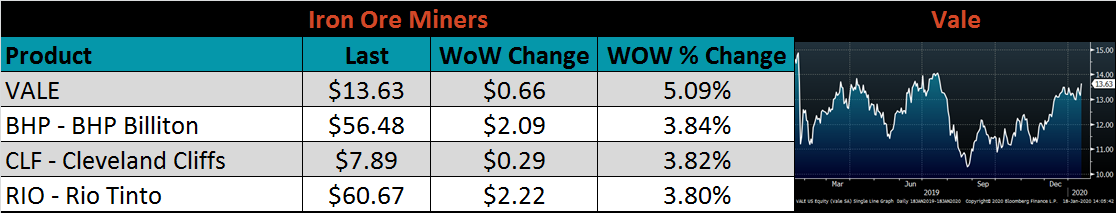
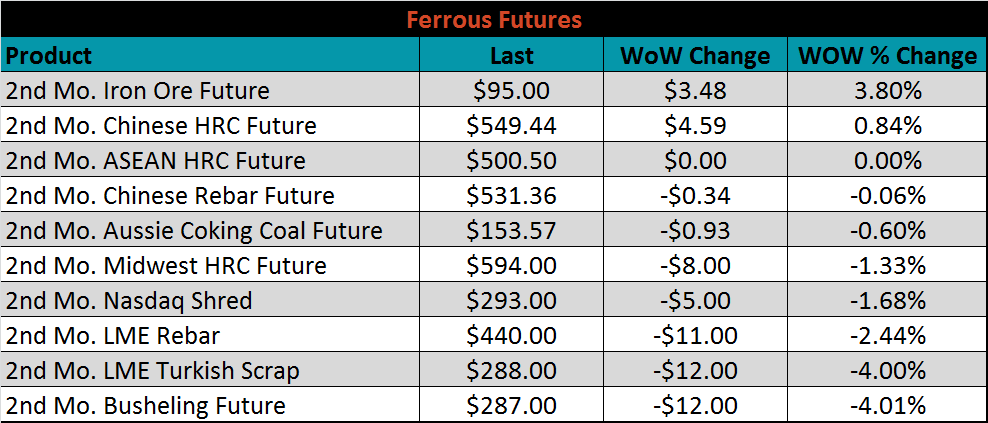
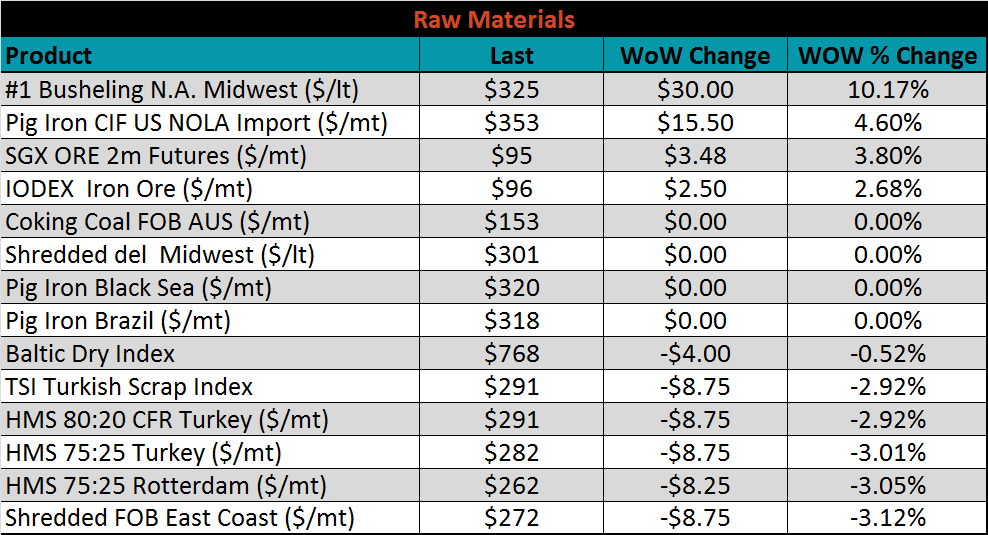
March ferrous futures were mixed. The busheling and turkish scrap futures each lost 4%, while the iron ore future gained 3.8%.
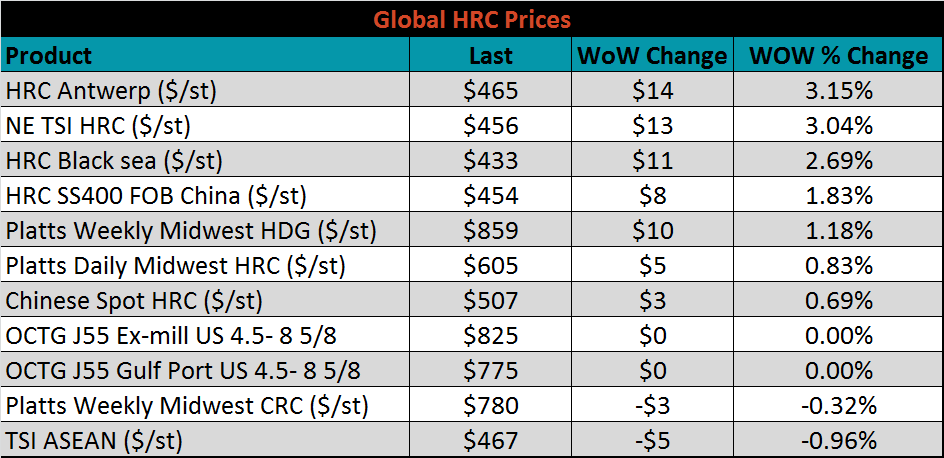
The global flat rolled indexes were mostly higher, led by TSI Antwerp HRC, up 3.2%, while TSI Asean was down 1%.
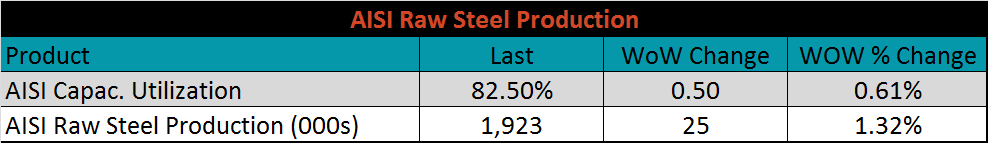
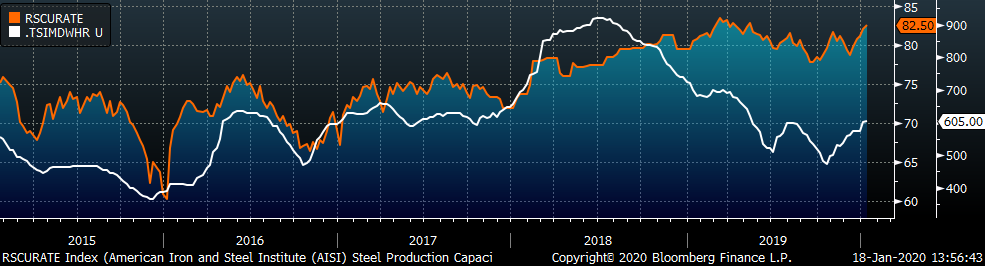
The AISI Capacity Utilization Rate was up 0.5% to 82.5%.
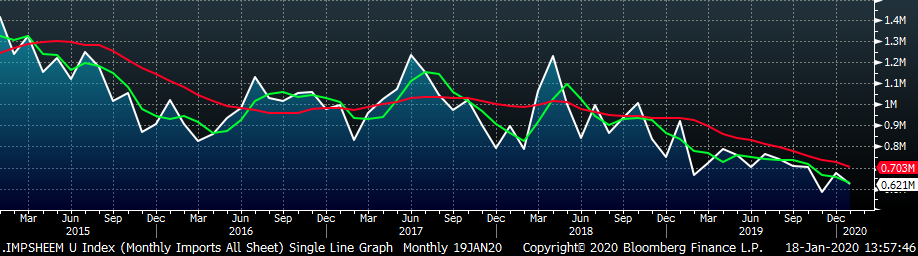
January flat rolled import license data is forecasting a decrease of 53k to 620k MoM.
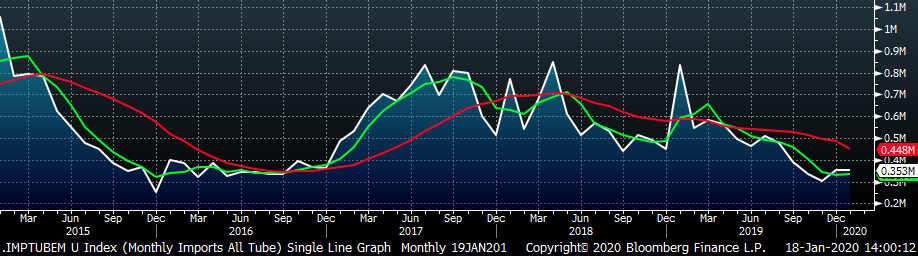
Tube imports license data is forecasting a MoM decrease of 3k to 353k tons in January.
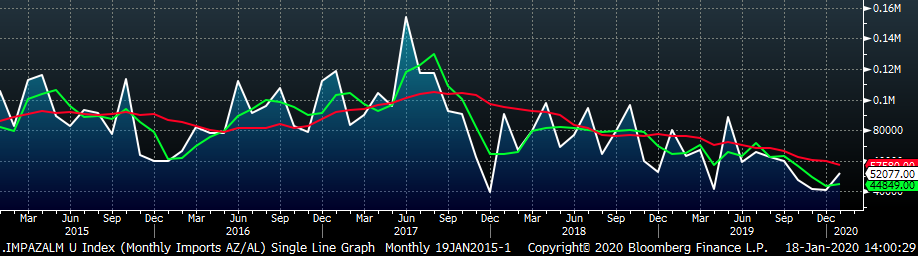
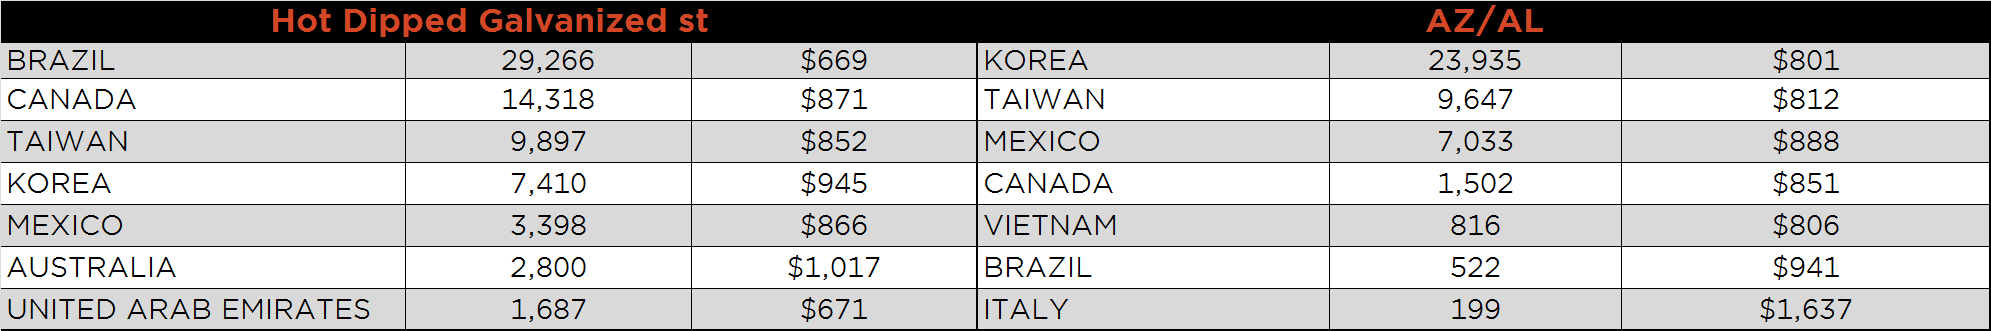
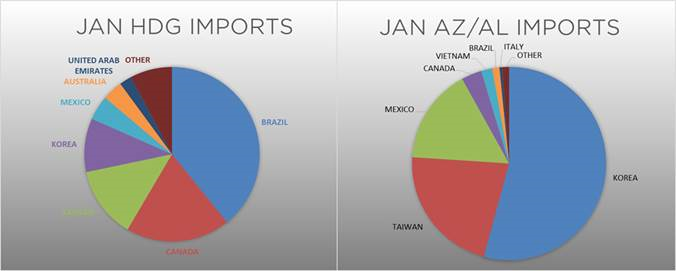
AZ/AL import license data is forecasting an increase of 11k in January to 52k.
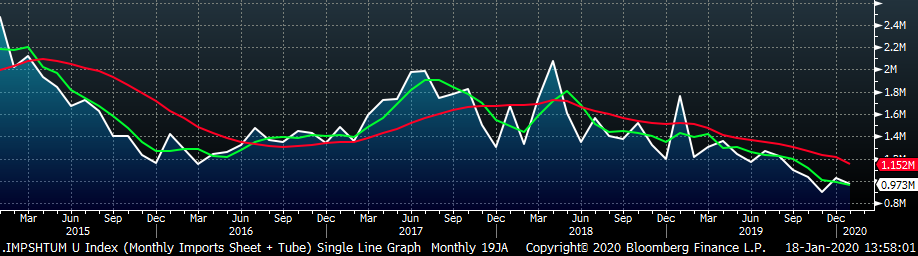
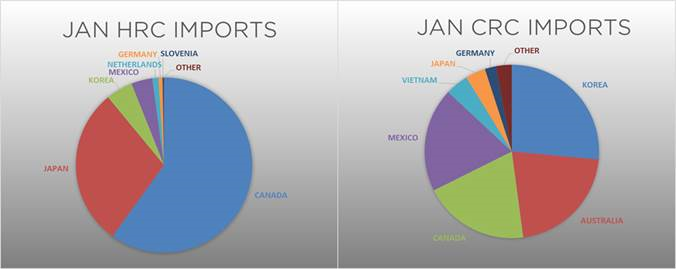
Below is January import license data through January 14, 2020.
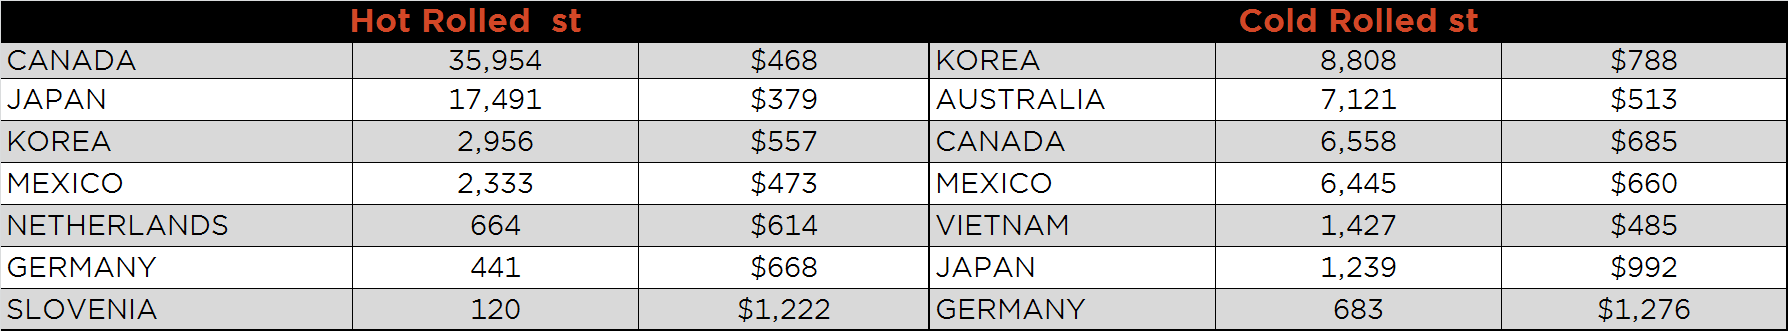
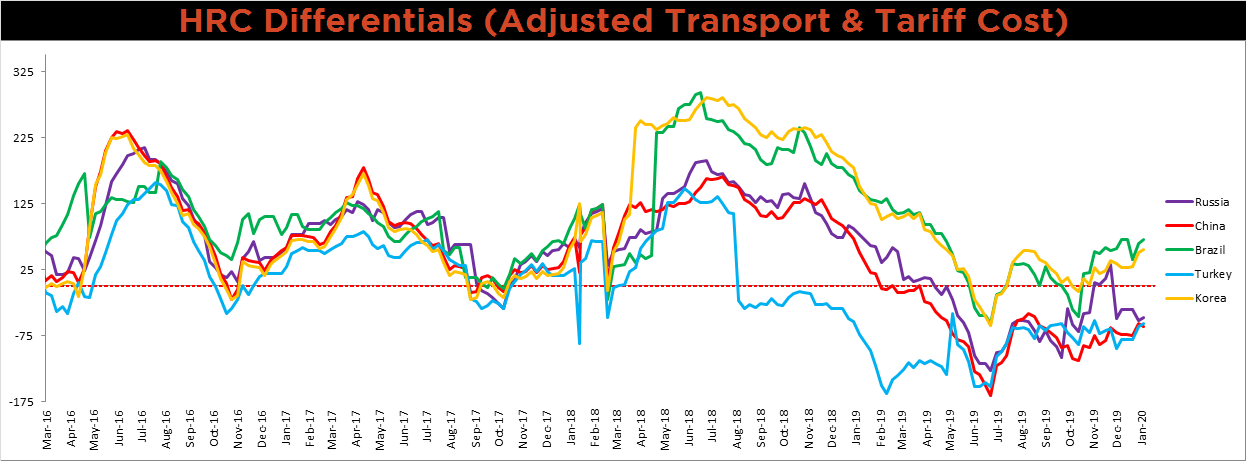
Below is the Midwest HRC price vs. each listed country’s export price using pricing from SBB Platts. We have adjusted each export price to include any tariff or transportation cost to get a comparable delivered price. The Brazilian, Korean, Turkish and Russian price differentials increased, while the Chinese price differential decreased.
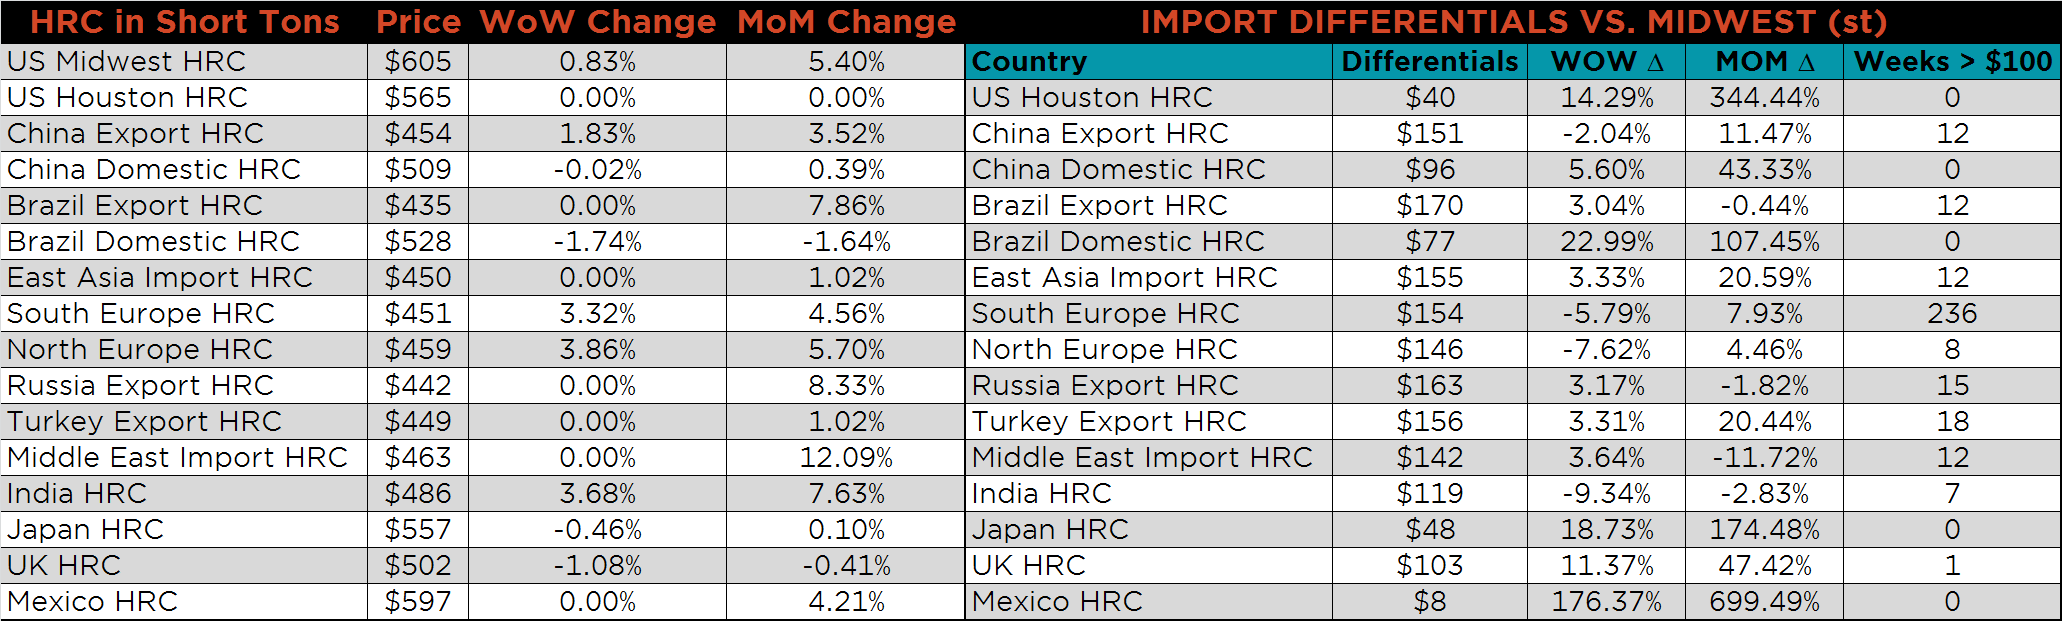
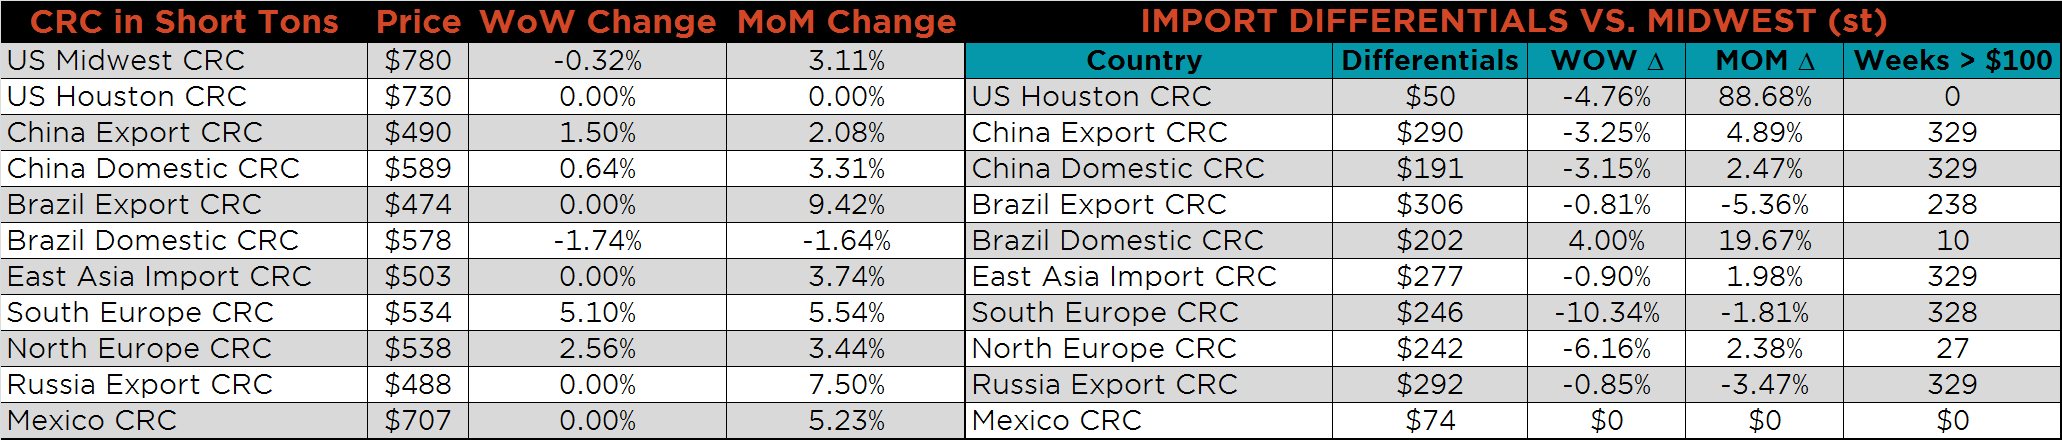
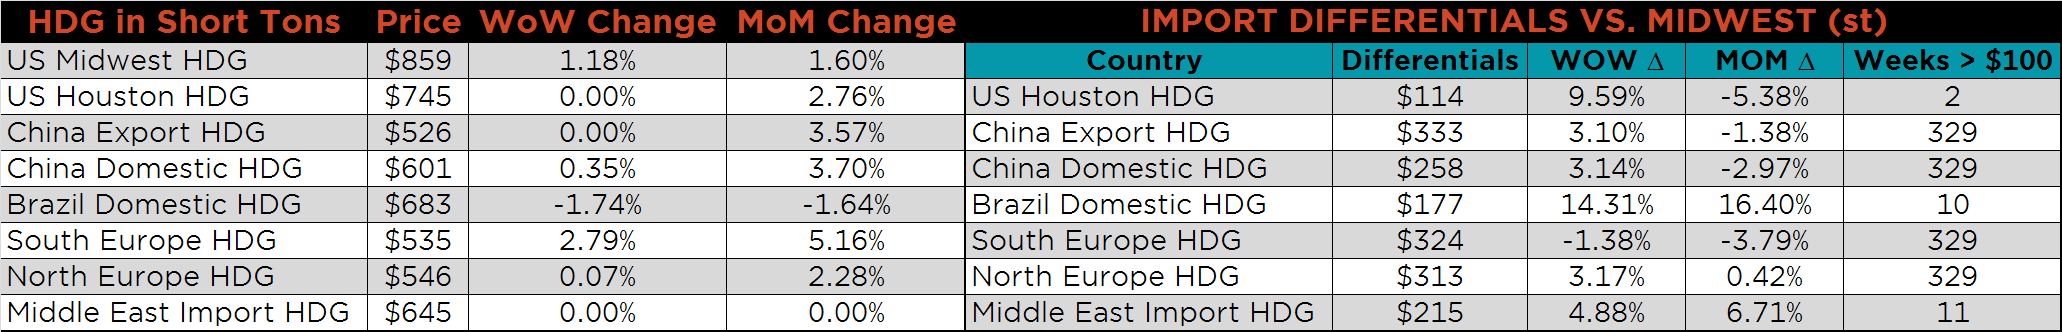
SBB Platt’s HRC, CRC and HDG pricing is below. The Midwest HDG and HRC prices were up, 1.2% and 0.8%, respectively, while the CRC price was down 0.3%. Globally, the Chinese HRC and CRC export prices were up, 1.8% and 1.5%, respectively.
Raw material prices were mixed. Busheling was up 10.2%, as expected with scrap moving up $30 in January. Recently, the HRC price increases have been driven by scrap prices.
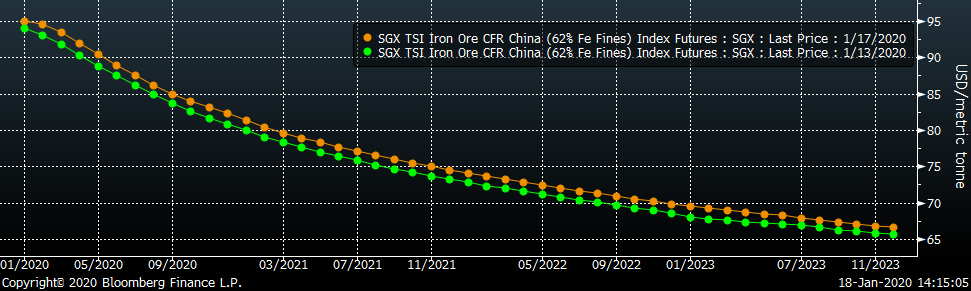
Below is the iron ore future curve with Friday’s settlments in orange, and the prior week’s settlements in green. The entire curve shifted lower.
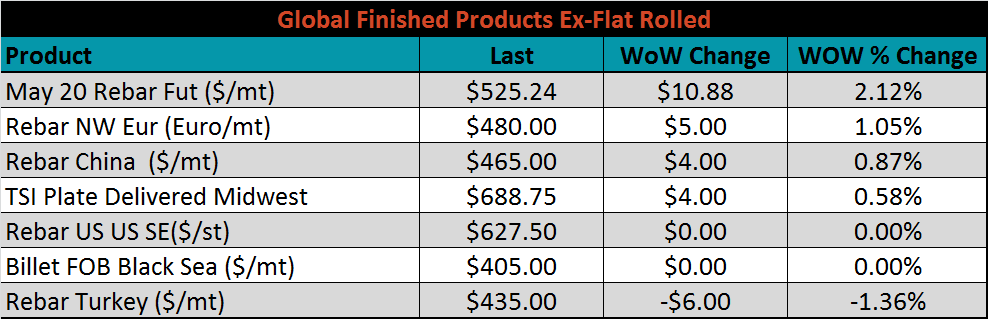
The ex-flat rolled prices are listed below.

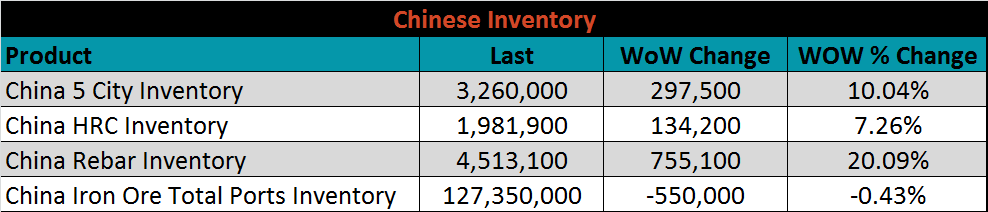
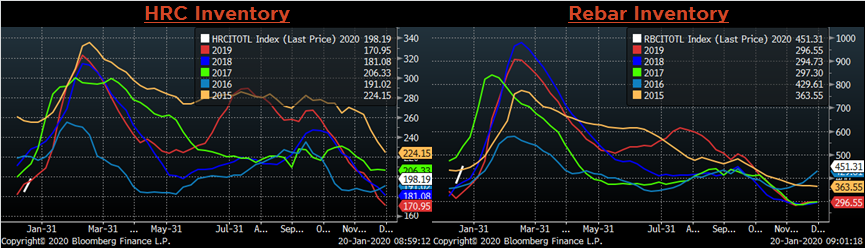
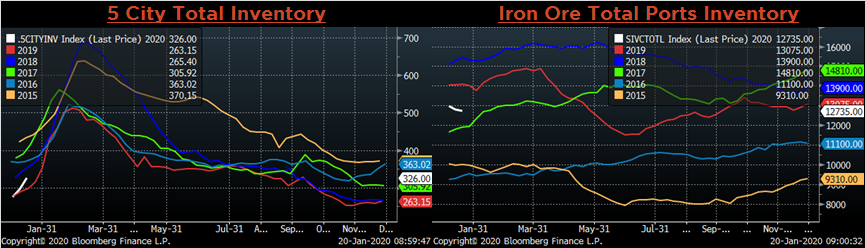
Below are inventory levels for Chinese finished steel products and iron ore. HRC, Rebar and 5-City inventory levels all increased significantly, while the iron ore ports inventory decreased slightly, 0.4%. Historically, inventories build in the first quarter, and with strengthening prices recently, inventories appear to be building at a faster rate.
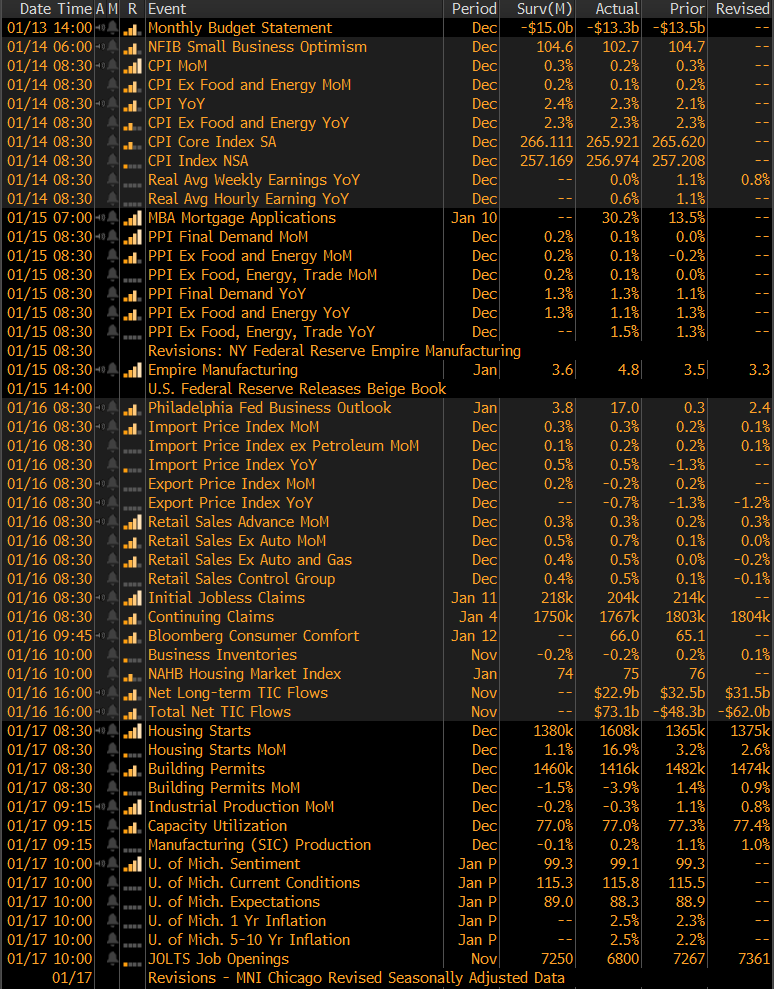
The remaining significant economic data is below. December CPI came in below expectations but increased MoM. The January Empire Manufacturing Index released by the New York FED printed 4.8, above expectations and December’s print of 3.5. Additionally, the January Philadelphia FED Business Outlook print significantly higher than expectations of 3.8, up to 17, compared to December’s print of 0.3. It will be important to see trends like this continue throughout the manufacturing and construction sectors for the current HRC price to move higher.
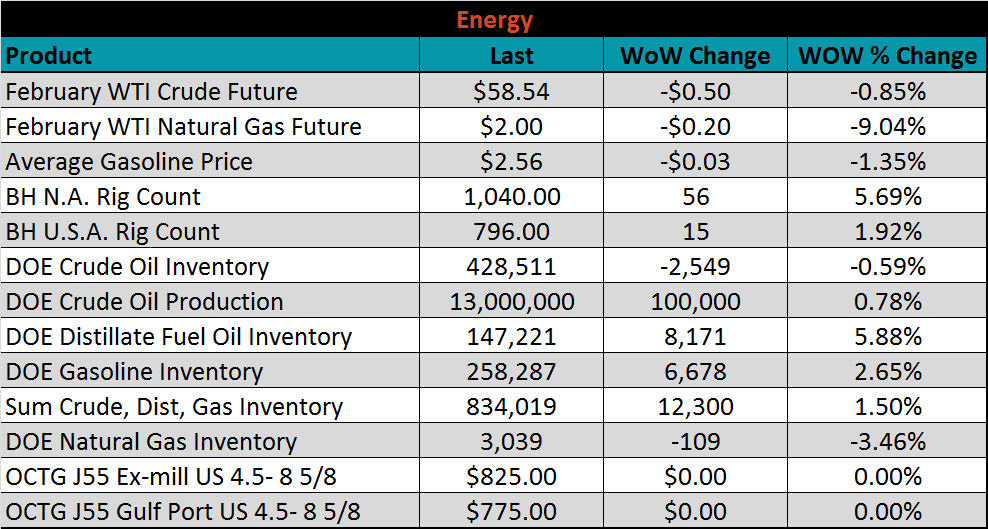
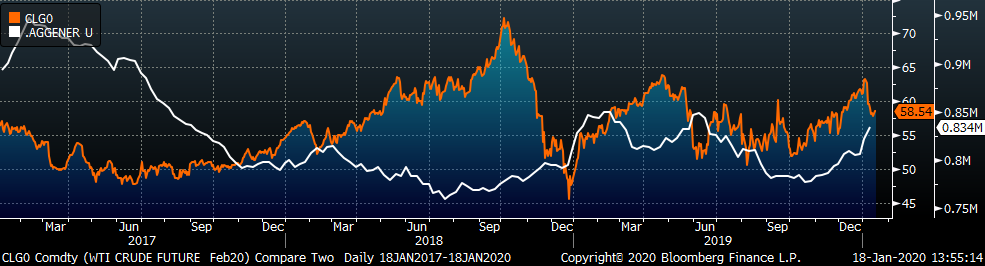
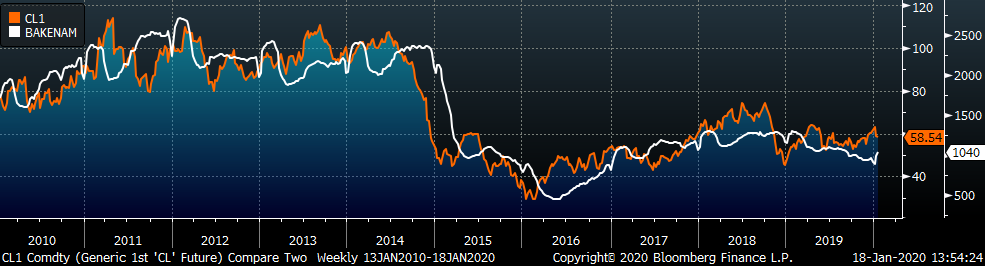
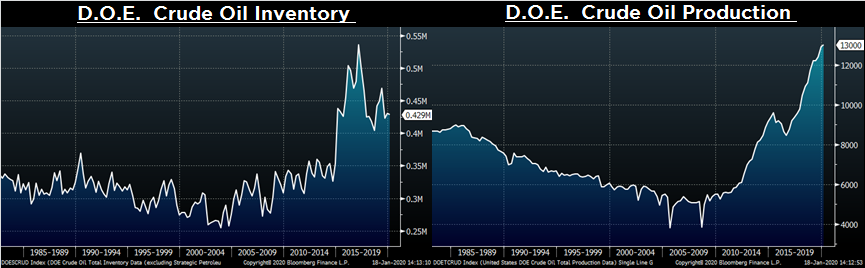
Last week, the February WTI crude oil future lost $0.50 or 0.9% to $58.54/bbl. The aggregate inventory level was up another 1.5% and crude oil production rose to 13m bbl/day. The North American rig count saw another significant gain last week, likely due to higher prices from the tensions in the Middle East two weeks ago.
The list below details some upside and downside risks relevant to the steel industry. The orange ones are occurring or look to be highly likely. The upside risks look to be in control.
Upside Risks:
Downside Risks: