Content
-
Weekly Highlights
- Market Commentary
- Risks


While the spot market took a breather this week with prices sticking near $1,100/st for much of the past two weeks, there was significant volatility in the futures market that has spurred questions about the sustainability of the price rally. Before we dive into the dynamics driving the paper market, a few notes on the physical spot market. With lead times still extended, mills have held off on opening April order books until they understand how much availability they will have after accepting contract orders. With the market still short material and pent up demand growing, we believe limited April tons will sell out rapidly, and at prices north of $1,200 for HRC. With strength apparently growing in the physical spot market, it is curious to see the forward curve move lower, increasing the backwardation (or downward slope). This week we will discuss the drivers of this dislocation, and strategies to take advantage of this opportunity.
The below excerpt is from Steel Dynamic’s fourth quarter earnings call this week, where CEO Mark Millett responds to a question about the forward curve trading over $350/st below the spot market only 6 months out:
“…this isn’t just supply side tightness – demand, the markets are incredibly strong and robust right now….So I don’t see where the pressure comes off the accelerator to drop 370 bucks here in the next whatever it is 6 months…we certainly don’t see it within the fundamental drivers of the marketplace.”
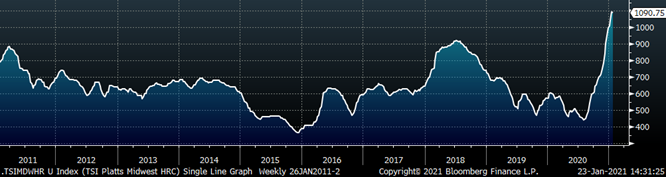
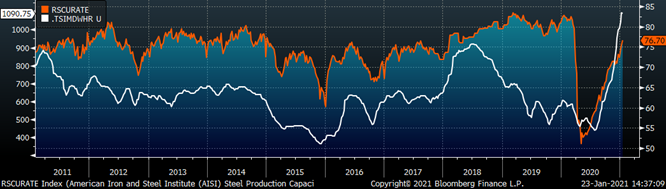
The below report highlights the strength in these “fundamental drivers”, while this chart shows the seemingly untethered future market movements over the past few days, cumulating in a significant selloff yesterday:
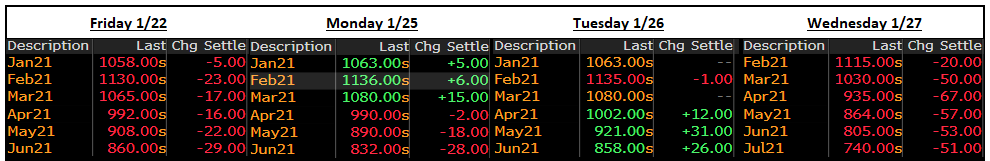
To understand how the curve can react so differently than the spot market, we must understand what the curve represents. The contracts that trade along the curve are an agreement to buy or sell HRC at a specific price, at a date in the future. As in any market, if there are more buyers compared to sellers, the price will go up and vice versa. So yesterday’s sell-off along the curve represents more participants wanting to sell compared to the number of buyers, bringing us to a pivotal question – Who would be willing to sell below the spot price?
Often, physical market participants sell futures to protect the value of their inventory. However, inventory levels are so low throughout the market, that there is not much volume left to hedge. Additionally, mills will sell along the curve to lock in prices for their order books. However, with lead times out into the second quarter, mills would rather sell at spot prices near $1,200 compared to the April future at $935. Finally, importers will sell futures against incoming material to lock in a profit, but current import offers are significantly higher than the prices on the curve, eliminating this carry trade opportunity. Therefore, it is likely that recent sellers are not physical market participants, but rather speculators making wagers on price direction. The Commodity Futures Trading Commission (CFTC) releases future positioning data, which confirms that as of last Tuesday, speculative traders were net sellers of the HRC curve, to the tune of over 80,000 tons. Speculators in financial markets are vital to increasing liquidity and ensuring orderly trading during times of turmoil. However, speculative positions can be extremely risky, especially when the positions are devoid of any fundamental analysis (take a look at GameStop stock). We view this speculative inspired sell-off in HRC futures as a dislocation relative to the spot market, and an opportunity to buy a commodity in limited supply at a significant discount. Moreover, we currently see limited downside to buying this curve as a hedge against future purchases, if physical material becomes available. If material isn’t available, long positions on the curve with generate significant profits.
Below are the most pertinent upside and downside price risks:
Upside Risks:
Downside Risks:
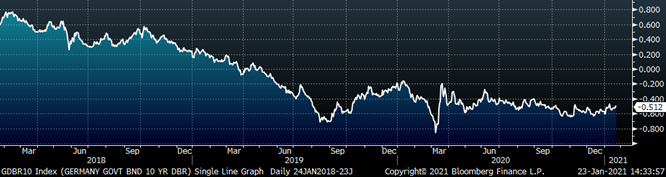
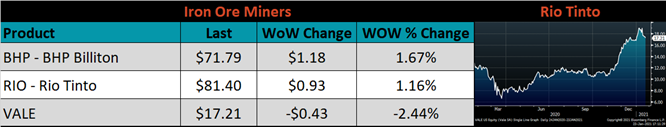
The Platts TSI Daily Midwest HRC Index decreased by $3 to $1090.75.
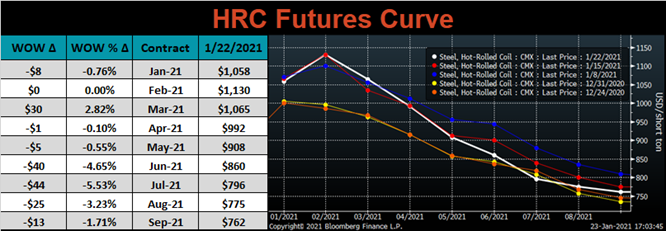
The CME Midwest HRC futures curve is below with last Friday’s settlements in white. Last week, the curve moved lower in the back, but remains strong in the front 5 months. The futures curve is pricing in a peak near $1150 in February, followed by a $390 collapse by July. On the other hand, buyers have proven a willingness to pay higher prices, if they were able to secure physical steel today. As the forward curve settles against the physical market, we believe that the curve is mispriced and undervalued.
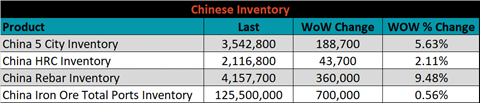
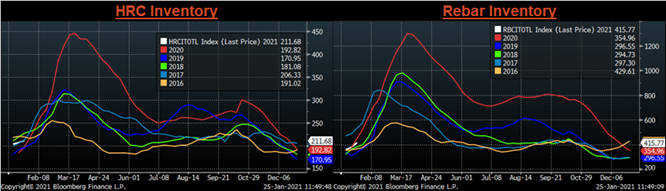
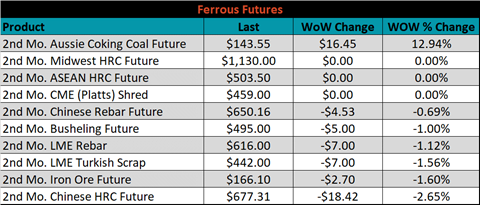
February ferrous futures were mixed. Aussie coking coal gained another 12.9%, while Chinese HRC lost 2.7%.
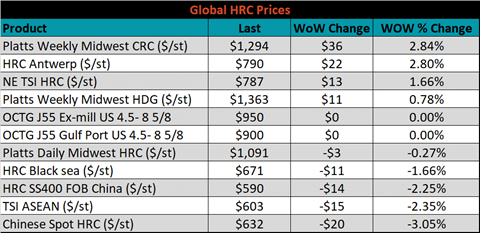
Global flat rolled indexes were mixed. Midwest CRC was up 2.8%, while Chinese spot HRC was down 3.1%.
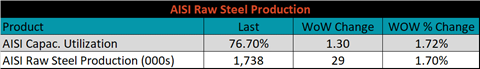
The AISI Capacity Utilization rate increased 1.3% to 76.7%.
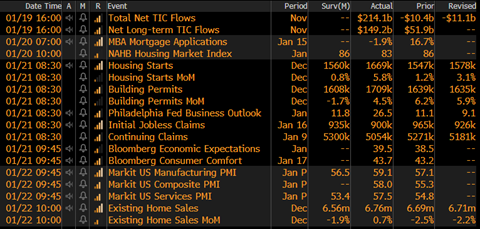
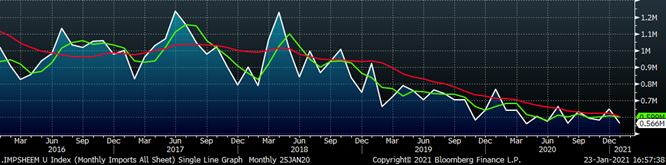
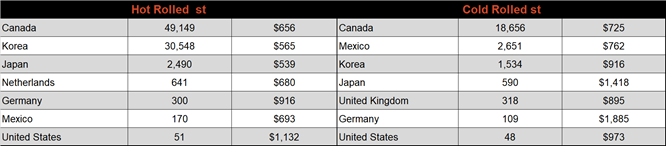
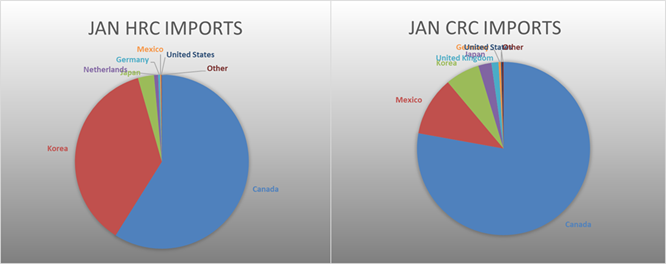
January flat rolled import license data is forecasting a decrease of 85k to 566k MoM.
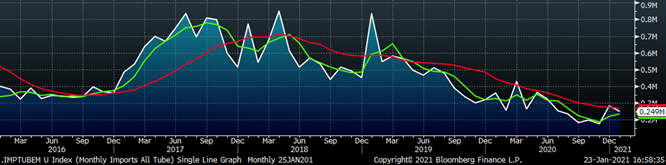
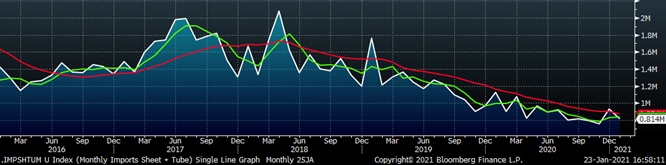
Tube imports license data is forecasting a decrease of 34k to 249k in January.
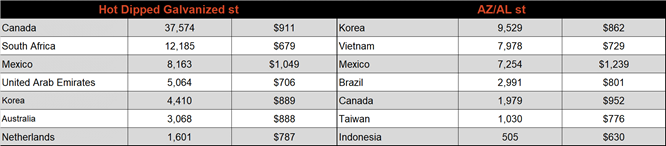
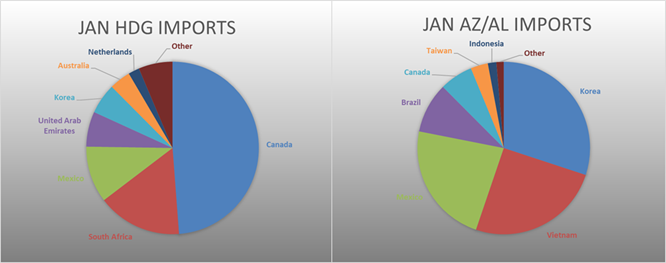
January AZ/AL import license data is forecasting a 3k decrease to 61k.
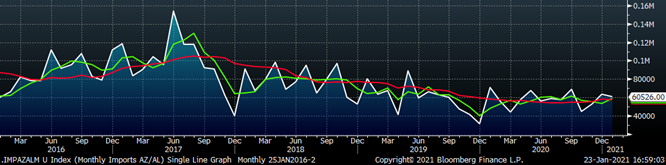
Below is January import license data through January 19, 2021.
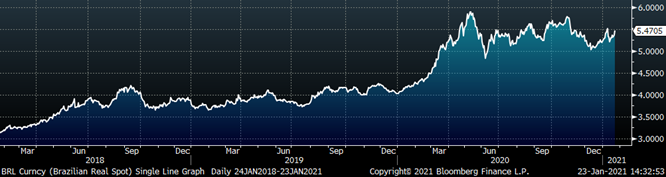
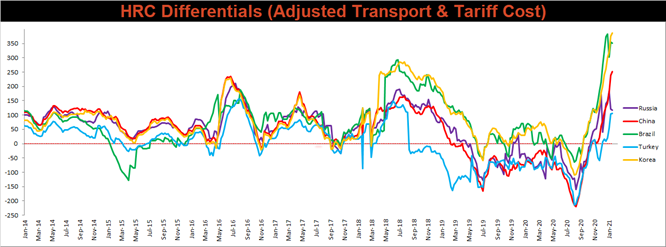
Below is the Midwest HRC price vs. each listed country’s export price using pricing from SBB Platts. We have adjusted each export price to include any tariff or transportation cost to get a comparable delivered price. The Chinese and Korean differentials moved slightly higher, while the Brazilian differential was down and the Turkish and Russian differentials were flat.
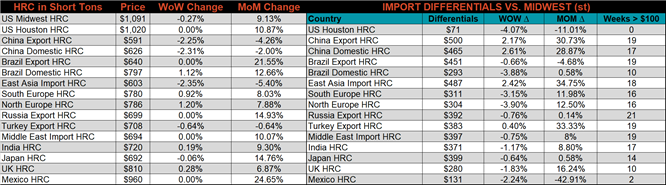
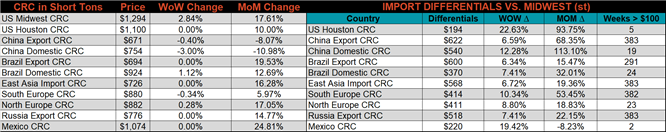
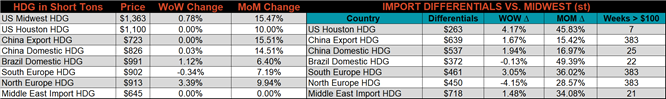
SBB Platt’s HRC, CRC and HDG pricing is below. The Midwest CRC and HDG prices were up 2.8% and 0.8%, respectively, while the HRC price was down 0.3%. Globally, the Chinese Export HRC price was down 2.3%.
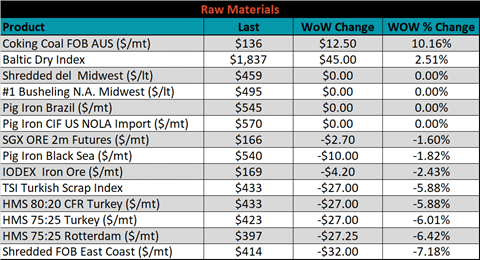
Raw material prices were mixed. Aussie coking coal was up 10.2%, while East Coast shredded was down 7.2%.
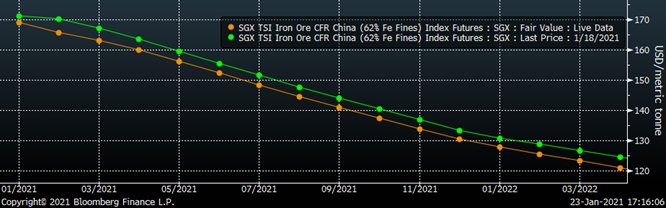
Below is the iron ore future curve with Friday’s settlements in orange, and the prior week’s settlements in green. Last week, the entire curve shifted slightly lower across all expirations.
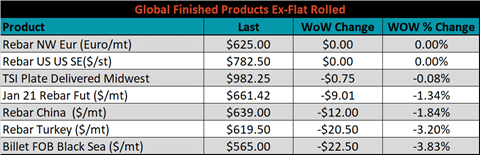
The ex-flat rolled prices are listed below.

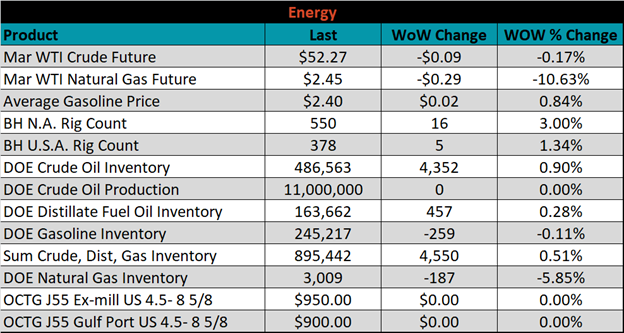
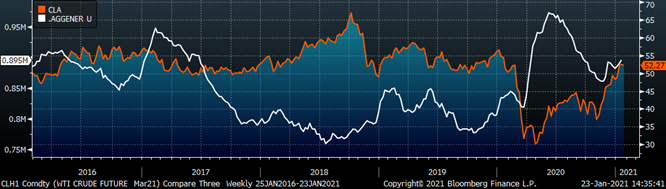
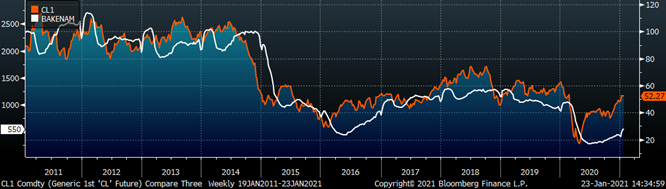
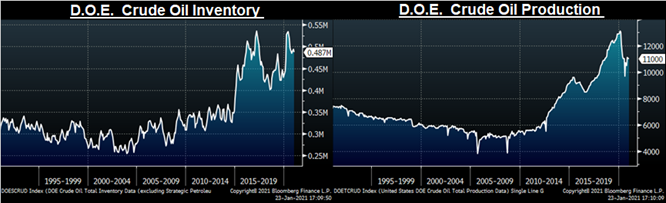
Last week, the March WTI crude oil future lost $0.09 or 0.17% to $52.27/bbl. The aggregate inventory level was up 0.5% and crude oil production remains at 11m bbl/day. The Baker Hughes North American rig count was up by another 16 rigs, and the U.S. rig count was up 5 rigs.
The list below details some upside and downside risks relevant to the steel industry. The orange ones are occurring or look to be highly likely. The upside risks look to be in control.
Upside Risks:
Downside Risks: