Content
-
Weekly Highlights
- Market Commentary
- Upside & Downside Risks


Looking ahead to next week’s beginning of the month economic data release, all eyes will be watching what the data tell us about demand, given that domestic steel prices have been rallying since early December. Including the Dallas manufacturing survey, which was released on Monday January 30, 2023, the 5 Regional Fed surveys (below) always provide insight into what to expect going forward.
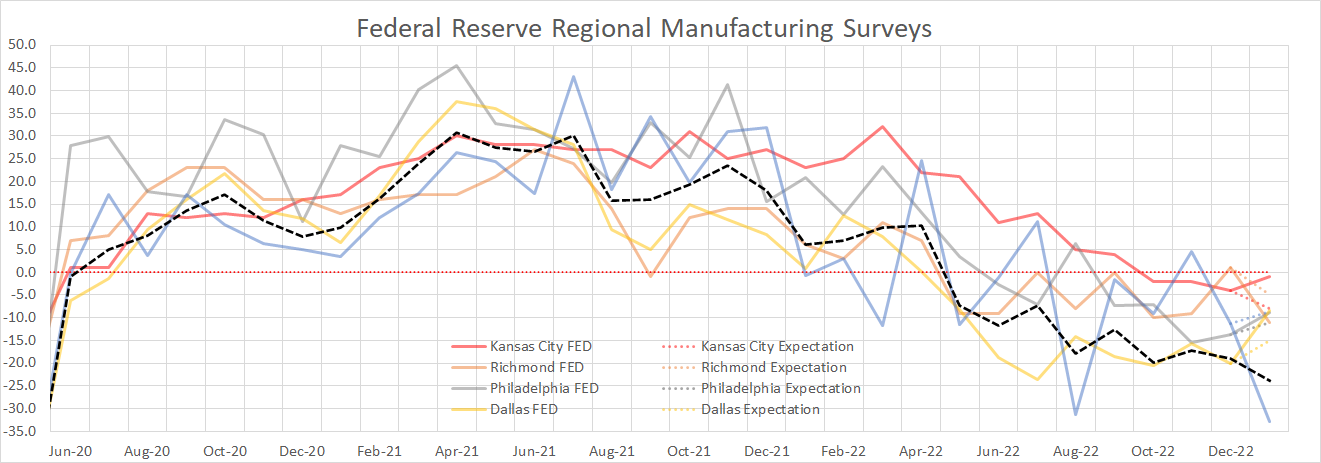
To simplify the interpretation, we’ve consolidated all of the readings into the black dashed line. This shows that after November’s slight improvement, December decreased, and January data which was mostly below expectations (corresponding dotted lines) resulted in the deepest monthly contraction since the pandemic. What this tells us is that activity in the manufacturing sector continues to stumble as we start 2023. Looking more closely at the subindex break down, this move lower has been driven by depressed new orders, and backlogs, both under pressure since August. Over the next 6-months, our view is that the Federal reserve and rate decisions will be the most important factor for steel consumption and the domestic economy as a whole. To that, Friday provided further data which suggest we are approaching the peak terminal rate for the FED with PCE Core inflation decelerating further, now for the 3rd month in a row. While downside risks remain, a continued, steady decline in inflation and a softening labor market, much like we have recently observed, provides a path for a slowdown without a collapse in demand. If this materializes, the reduced levels of domestic production and depressed import volumes could support elevated steel prices.

Upside Risks:
Downside Risks:

The Platts TSI Daily Midwest HRC Index was up another $40 this week, ending at $780.

The CME Midwest HRC futures curve is below, with last Friday’s settlements in white. The front of the curve was higher, while the back fell. This movement resulted in a flat curve from April 2023 onward.

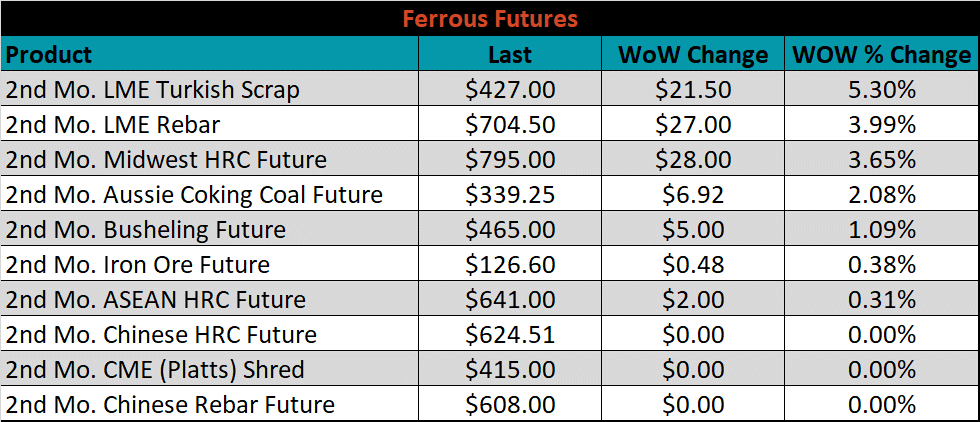
The 2nd month ferrous futures were all higher this week, led by Turkish Scrap which gained 5.3%.
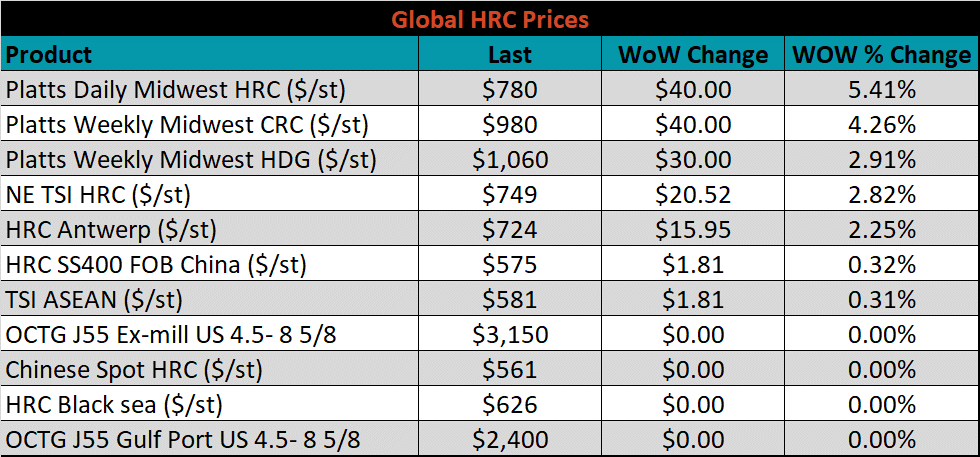
Global flat rolled indexes were all higher, led by Midwest HRC, up 5.4%.
The AISI Capacity Utilization was up another 0.8% to 72.5%. This is the second week in a row that resulted in higher capacity utilization. While 2-weeks does not mark a significant trend, it should be noted that the current momentum of increased utilization is more pronounced than in early-December when mills first started announcing price increases and capacity utilization briefly ticked higher.


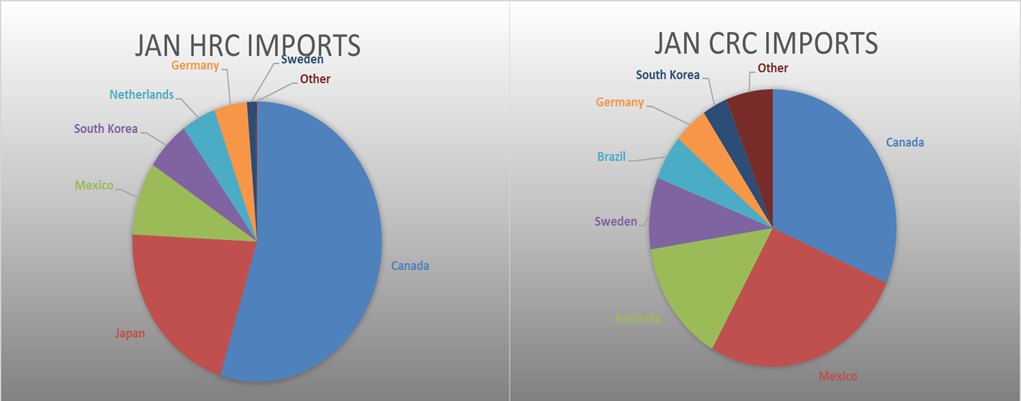
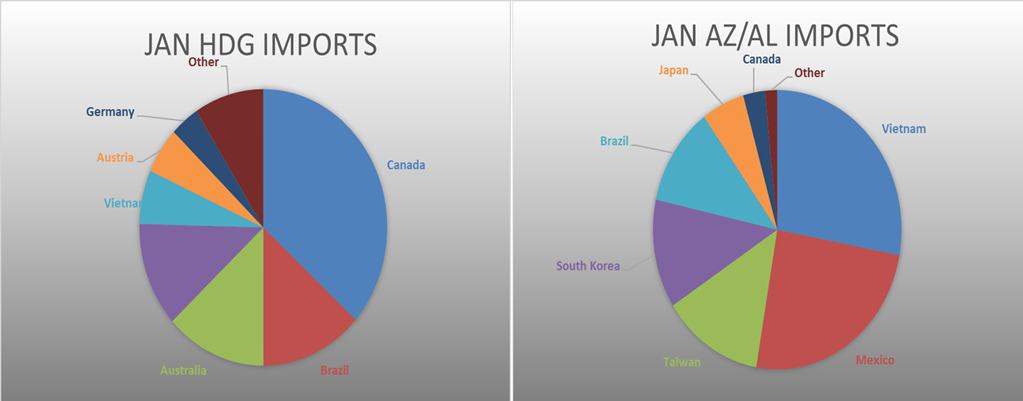
January flat rolled import license data is forecasting an increase of 26k to 769k MoM.

Tube imports license data is forecasting a decrease of 61k to 560k in January.


January AZ/AL import license data is forecasting an increase of 23k to 78k.

Below is January import license data through January 25th, 2023.


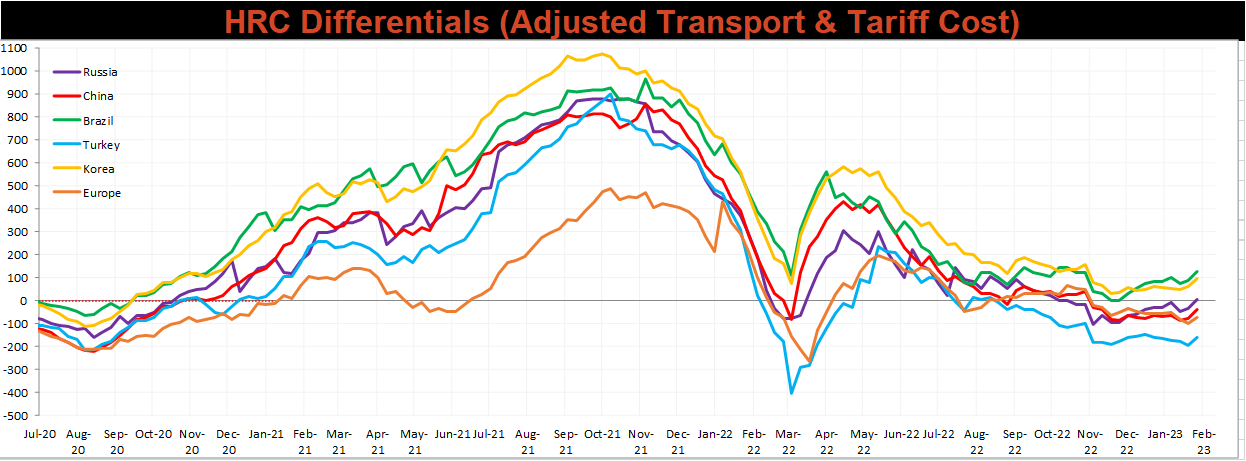
Below is the Midwest HRC price vs. each listed country’s export price using pricing from SBB Platts. We have adjusted each export price to include any tariff or transportation cost to get a comparable delivered price.
Differentials increased across the board, as the U.S. domestic price rose more significantly than any global price.
Global prices were mostly higher again this week, led by Northern European HDG, up 6.1%. Additionally, the Houston HRC price rose by 7.1% this week, confirming that rising global prices are impacting the domestic market.


Below are inventory levels for Chinese finished steel products and iron ore. Rebar, HRC, and the 5-City Inventories all saw significant seasonal restocking while iron ore ports inventory slipped further. Where the big 3 inventories end in the beginning of March will tell us a lot about anticipated demand for the rest of the year.


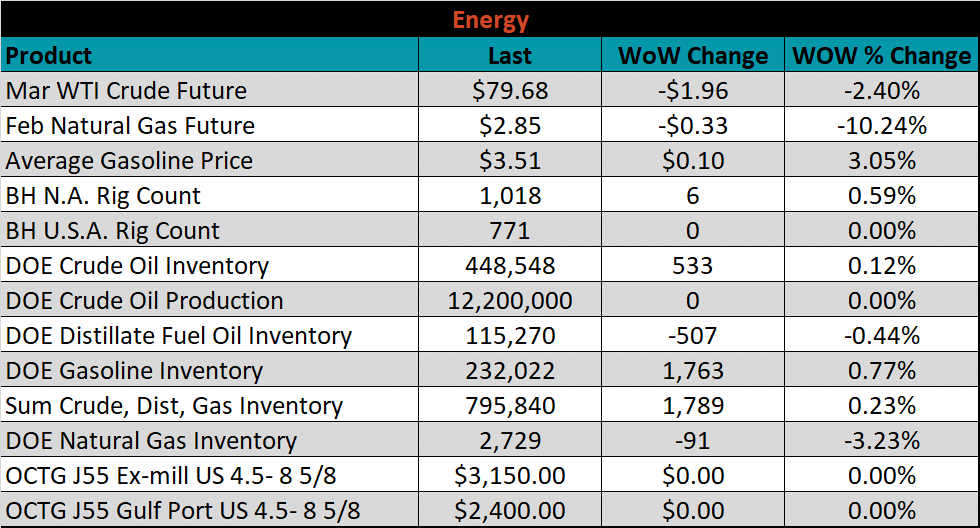
Last week, the March WTI crude oil future lost $1.96 or -2.4% to $79.68/bbl. The aggregate inventory level was up 0.2%. The Baker Hughes North American rig count was up by another 6 rigs, while the U.S. rig count was unchanged.


The list below details some upside and downside risks relevant to the steel industry. The bolded ones are occurring or highly likely.
Upside Risks: