Content
-
Weekly Highlights
- Market Commentary
- Upside & Downside Risks


Since late November, the physical steel market has been pummeled with bearish news and negative sentiment. As a result, the spot price and futures market have sold off at a remarkable pace. While assessed prices remain above support levels and downward pressure feels insurmountable, we may look back at the last week of January as when bulls saw the light at the end of the tunnel. This comes from reports around the energy sector, where a significant number of OCTG orders are coming to the mills. While this datapoint is anecdotal and difficult to quantify, historically, it has been an important leading indicator of an approaching bottom. To be clear, while these reports are welcomed signs of the strong demand outlook that we are seeing and anticipate for 2022, the current significant glut of inventory in the market will have to be worked through before the domestic price stabilizes.
In last week’s report, we highlighted the recent trend of decreasing U.S. – Global price differentials, and stability in global pricing. For longstanding readers, that chart and this relationship may feel somewhat familiar. However, when we look further out into the future, it is important to think about what has changed. The chart below shows “All Sheet” imports beginning in 2017.
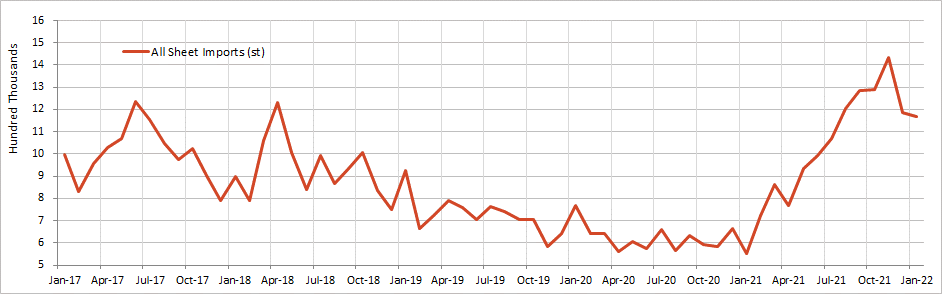
Over the last 5 years, we have experienced the most restrictive global trade environment since China was accepted into the WTO in 2001. Because of this, we have been able to answer a question that used to only be theoretical. What is the minimum number of import tons for flat rolled steel in the US market? The combination of the 2018 tariffs, pandemic caused downturn and resulting supply chain disruption provided us with a worst-case scenario for imports. The result of this combination of restrictions tested where the possible floor could be and for the majority of 2020, monthly imports were around 600k. With this answer in hand, let’s look at what this means for the future domestic market.
By the end of 2025, there will be a minimum of 8M tons of new EAF production, with more than one-third of it up and running by the end of 2022. While this information is not new, it has led many analysts to the conclusion that the U.S. domestic market is going to be vastly oversupplied by the time these furnaces are online. At first glance these are eye-popping numbers, however it is important to contextualize what this will mean for the larger market by looking at the recent trend. The chart below shows the percentage of domestic tons that come from EAFs, including expectations for the current and next 3 years shaded in grey.
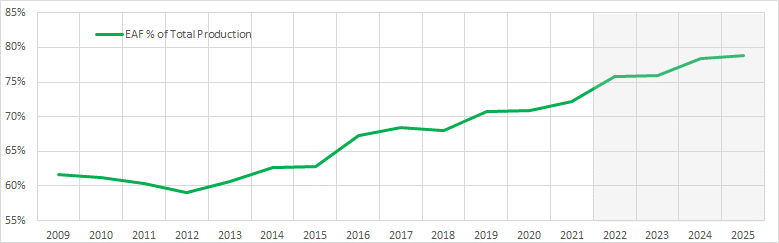
Since 2012, there has been only one year where integrated mills produced more tons than the year before, and that was 2018, when 232 became law. The point should be obvious, but anyone who thinks new EAF production is “additional tons” to market was probably asleep for the past decade. Turning back to the import market and why the last three years are so important. Now that the official census numbers for December arrivals have been published, we can compare last year to the historically low prior two years. There were 4.8 million more tons in 2021 than in 2020 and 3.6 million more tons than in 2019. If domestic prices continue to converge with global prices, which we expect this year and over the long term, the profit and incentive to import these excess tons diminishes. Therefore, of the 8 million tons of additional EAF capacity, there is likely only ~4 million additional tons of supply. Additionally, the U.S. market will likely continue to move away from BOFs, further reducing the net tons added over the next 3-5 years. As the U.S. economy grows and demand for steel continues to expand, models for HRC prices in the future is predicting a price collapse based on an excess of upcoming production are off base. For steel buyers, it is important to recognize all the ways in which the steel market has fundamentally changed because of the last 2 years. If you are following guidance that has not been updated to do the same, you are susceptible to unnecessary risk.
Below are the most pertinent upside and downside price risks:
Upside Risks:
Downside Risks:
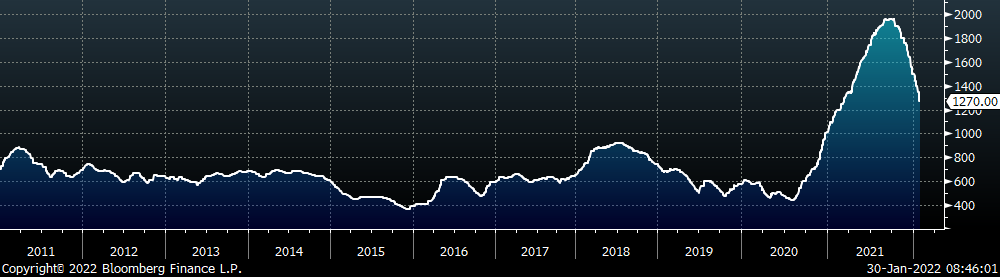
The Platts TSI Daily Midwest HRC Index decreased by another $80 to $1,270.
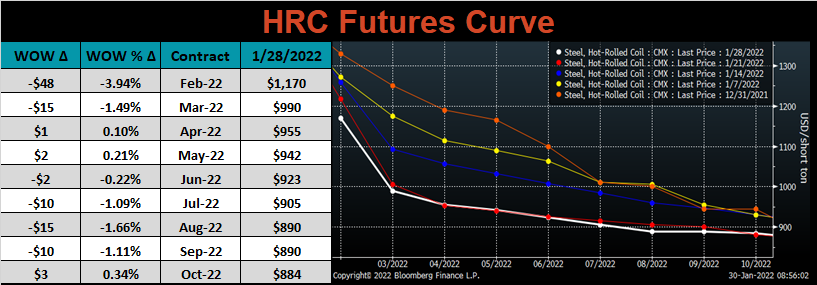
The CME Midwest HRC futures curve is below with last Friday’s settlements in white. The front month expiration (February) was down ~$50, while the rest of the curve was largely unchanged.
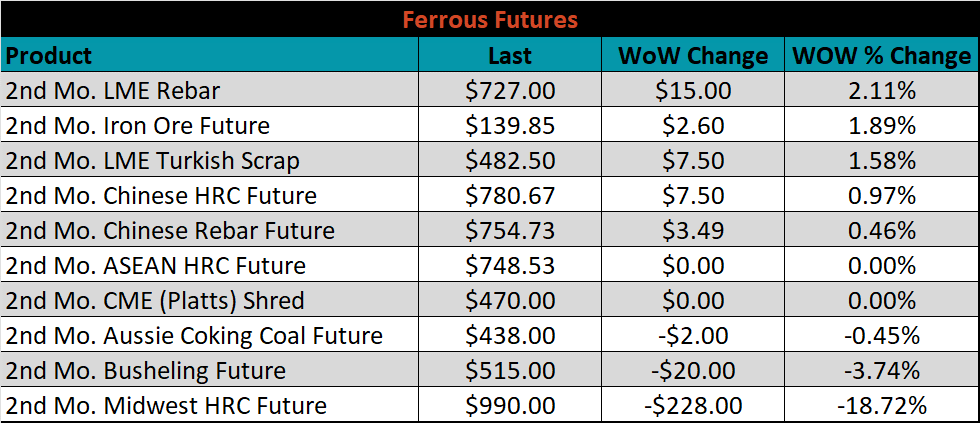
March ferrous futures were mixed. Busheling lost another 3.7%, while LME Rebar gained 2.1%. The significant drop in Midwest HRC was primarily because the 2nd month switched from February to March. The March Midwest HRC future was down 1.5%.
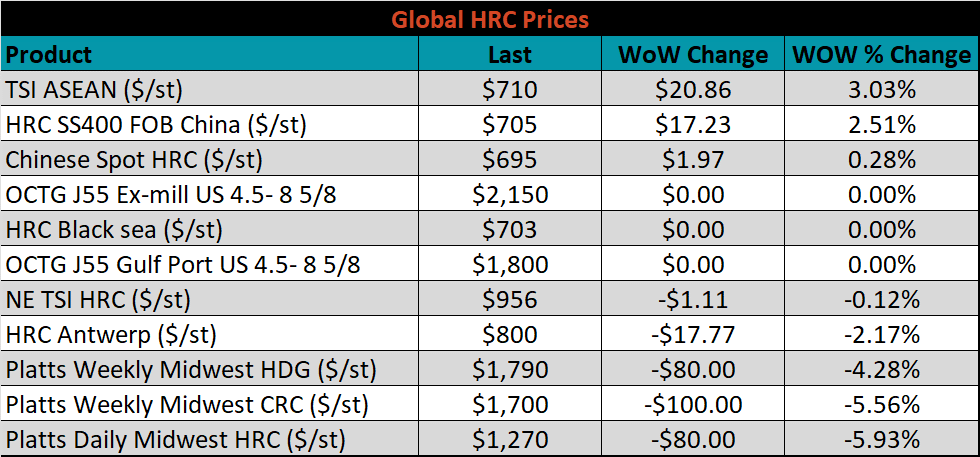
Global flat rolled indexes were lower, except for the Southeast Asian region, with TSI ASEAN up another 3%.
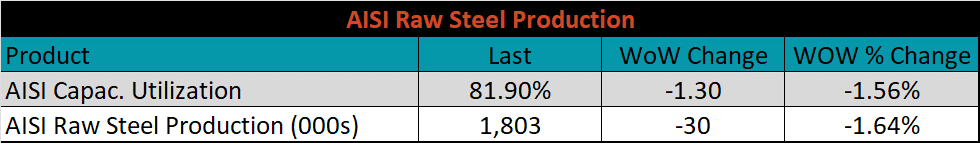
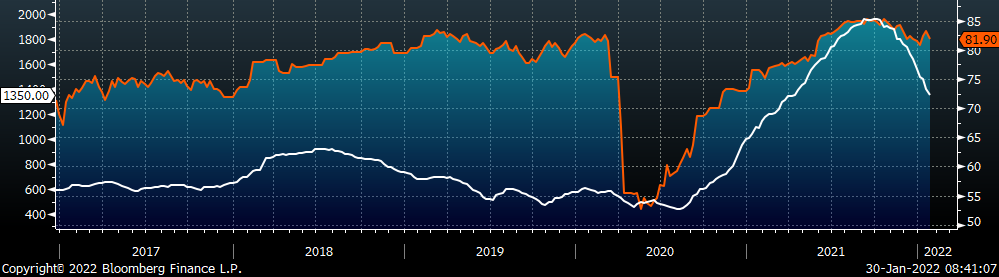
The AISI Capacity Utilization was down 1.3% to 81.9%.
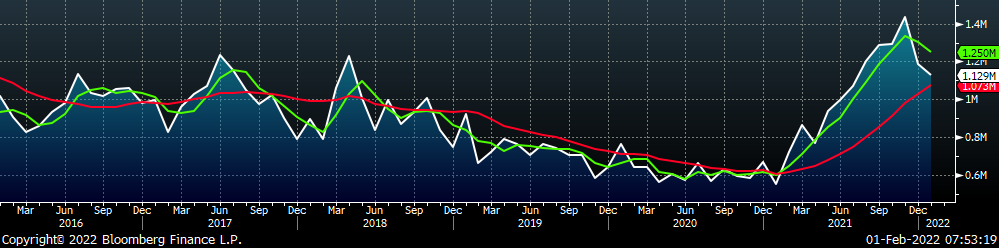
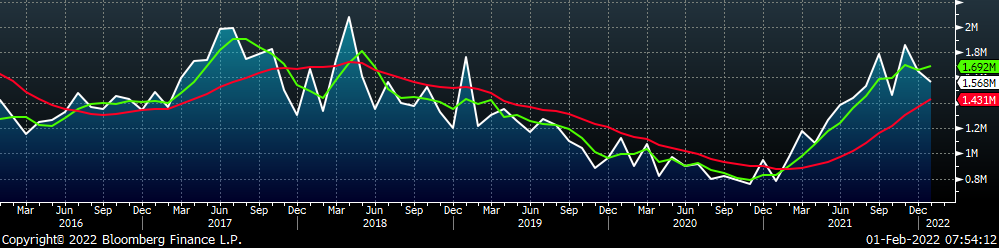
January flat rolled import license data is forecasting a decrease of 57k to 1.13M MoM.
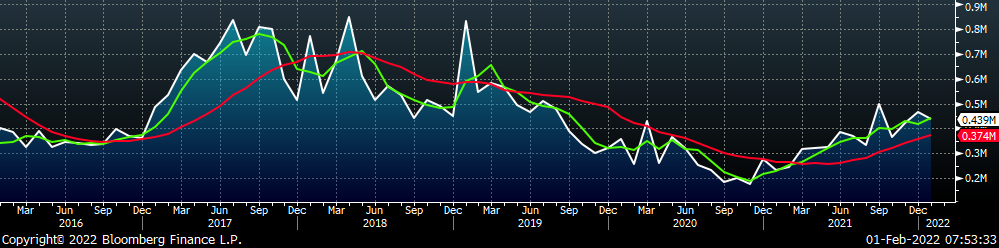
Tube imports license data is forecasting a decrease of 29k to 439k in January.
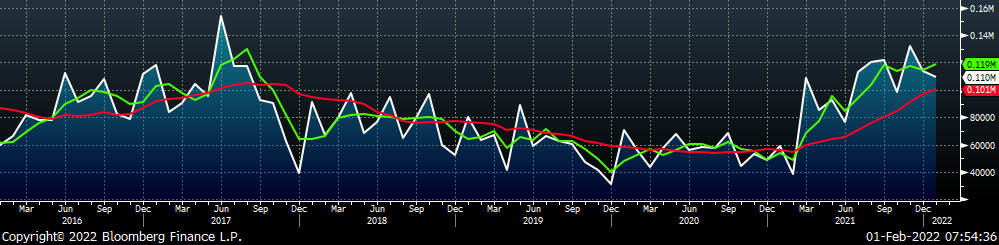
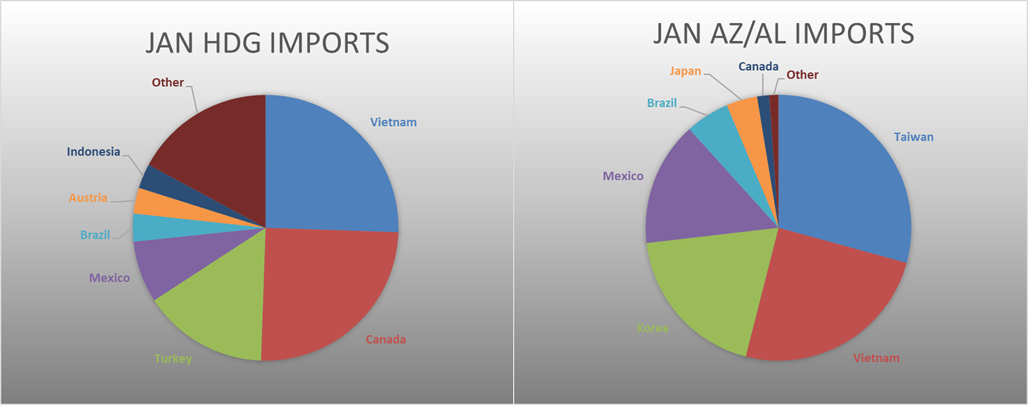
January AZ/AL import license data is forecasting a decrease of 4k to 110k.
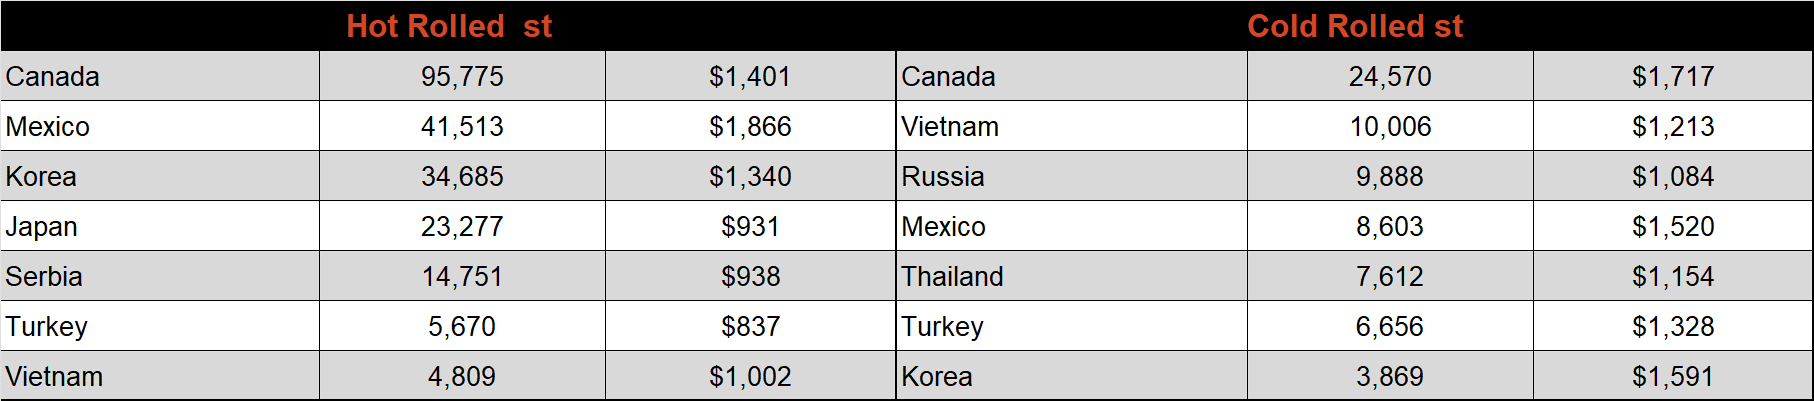
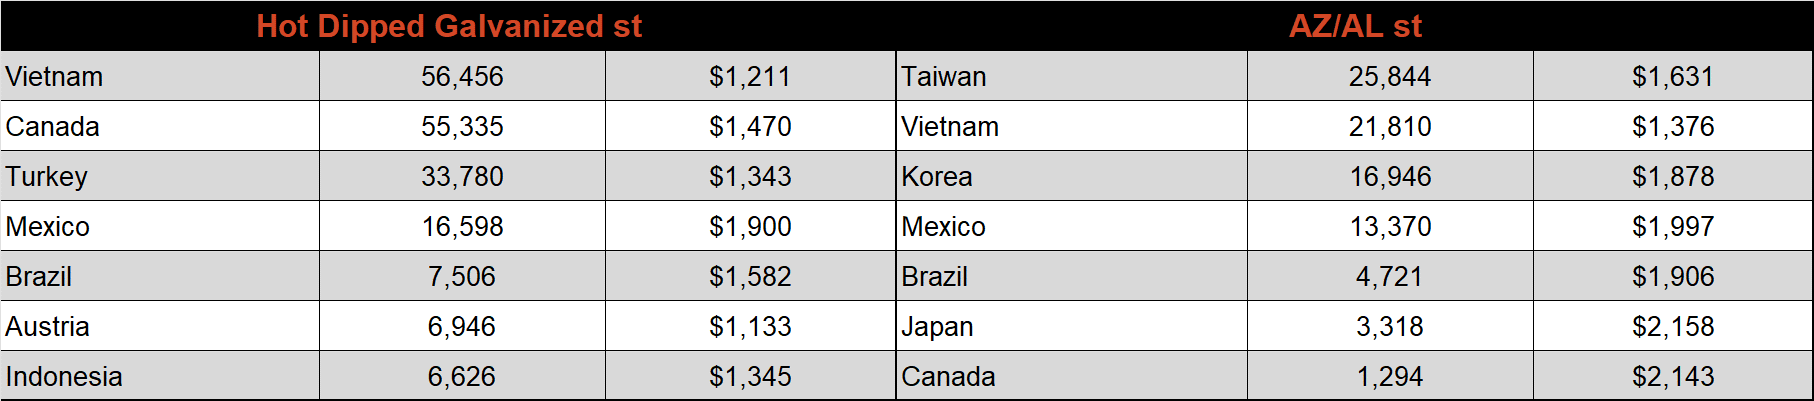
Below is December import license data through January 24th, 2022.
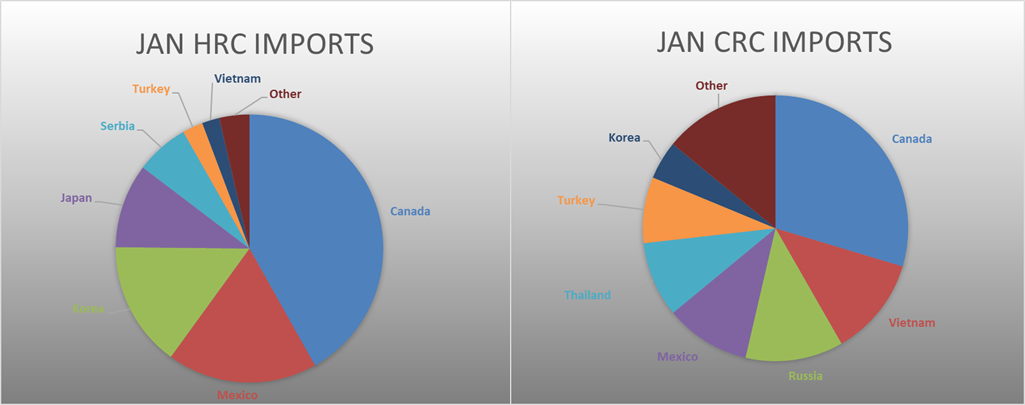
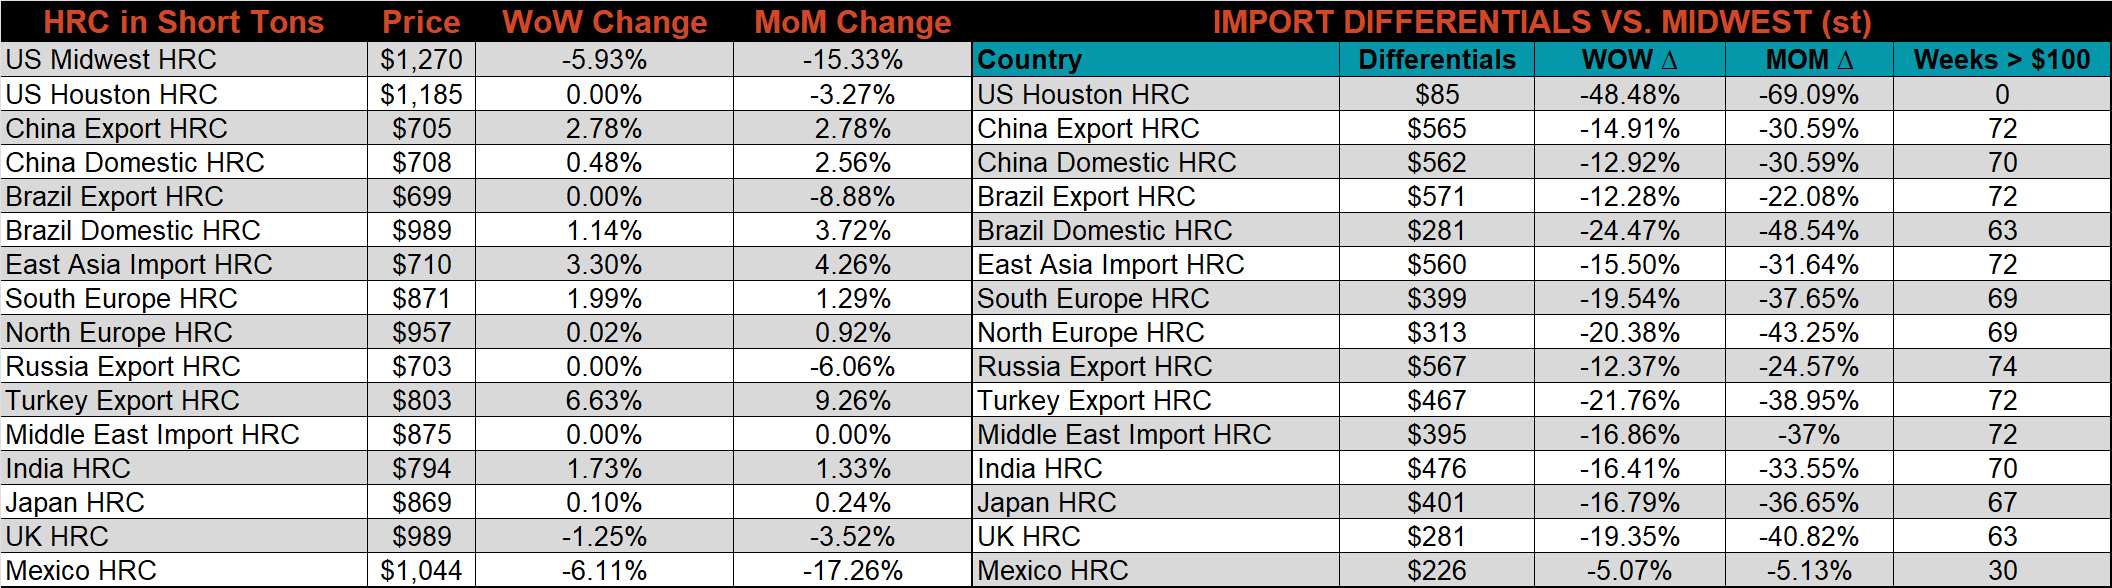
Below is the Midwest HRC price vs. each listed country’s export price using pricing from SBB Platts. We have adjusted each export price to include any tariff or transportation cost to get a comparable delivered price. All the watched countries differentials decreased significantly again this week, as the domestic price continued to decrease in the face of stable global prices.
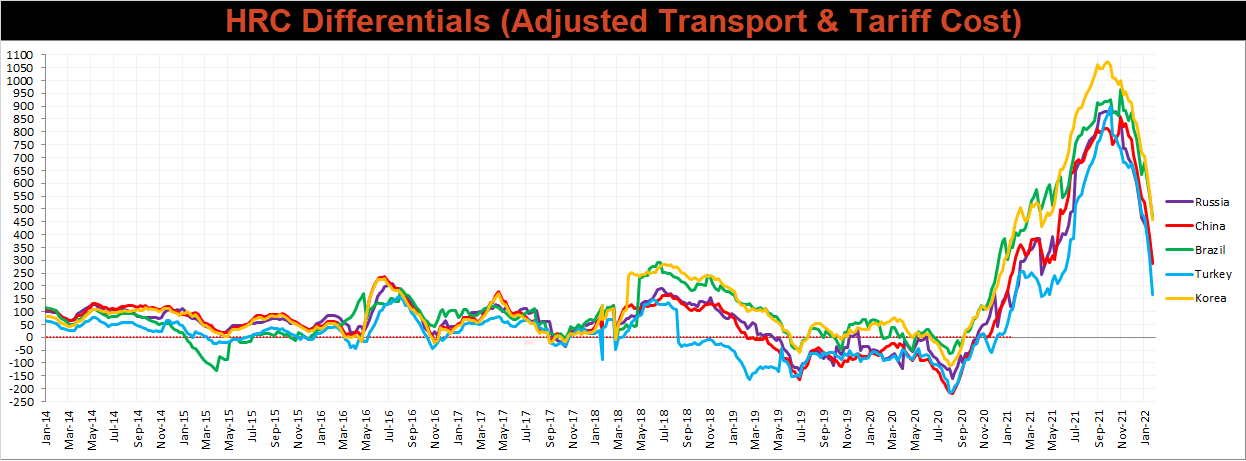
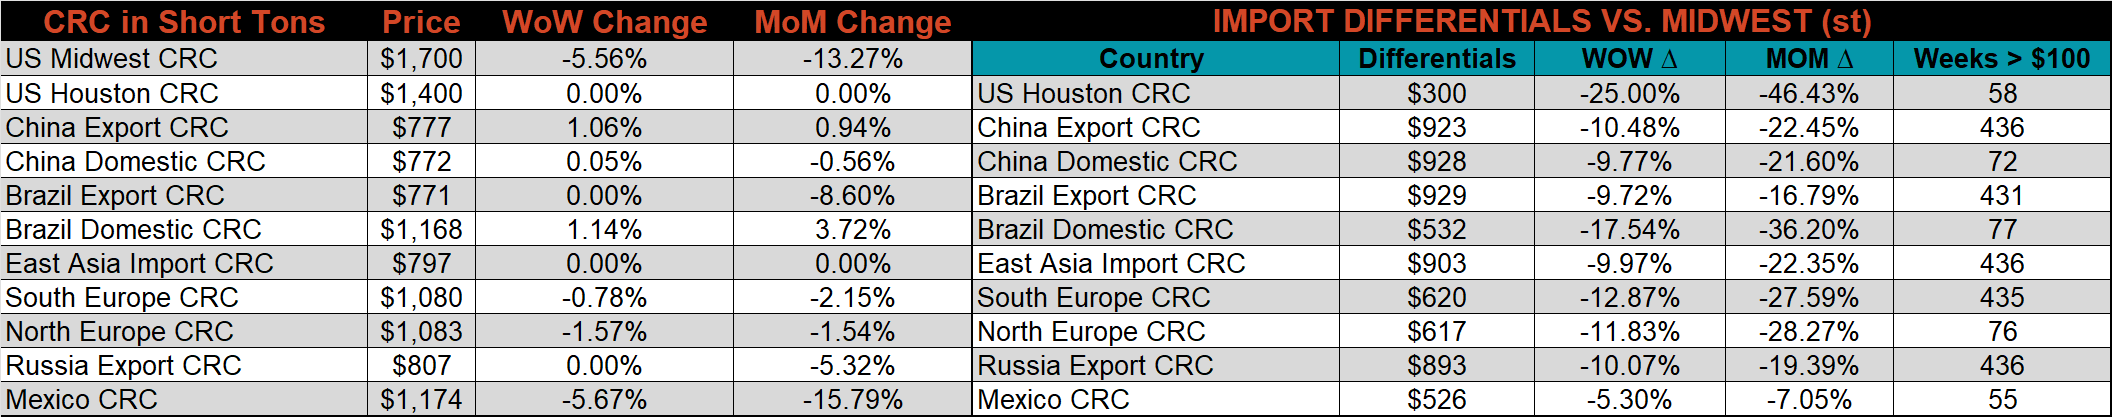
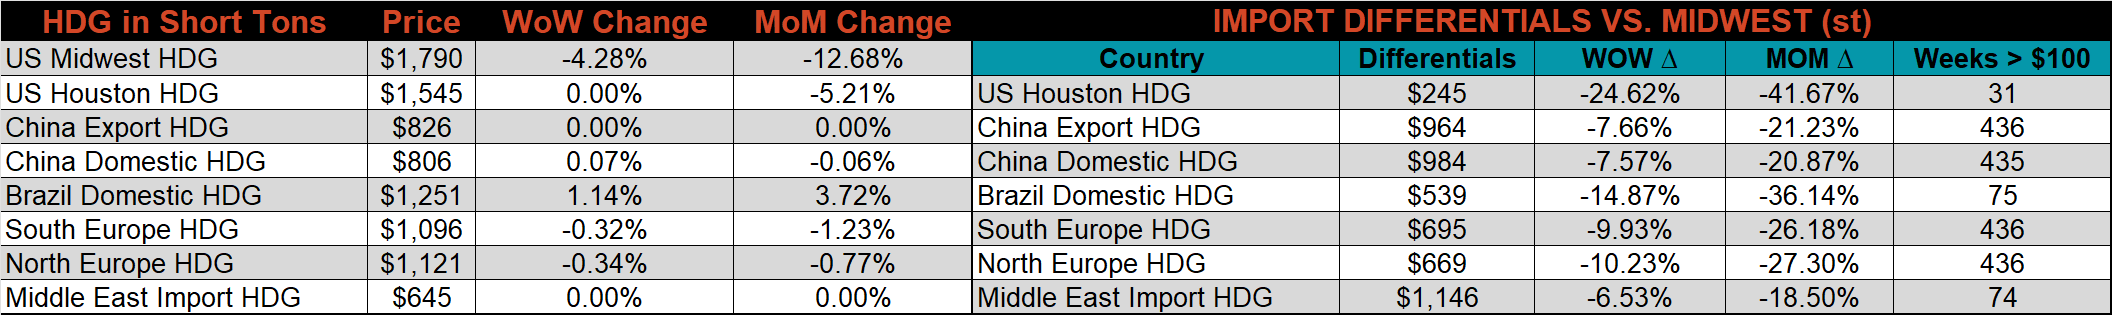
SBB Platt’s HRC, CRC and HDG pricing is below. The Midwest HRC, CRC & HDG prices were all lower this week, down 5.9%, 5.6% and 4.3%, respectively. Outside of the U.S., the Turkish HRC export price was up 6.6%.
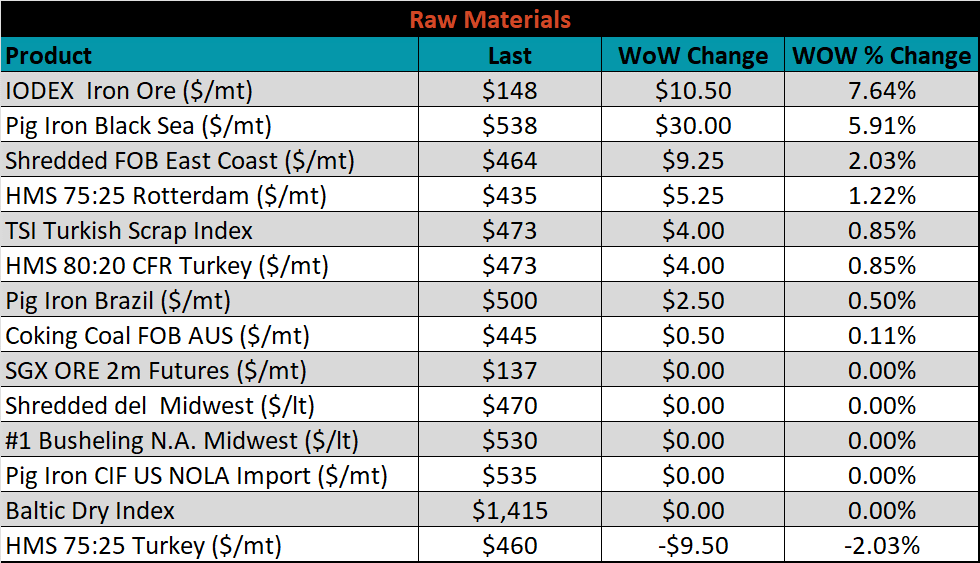
Raw material prices were mostly higher, led by the IODEX, up 7.6%, while Turkish 75:25 HMS was down 2%.
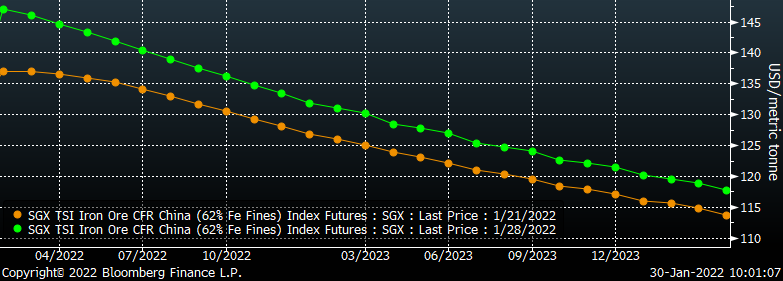
Below is the iron ore future curve with Friday’s settlements in green, and the prior week’s settlements in orange. Last week, the entire curve continued to shift higher, especially in the front months.
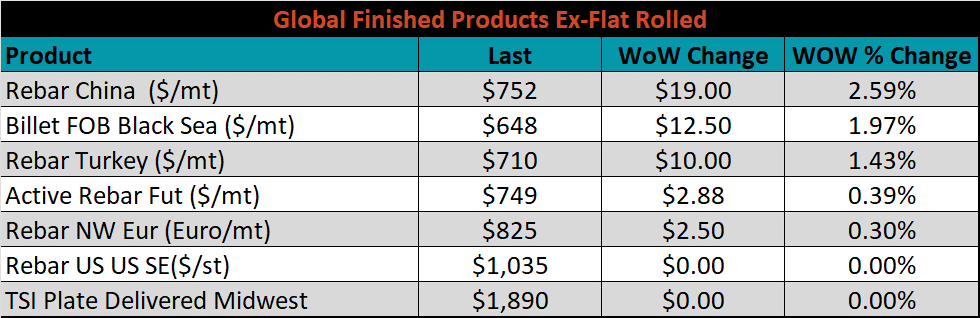
The ex-flat rolled prices are listed below.

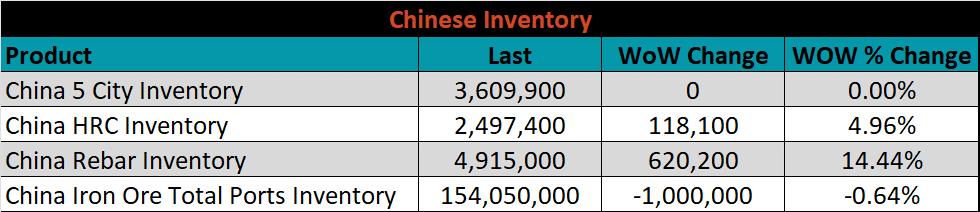
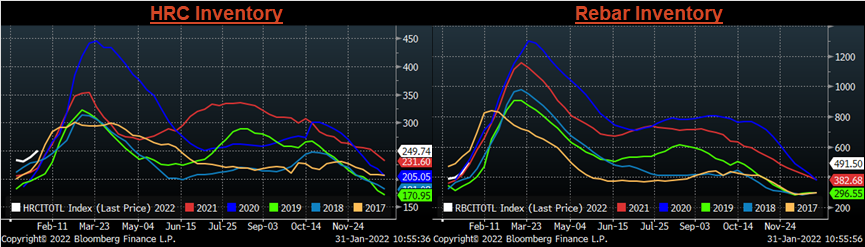
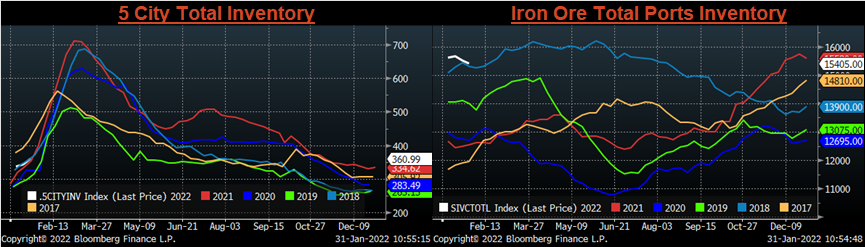
Below are inventory levels for Chinese finished steel products and iron ore. Iron ore inventory levels were slightly lower for the third week in a row, while the HRC, and rebar inventories both jumped this week. 5-City inventory levels were not updated due to the Chinese New Year holiday.
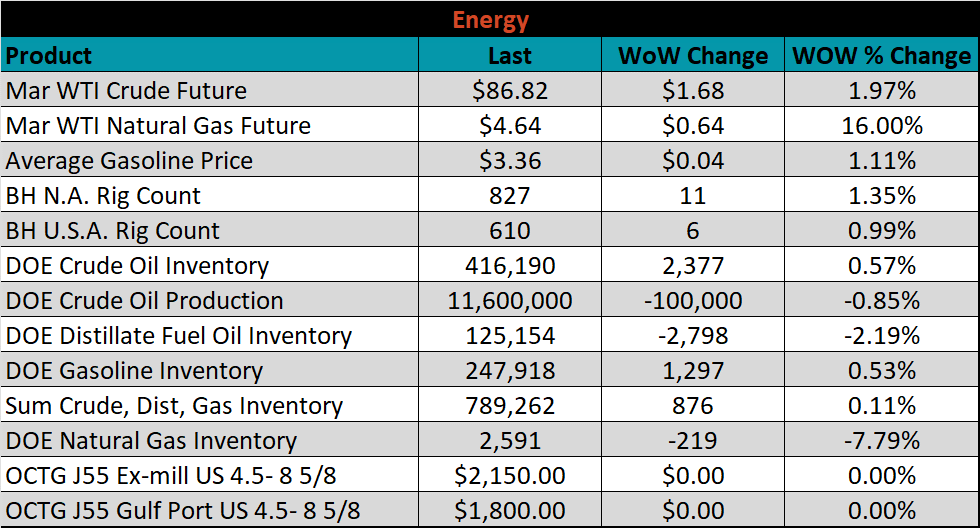
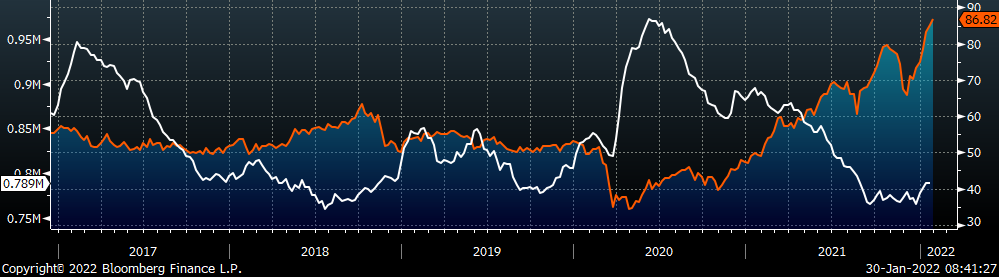
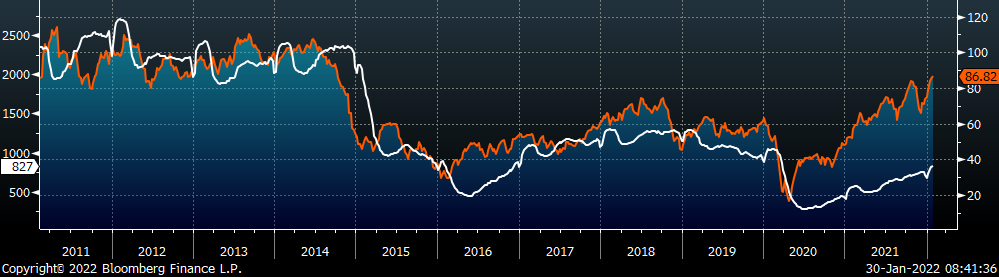
Last week, the March WTI crude oil future gained another $1.68 or 2% to $86.82/bbl. The aggregate inventory level was up 0.1%, while crude oil production dipped slightly to 11.6m bbl/day. The Baker Hughes North American rig count was up by another 11 rigs, and the U.S. rig count was up 6 rigs.
The list below details some upside and downside risks relevant to the steel industry. The bolded ones are occurring or highly likely.
Upside Risks:
Downside Risks: