Content
-
Weekly Highlights
- Market Commentary
- Risks


The HRC market continued to firm last week, with select transactions occurring above $1,200/st for HRC as buyers are still willing to pay a premium for material delivered sooner. Mills continue to target the $1,200 level for spot HRC, and most domestic producers have closed their March order books and are still waiting to open April books. Some view the fact that mills have not raised their offers above $1,200 as a bearish sign for the price outlook. However, two physical market dynamics make us think otherwise. First, scrap prices appear to be weaker than expected for February, meaning mills can increase profits at the same sales price because their input costs are declining. More importantly, while mill offer prices remain the same at $1,200, the price range of transactions is shrinking and drifting closer to the top end of the range. This is beneficial for mills not only for their spot sales, but it also supports higher selling prices through their floating price contracts. Contract pricing is based on index prints during the second week of the prior month, so these higher spot transactions this week translate into higher sales prices for their March contract orders. This does not bode well for steel buyers, who have been holding off purchases for months with the hope that price rally will stall and reverse. Feeding these decisions to delay purchases has been bearish commentary and headlines, which we will discuss in this week’s market commentary.
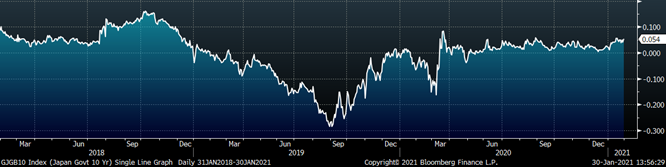
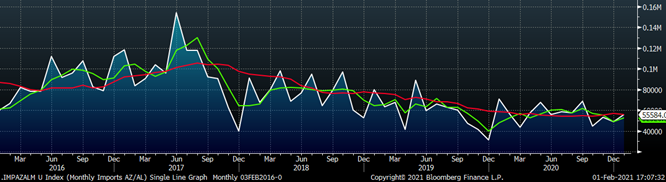
Most doomsday price predictions for 2021 are predicated on rapid increases in supply, relating to more imports and increasing domestic production. When the headline appeared last week that the European Union proposed lifting retaliatory tariffs on U.S. goods if section 232 tariffs were lifted, market bears celebrated this “validating” news by selling the HRC curve, pushing some expiration down over 7% on the day. However, a quick analysis of the implications of this proposed action shows minimal impact over the long term, with the market unaffected in the short term. The shaded region in the below chart signifies when the 232 tariffs began, and the dotted red line is the average import level before and after Jan. 2019.
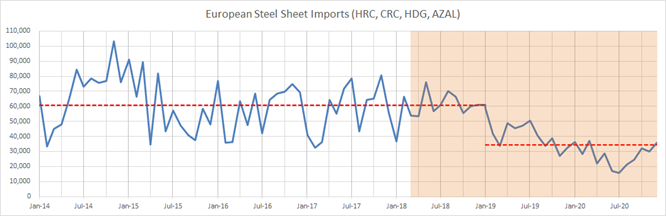
Notice that there was no significant change in import levels from the EU for a year after the section 232 announcement, leading us to believe that a similar time frame is in order for a reversal of this policy. Moreover, should import levels return to pre-232 levels, it would add only approximately 25,000 tons per month to the domestic supply of carbon sheet products. This will barely dent the current estimated deficit of over one million tons, leaving prices unaffected.
The above is just one example of misleading information in the market, leading to costly and/or unprofitable buying or selling decisions. At the end of the day, it is the dynamics within the physical market that will drive price changes, and market participants should be extremely skeptical of price prediction models that ignore or contradict those dynamics. The prevailing outlook remains intact, with production levels still significantly below last year’s levels, and robust demand for goods throughout the economy further supporting steel and general commodity prices.
Below are the most pertinent upside and downside price risks:
Upside Risks:
Downside Risks:
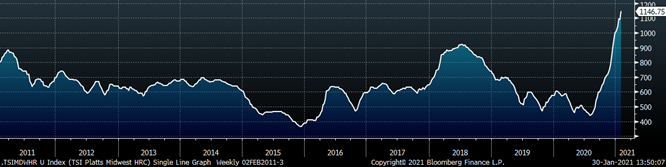
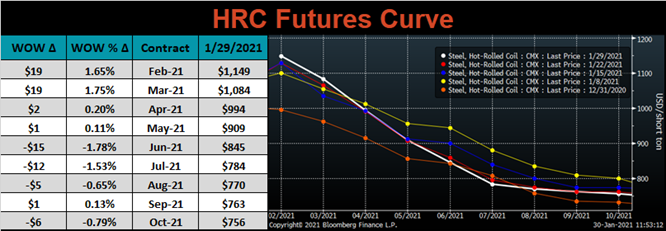
The Platts TSI Daily Midwest HRC Index increased by $56 to $1,146.75.
The CME Midwest HRC futures curve is below with last Friday’s settlements in white. Last week, the curve shifted higher in the front months and slightly lower in the back.
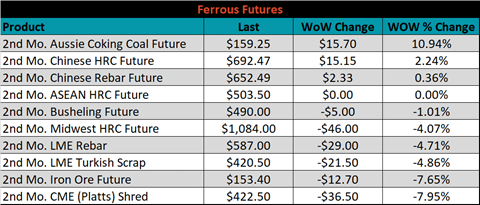
March ferrous futures were mixed. Aussie coking coal gained another 10.9%, while CME Platts shredded lost 8%.
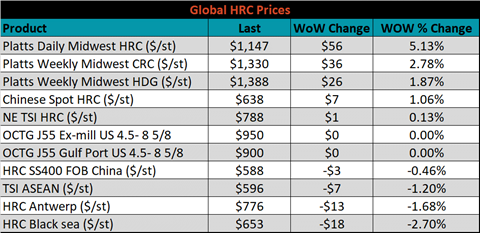
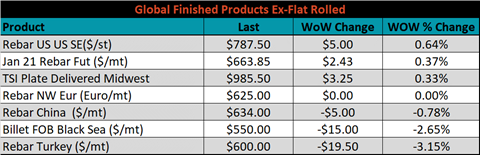
Global flat rolled indexes were mixed. Midwest HRC was up 5.1%, while Black Sea HRC was down 2.7%.
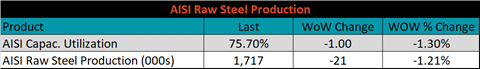
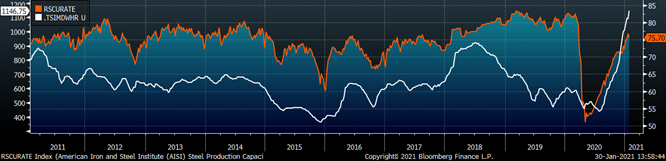
The AISI Capacity Utilization rate decreased 1% to 75.7%.
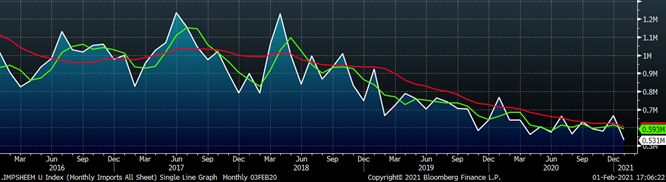
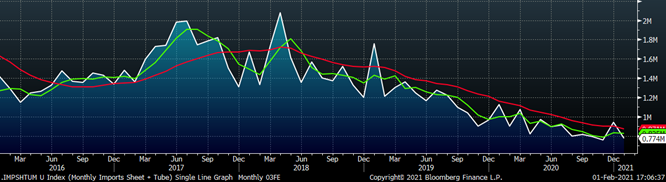
January flat rolled import license data is forecasting a decrease of 136k to 531k MoM.
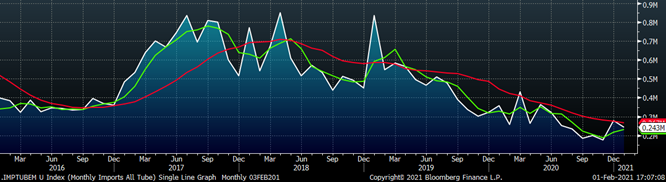
Tube imports license data is forecasting a decrease of 34k to 243k in January.
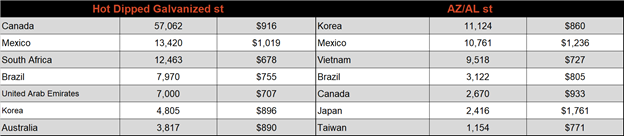
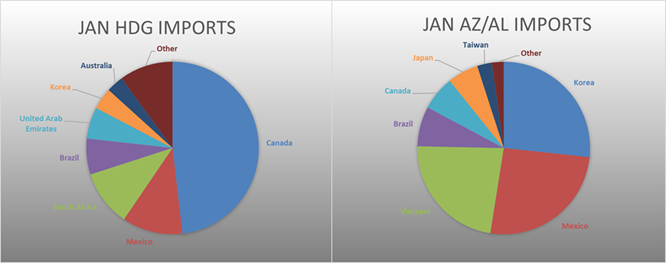
January AZ/AL import license data is forecasting a 7k increase to 56k.
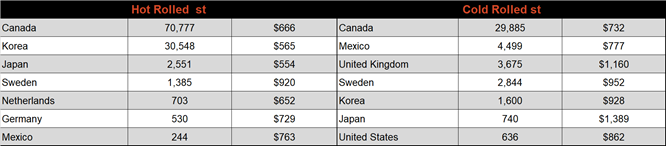
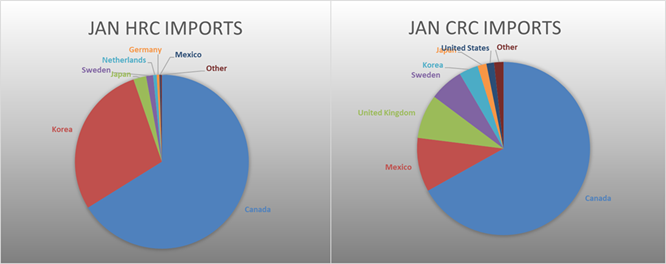
Below is January import license data through January 26, 2021.
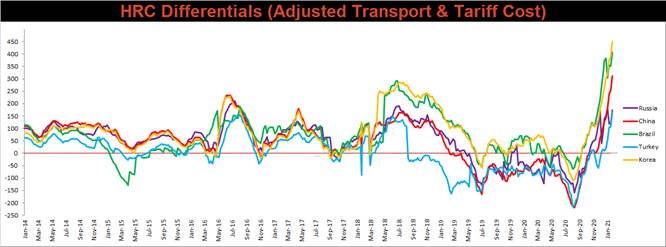
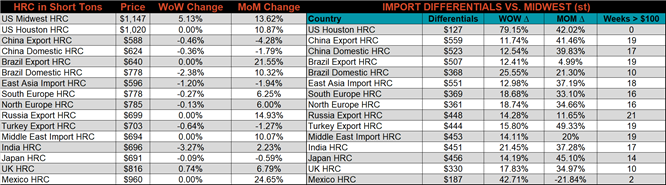
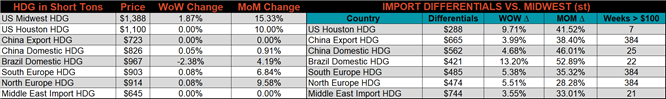
Below is the Midwest HRC price vs. each listed country’s export price using pricing from SBB Platts. We have adjusted each export price to include any tariff or transportation cost to get a comparable delivered price. All watch countries differentials increased, as the U.S. price continues to outpace all other countries.
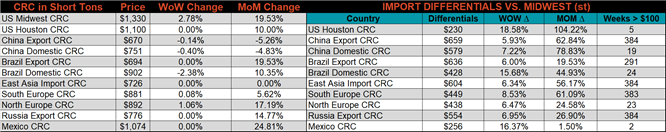
SBB Platt’s HRC, CRC and HDG pricing is below. The Midwest HRC, CRC and HDG prices were up 5.1%, 2.8% and 1.9%, respectively. Globally, the Indian HRC price was down 3.3%, as the Indian Government decreased import taxes.
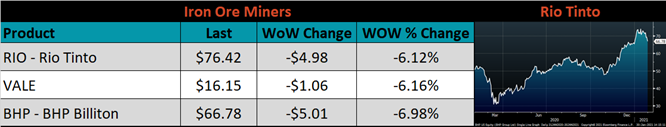
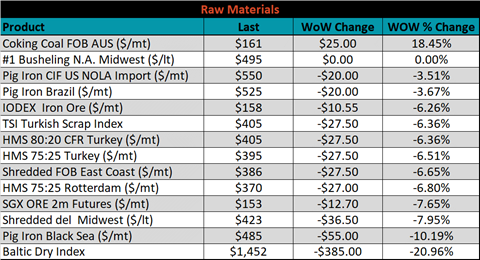
Raw material prices were mixed. Aussie coking coal was up another 18.5%, while Black Sea pig iron was down 10.2%.
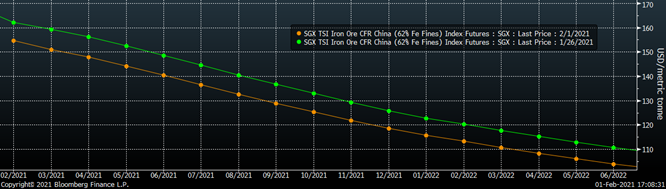
Below is the iron ore future curve with Friday’s settlements in orange, and the prior week’s settlements in green. Last week, the entire curve shifted significantly lower across all expirations.
The ex-flat rolled prices are listed below.

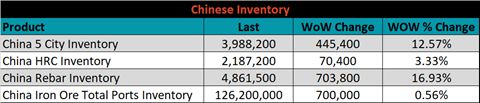
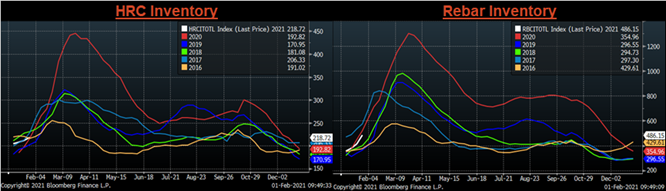
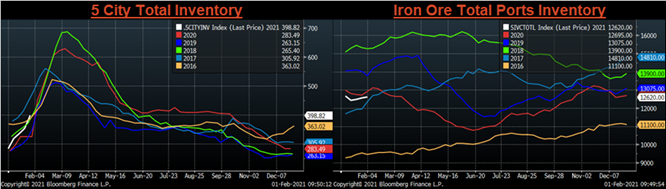
Below are inventory levels for Chinese finished steel products and iron ore. Inventory levels continue to increase across the board, which is typical during the first quarter of the year. Where prices in these markets move after the Golden Week holiday will likely have a significant impact on the global import markets.
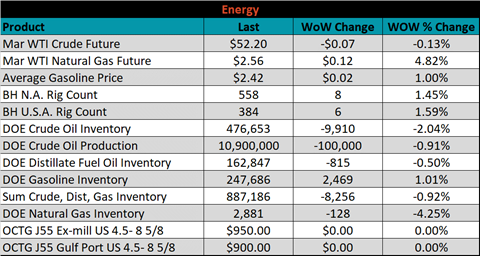
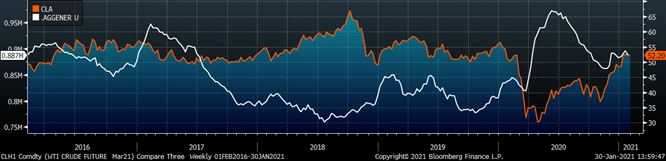
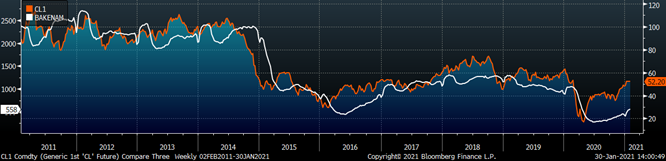
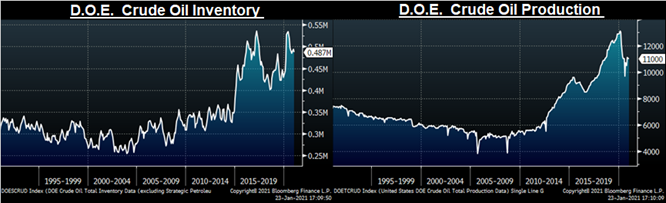
Last week, the March WTI crude oil future lost $0.07 or 0.1% to $52.20/bbl. The aggregate inventory level was down 0.9% and crude oil production decreased to 10.9m bbl/day. The Baker Hughes North American rig count was up by another 8 rigs, and the U.S. rig count was up 6 rigs.
The list below details some upside and downside risks relevant to the steel industry. The orange ones are occurring or look to be highly likely. The upside risks look to be in control.
Upside Risks:
Downside Risks: