Content
-
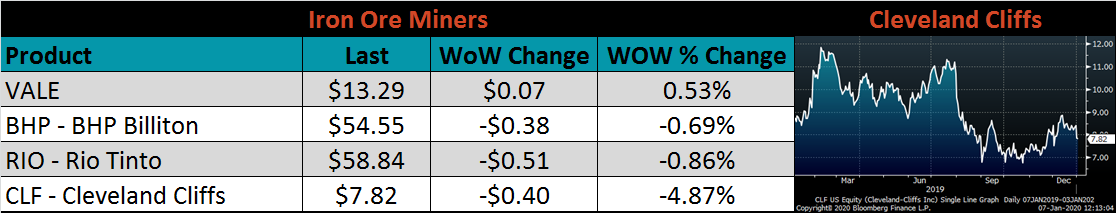
Weekly Highlights
- Market Commentary
- ISM PMI
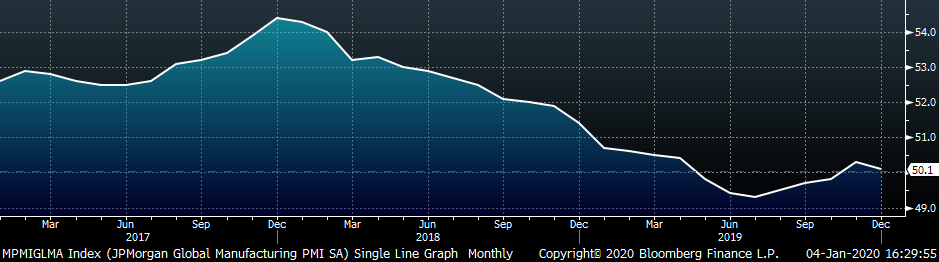
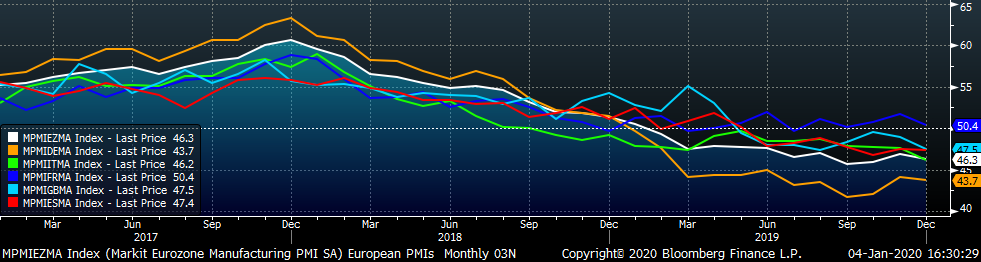
- Global PMI
- Construction Spending
- Auto Sales
- Risks


Over the last several weeks, the domestic flat rolled steel market has continued to strengthen and spot prices have reflected this by grinding higher. Mills are now firmly above $600/ton for spot quotes, and Nucor has just pushed another $40 price increase announcement, the 5th hike since October. Below is a list of the events and dynamics that have pushed spot prices above $600, more than $150/ton higher than they were in October:
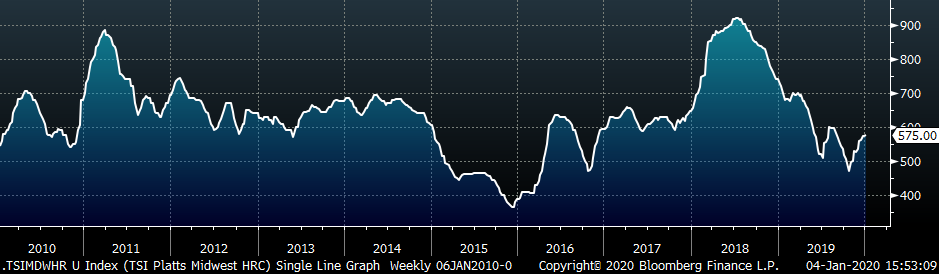
Now that we have reached higher prices levels, those using or selling low cost inventory will have to restock at the higher current price levels. The market has yet to see if buyers are willing to do this, and demand within the steel market will drive buyers’ decisions. Basic economics tells us that prices will move to the level where supply and demand meet. While prices have recovered over the last three months, demand within the steel market remains muted. The chart below shows the Platts TSI Midwest HRC Index compared to the ISM Manufacturing PMI Index.
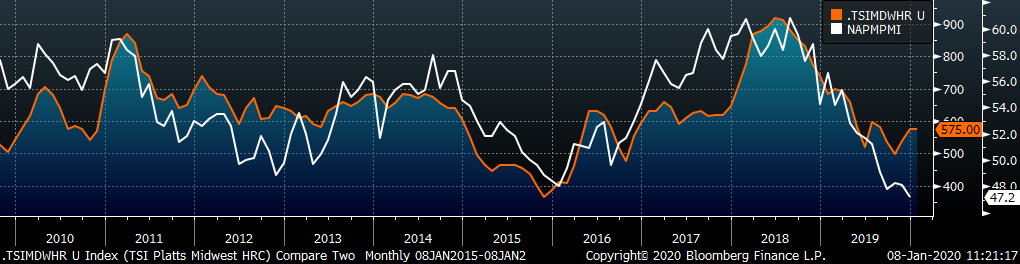
If we use the PMI index as a proxy for demand within the steel sector, we can see that demand has continued to fall, even while prices have rallied over the last few months. The factors highlighted above have contributed to increasing prices, despite the fact that demand is at low levels. Current prices have further upside risk if demand recovers because end users will have to restock despite the high price level if they see a growing backlog and improving demand.
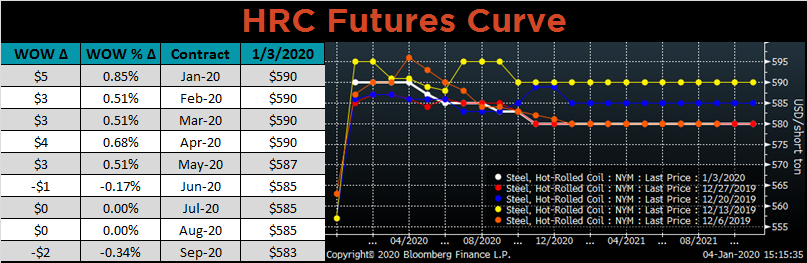
While spot prices increased over the holidays, the future curve remained unchanged as activity and volumes plummeted. This creates two opportunities worth noting. First, the curve appears undervalued, and will have to move higher to meet the higher physical transaction prices. Second, the curve has begun to shift into backwardation, where the spot price is higher that prices further out on the curve. Historical studies find that this shift occurs alongside large spot price rallies. Moreover, those looking to lock in prices for the long-term, the curve provides an opportunity to lock in future tonnage at prices below the current spot price.
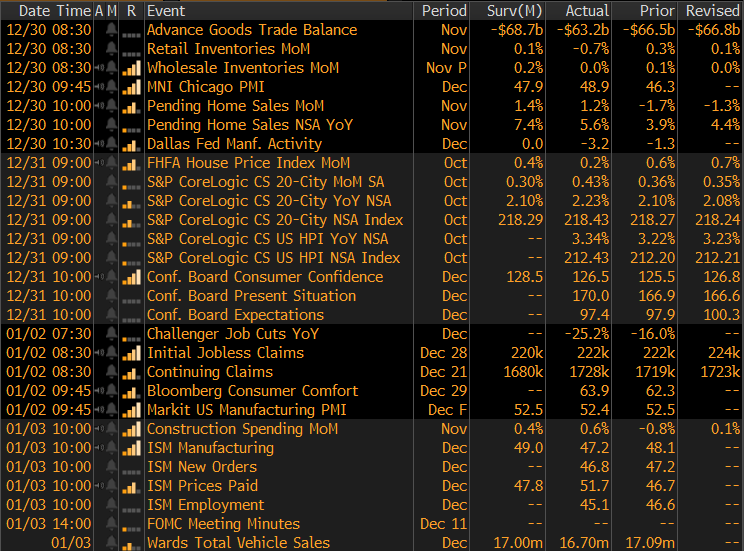
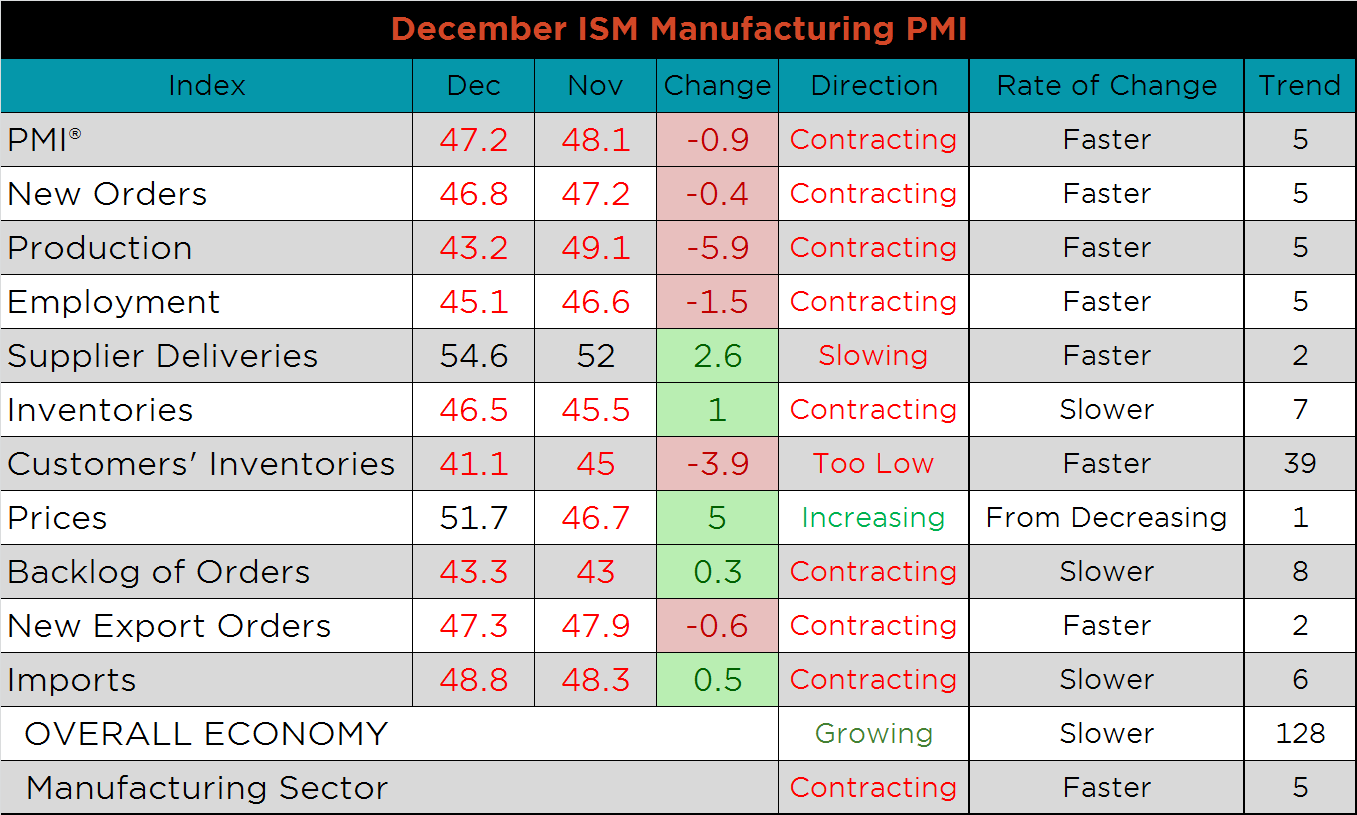
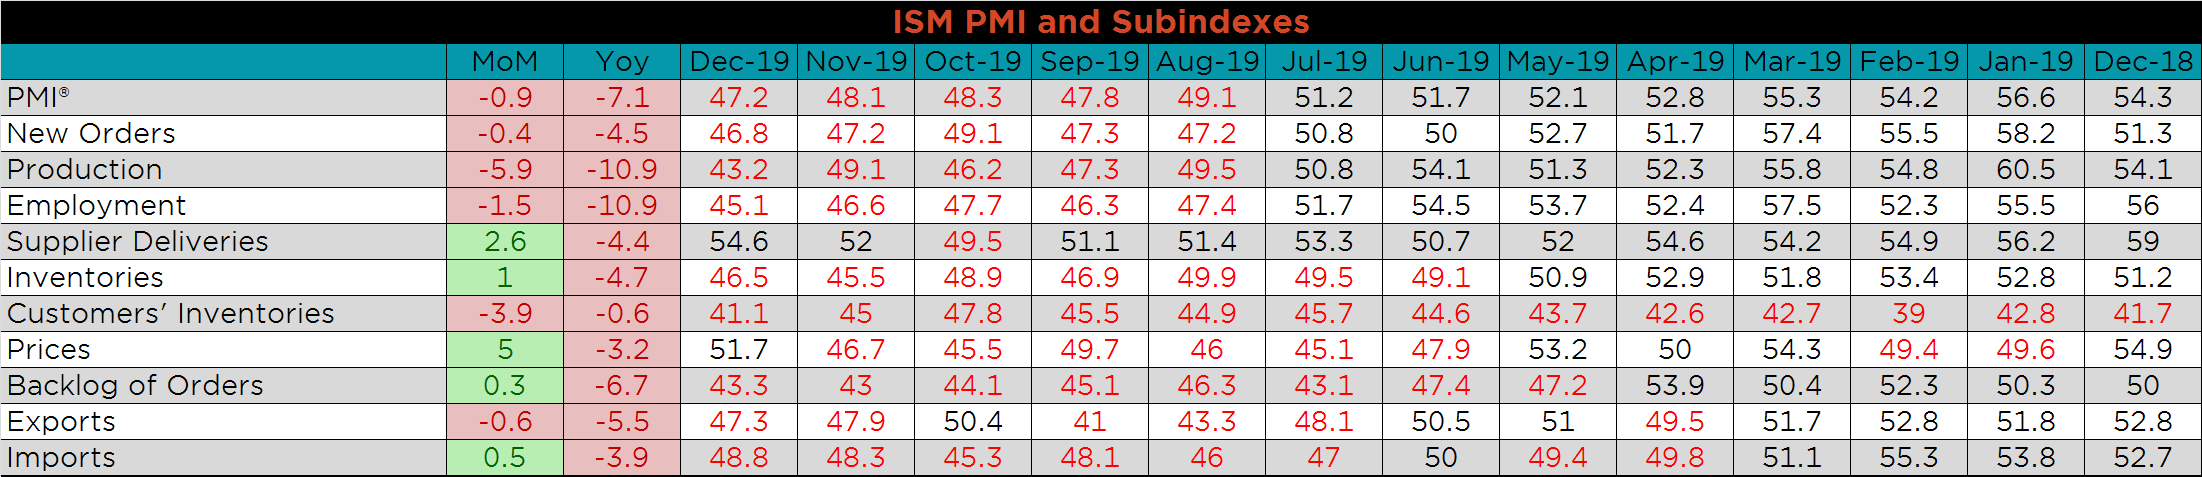
The December ISM Manufacturing PMI and subindexes are below. The topline PMI number was down 0.9 points and remains in contraction.
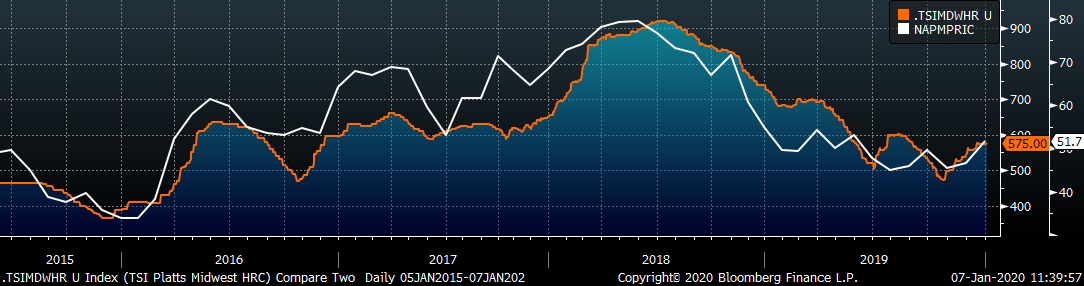
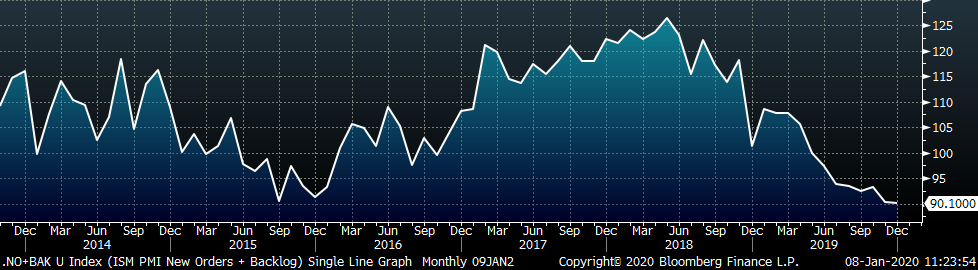
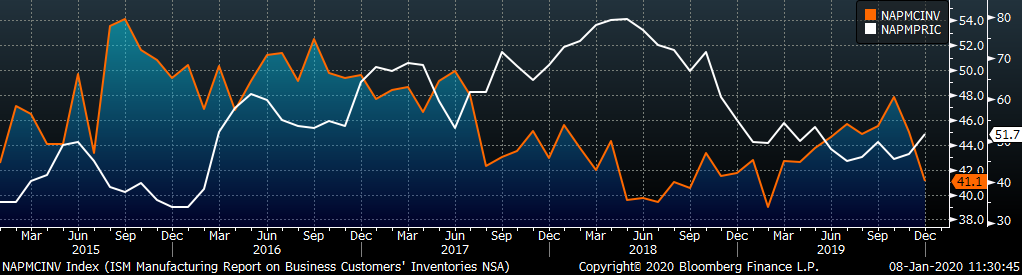
The chart below compares the ISM prices subindex with the Platts TSI Daily Midwest HRC Index, which have both increased over the last few months. The second chart adds the new orders and backlog subindexes together, giving an indication of demand within the manufacturing sector. The last chart compares the customers’ inventory subindex with the prices subindex. Customer inventories fell to the lowest level since February, while prices continue to move higher. Across the manufacturing sector, end users are working through their existing inventory rather than paying higher prices to restock. However, once existing inventory is depleted, they will be forced to initiate new orders, which will reveal their willingness to pay higher prices for inventory. If their order books are strong and they expect demand to increase, they will restock at these higher prices.
The prices subindex was up 5 points to 51.7 to join supplier deliveries, in expansion. Production was down 5.9 points compared to November while all subindexes were lower compared to December 2018.
This month’s global PMI printings show continued weakness in many major manufacturing countries with nine countries printing flat or higher, while sixteen countries saw their PMI’s decrease. Bright spots in the December printings include India, up 1.5 points and Taiwan, Switzerland & South Korea, who all moved into expansion. The U.S., Japan, the Eurozone and German PMI’s all printed lower, further into contraction.
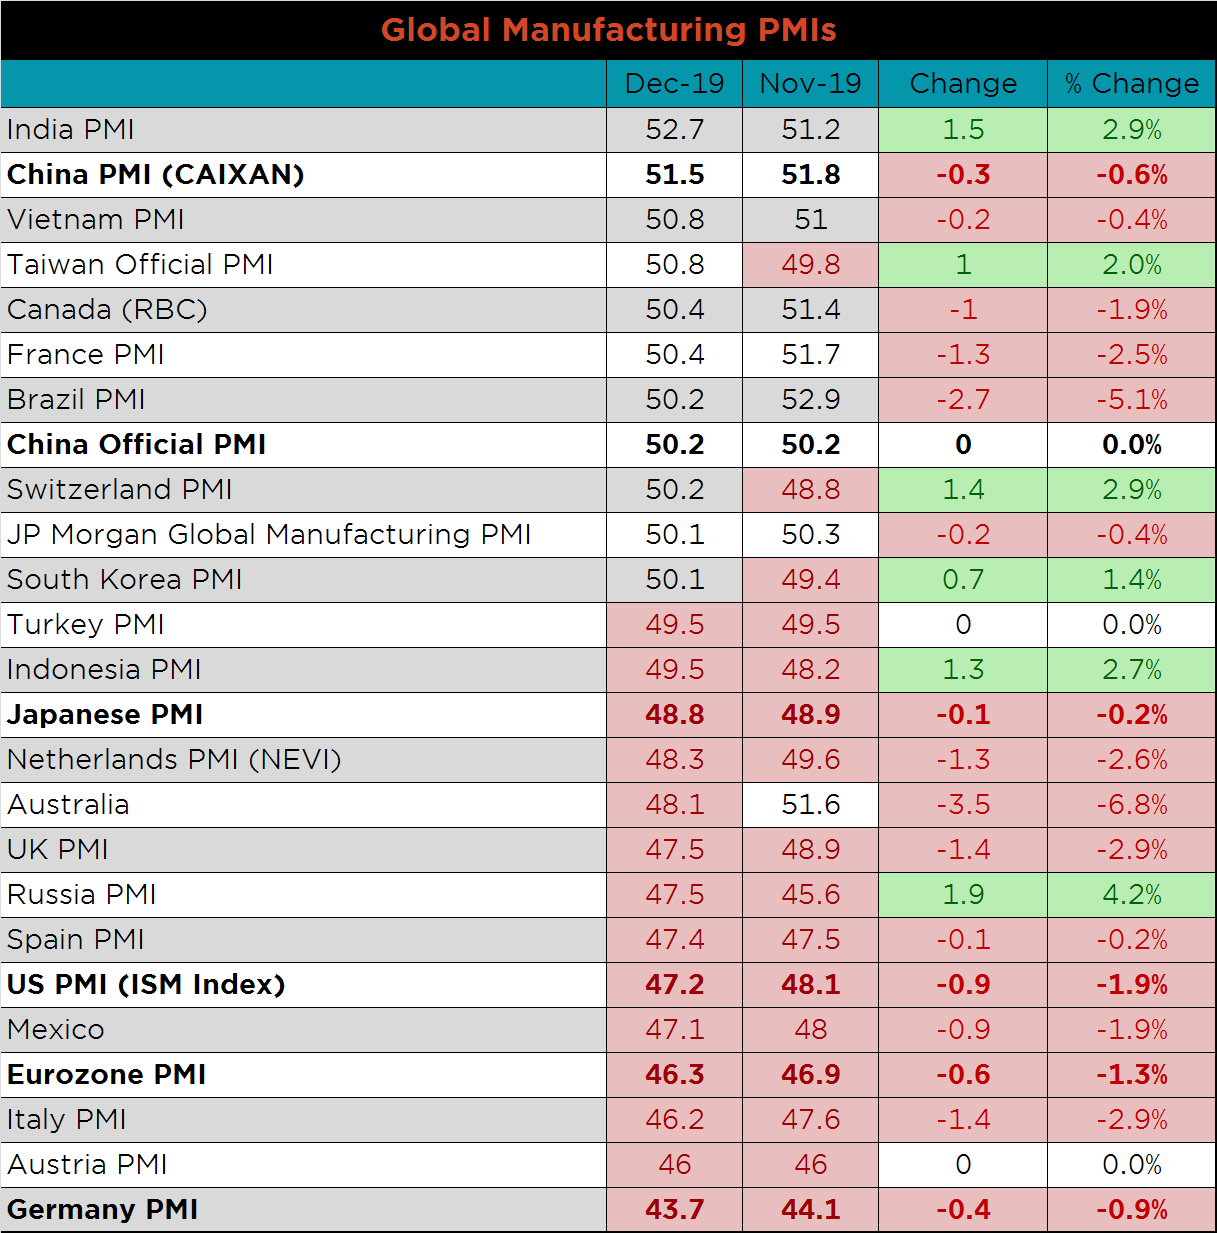
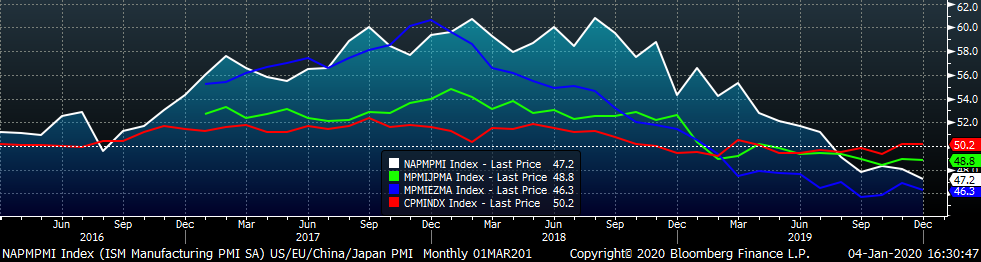
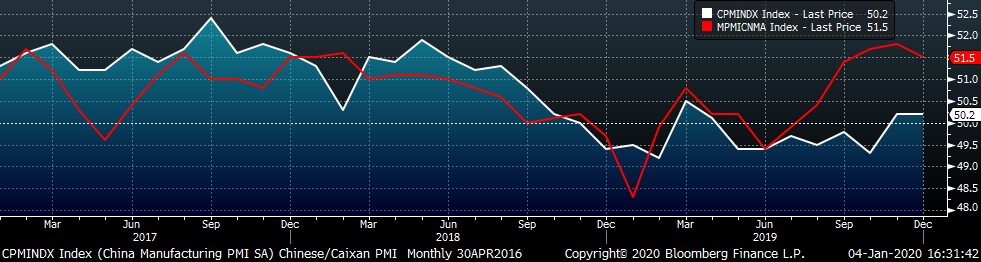
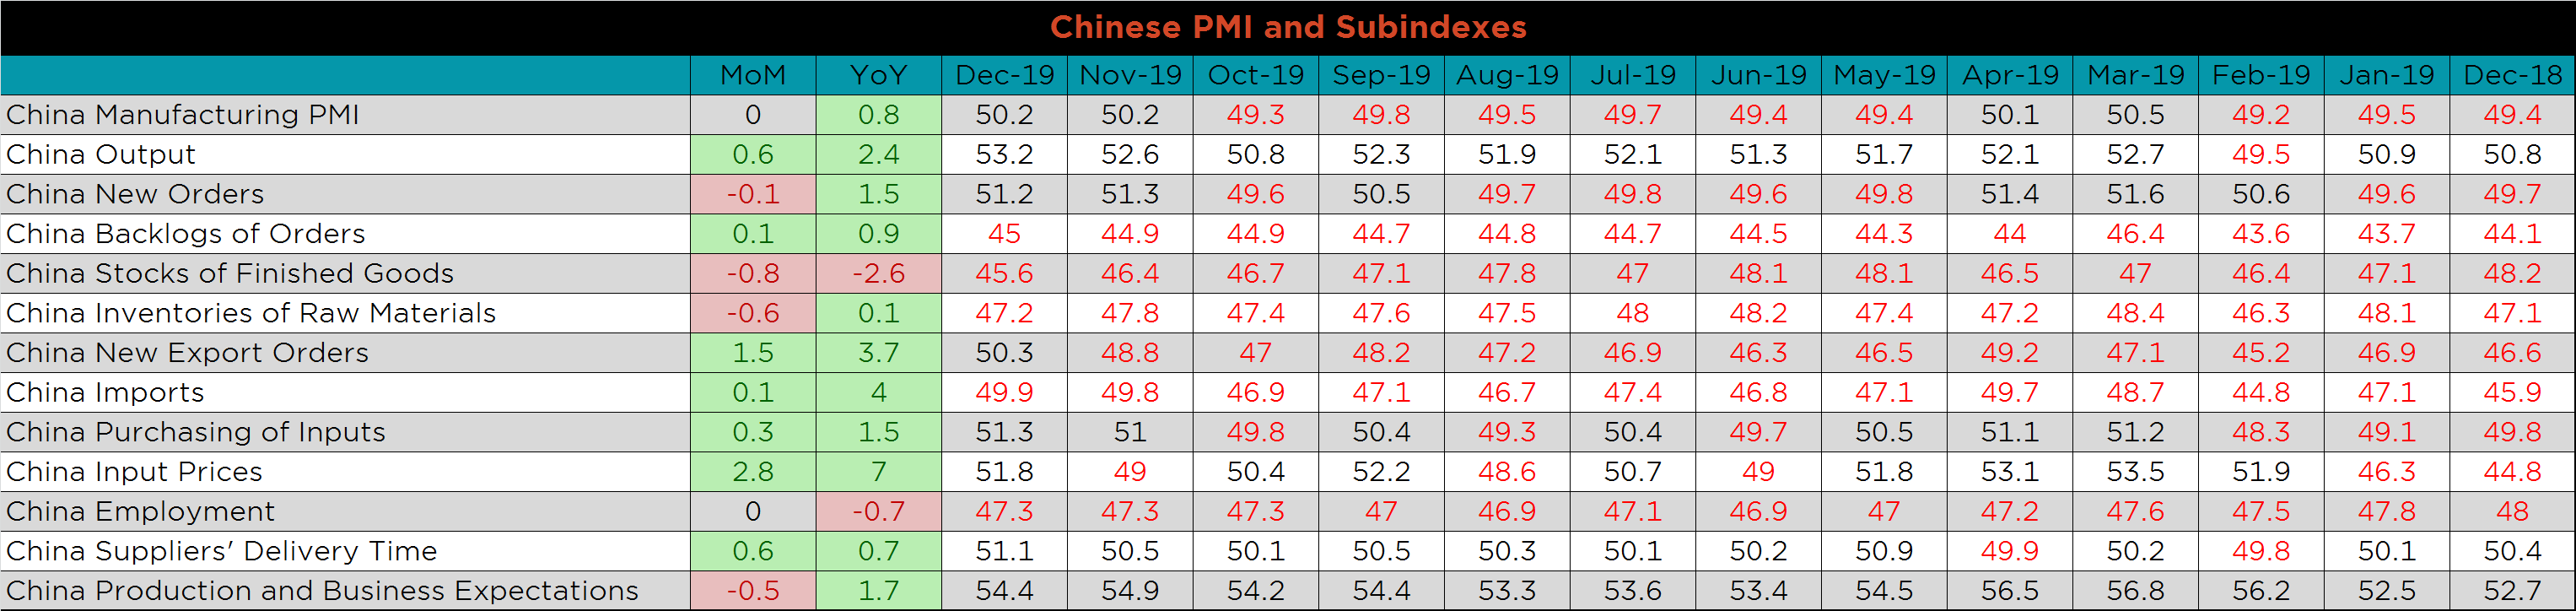
China’s official PMI printed flat at 50.2, while the Caixan Manufacturing PMI printed down 0.2 points to 51.5.
The table below breaks down China’s official manufacturing PMI subindexes. While many of the subindexes increased this month, Production & Business Expectations was down 0.5 points, along with lower new orders and flat employment.
Seasonally adjusted U.S. construction spending was revised higher for September and October and was up slightly MoM in November, while YoY spending increased for all categories. Not seasonally adjusted spending on private non-residential construction was the only category lower compared to the last November.
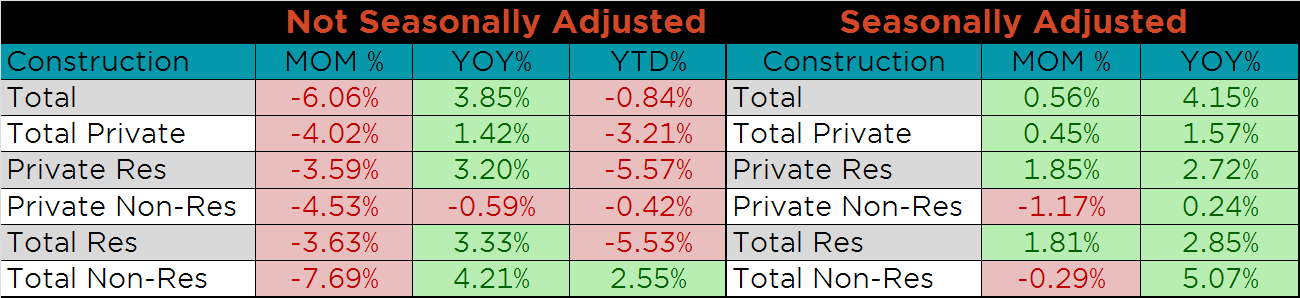
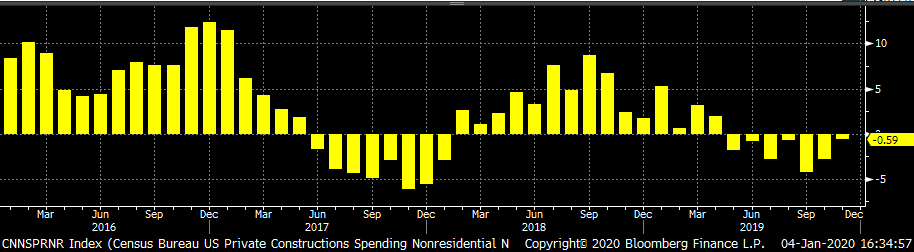
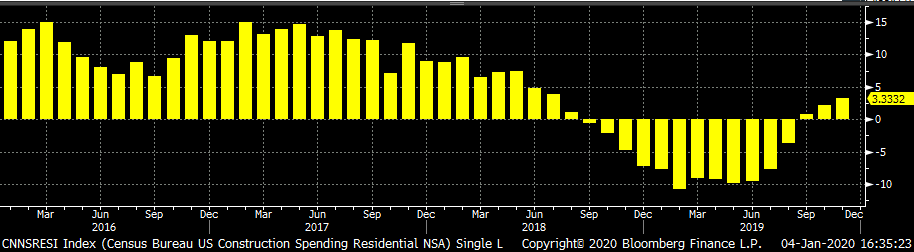
The white line in the chart below represents construction spending in each month of 2019 and compares it to the spending of the previous 4 years. The last three months, year-over-year spending growth has been positive, making up for the declines early in 2019. The last two charts show the YoY changes in construction spending. Private non-residential spending remains just below levels from 2018, but has recovered from the September lows. Residential spending continues to improve, due in part to low rates and consumer confidence.

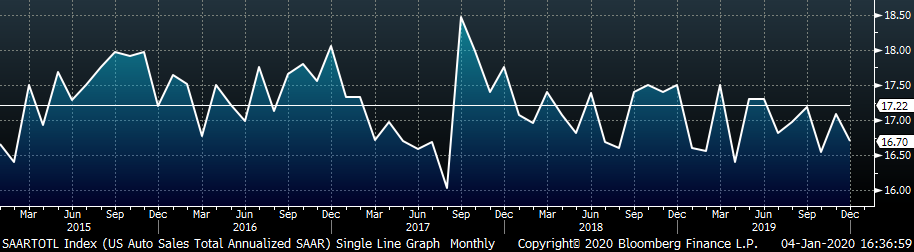
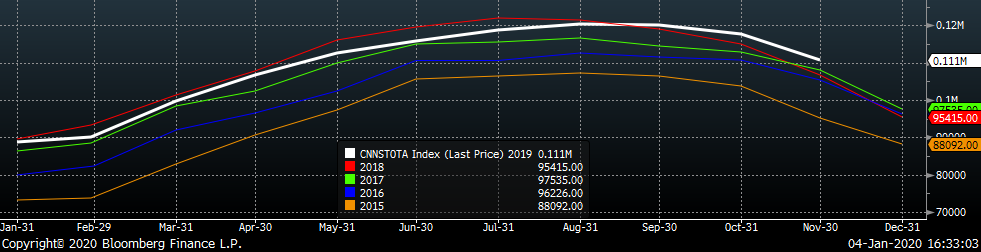
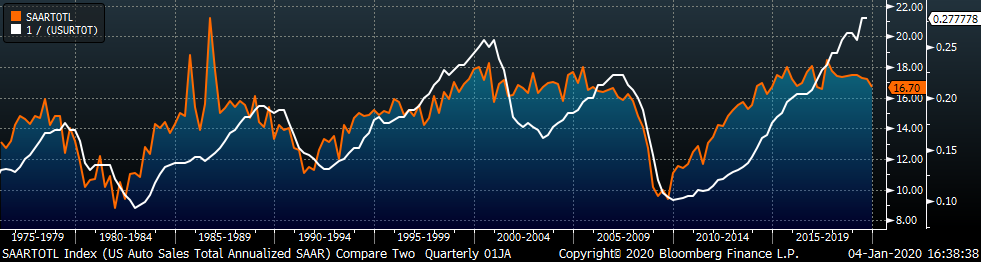
November U.S. light vehicle sales increased to a 17.09m seasonally adjusted annualized rate (S.A.A.R). The white line in the second chart below compares monthly light auto sales with previous years’ levels. After two months of sales at the lowest levels of the previous 4 years, November came in the highest over the same period. The third and final chart depicts the relationship between the unemployment rate and auto sales. We have inverted unemployment rate to show how declining unemployment typically leads to increasing auto sales. Annualized auto sales appear to have peaked for the cycle, while the employment continues to improve.
Below are the most pertinent upside and downside price risks:
Upside Risks:
Downside Risks:
The Platts TSI Daily Midwest HRC Index was up $1 to $575.
The CME Midwest HRC futures curve is below with last Friday’s settlements in white. The curve didn’t change much over the last 3 weeks.
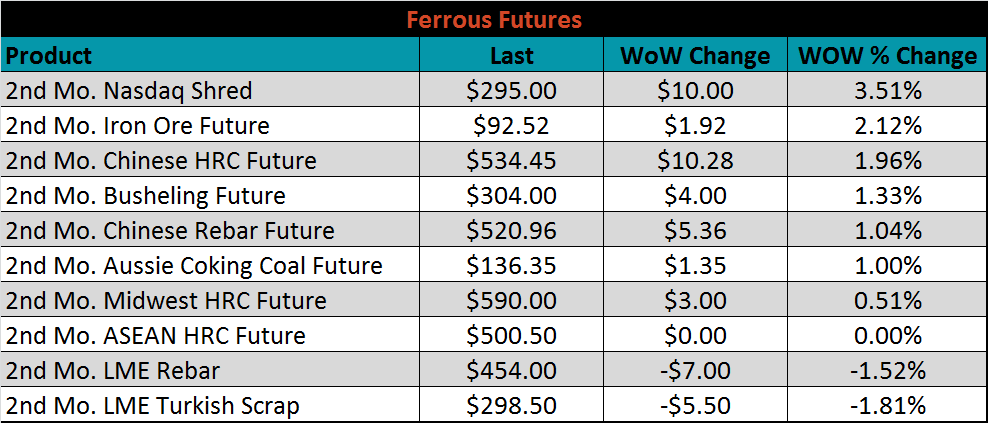
March ferrous futures were mixed. The nasdaq shred future gained 3.5%, while the Turkish scrap future lost 1.8%.
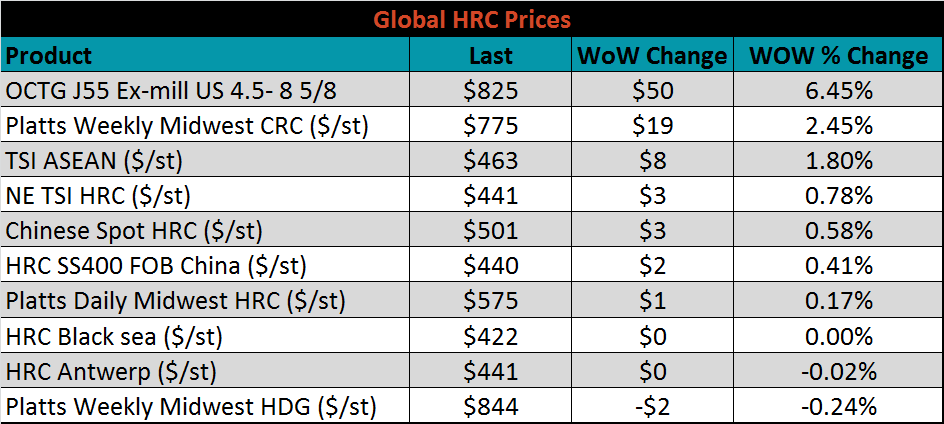
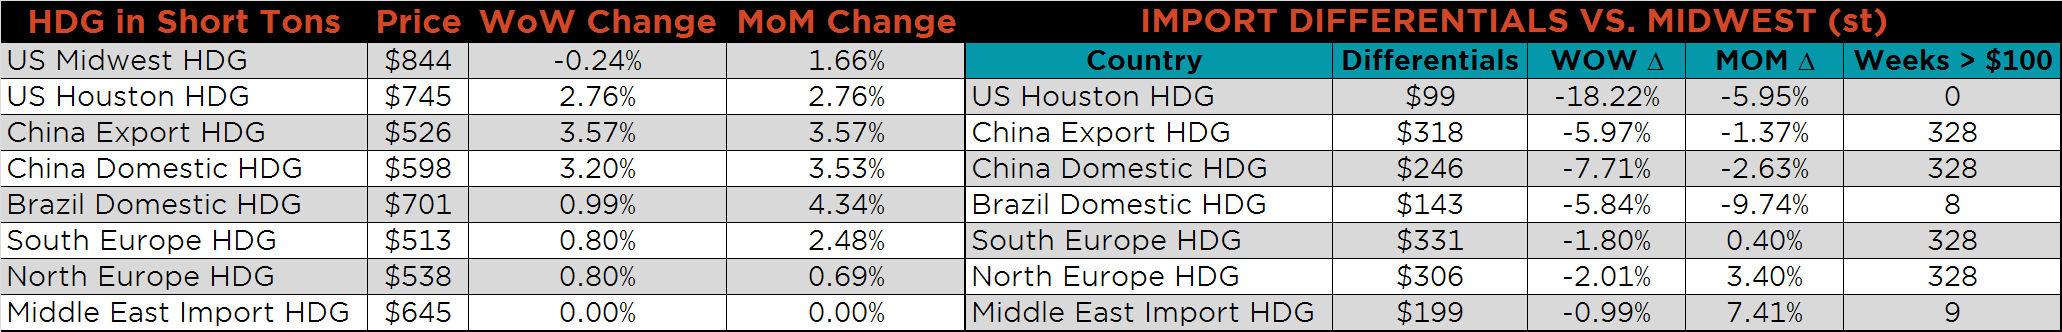
The global flat rolled indexes were mostly higher, led by TSI Midwest CRC, up 2.5%, while TSI Midwest HDG was down 0.2%.
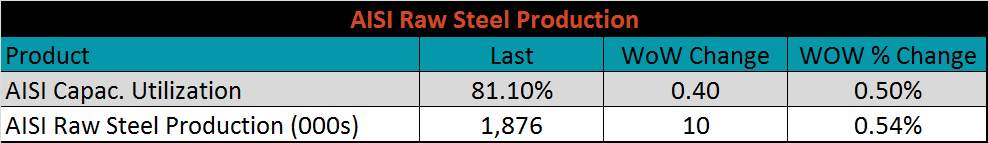
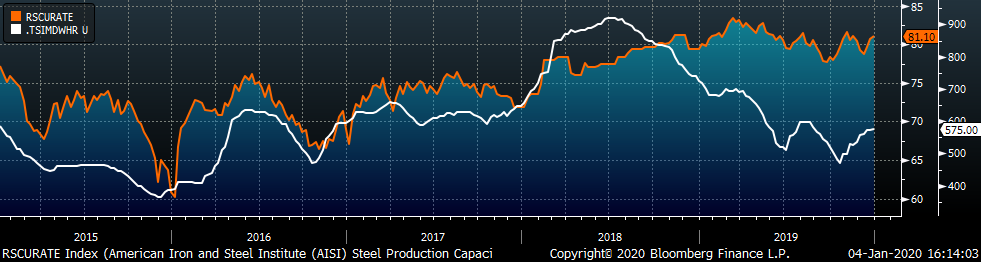
The AISI Capacity Utilization Rate was up 0.4% to 81.1%. The 80% goal set by the Trump administration should continue to hold as order books appear strong enough to support high production levels.
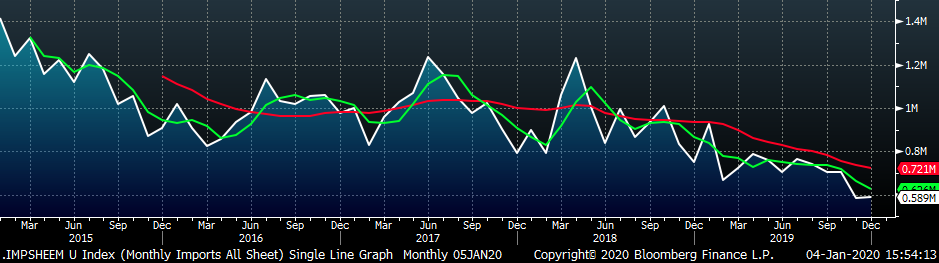
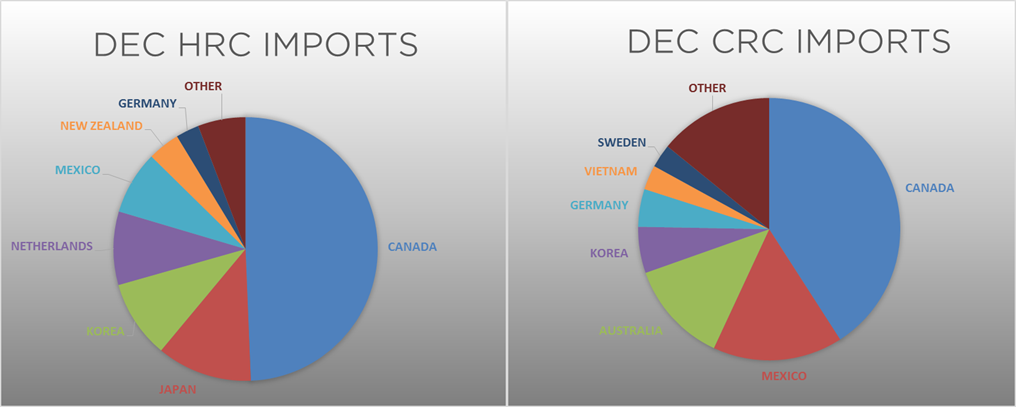
December flat rolled import license data is forecasting an increase of 6k to 589k MoM.
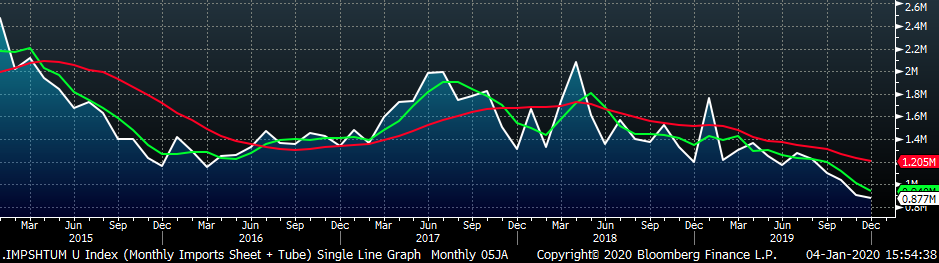
Tube imports license data is forecasting a MoM decrease of 13k to 288k tons in December.

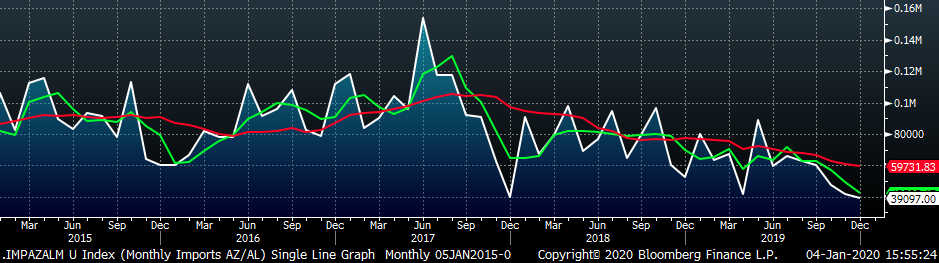
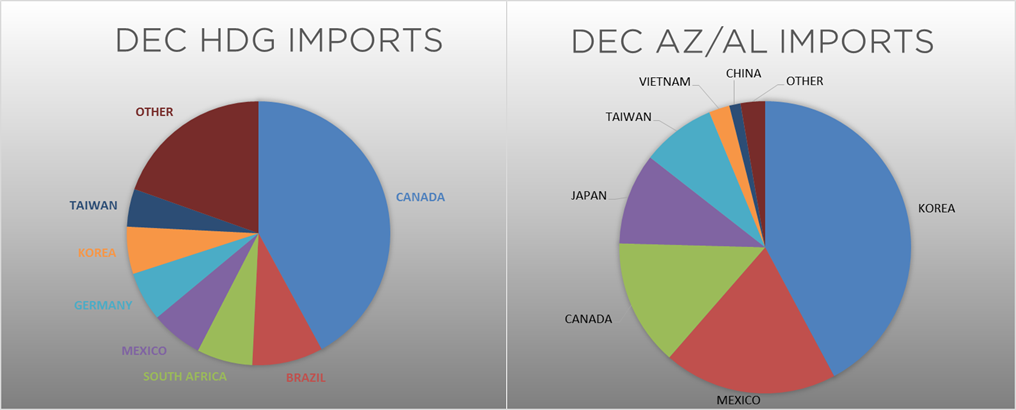
AZ/AL import license data is forecasting a decrease of 4k in December to 39k.
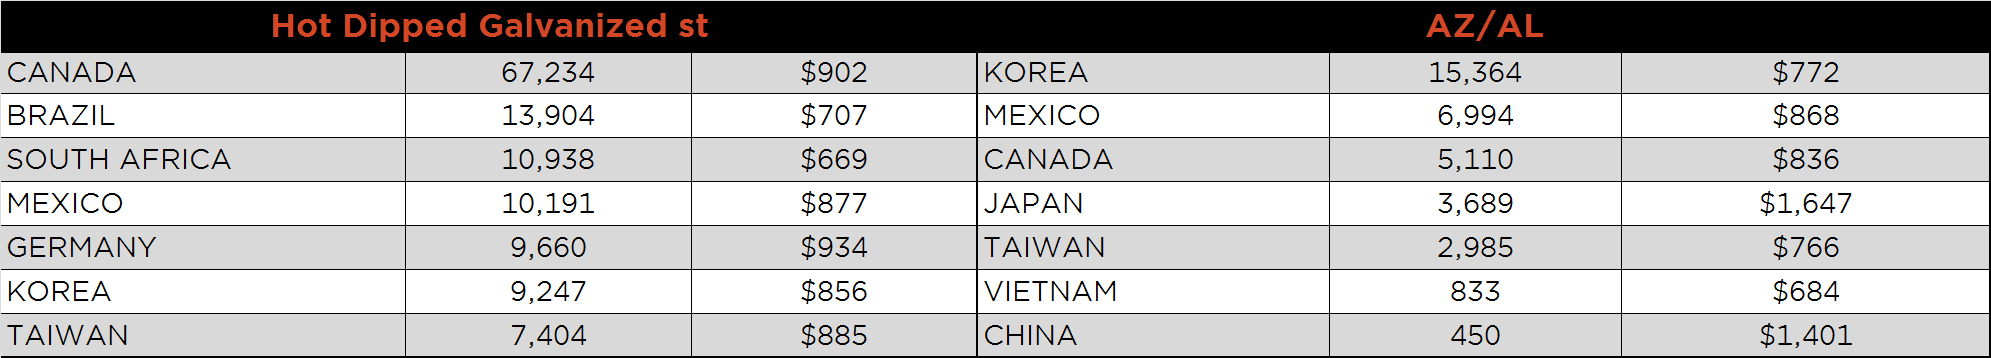
Below is December import license data through December 31, 2019.
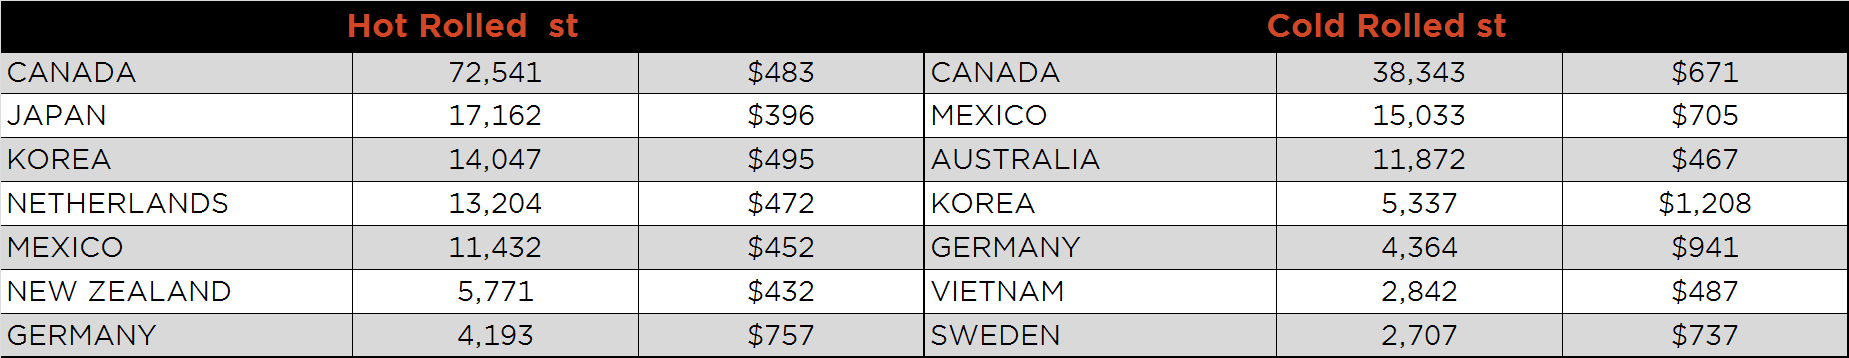
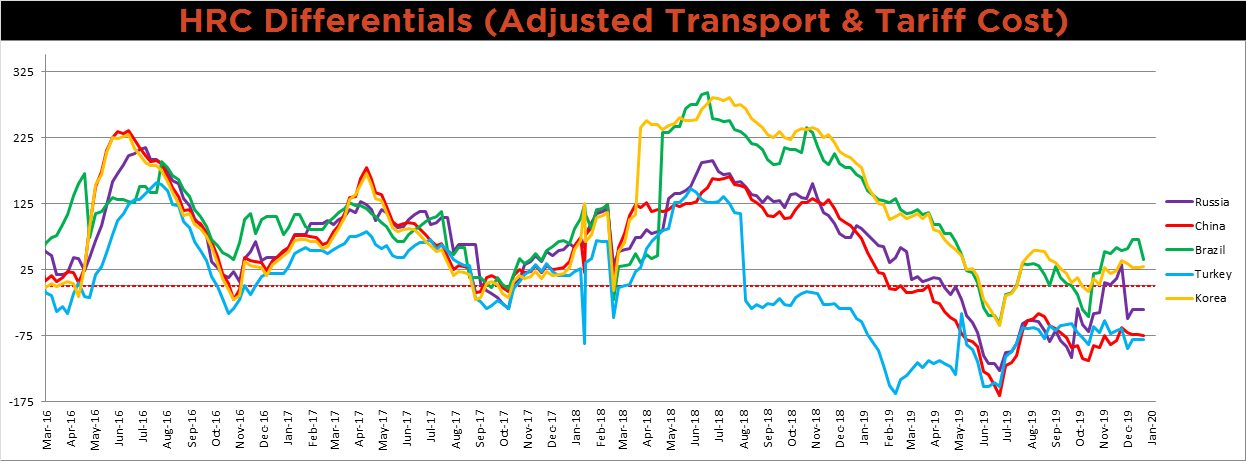
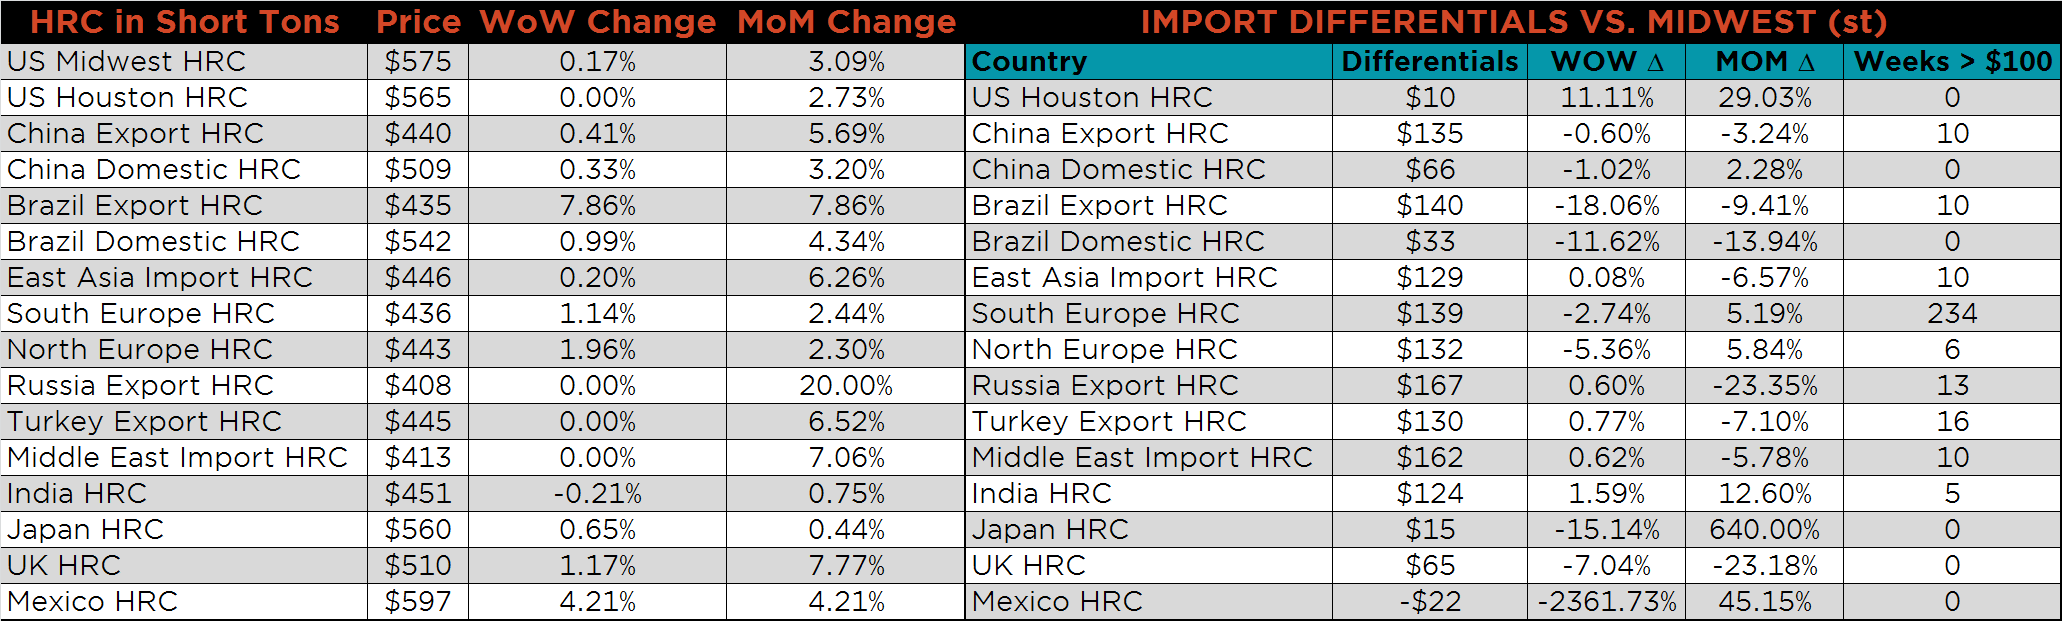
Below is the Midwest HRC price vs. each listed country’s export price using pricing from SBB Platts. We have adjusted each export price to include any tariff or transportation cost to get a comparable delivered price. Prices changed very little over the last few weeks.
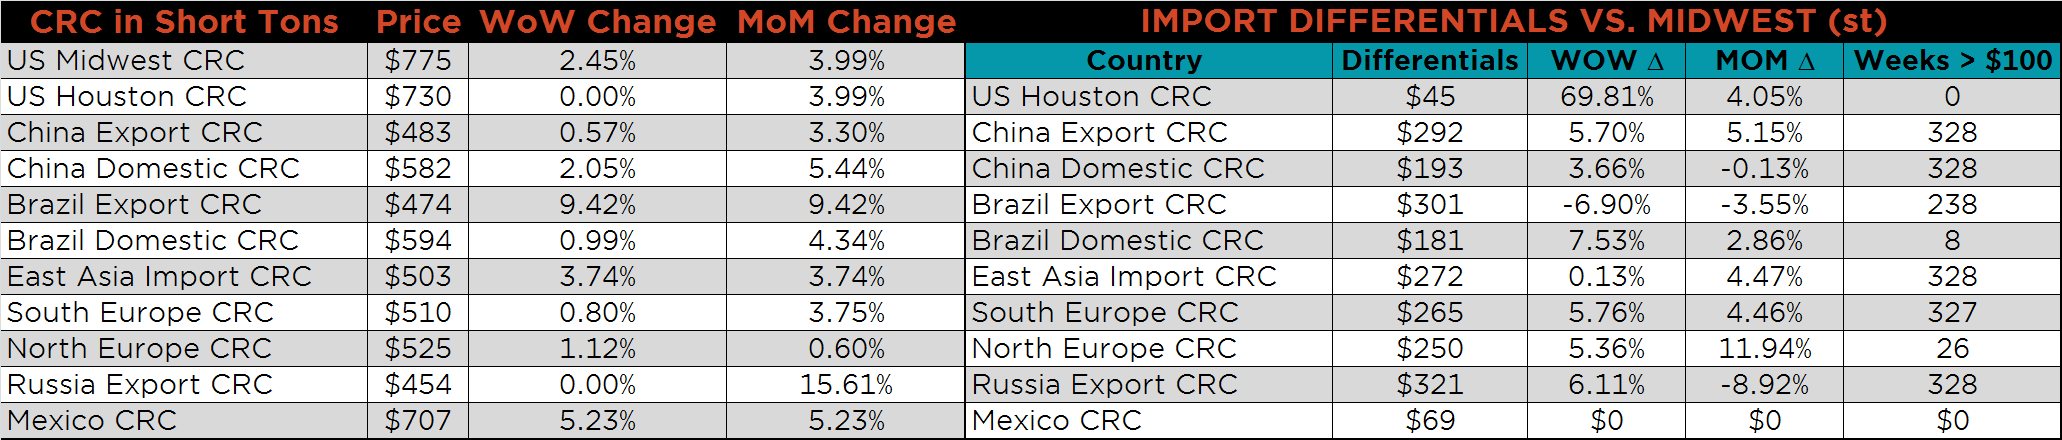
SBB Platt’s HRC, CRC and HDG pricing is below. The Midwest CRC and HRC prices were up, 2.5% and 0.2% respectively, while HDG was down 0.2%. Globally, the Brazilian CRC and HRC export prices were up, 9.4% and 7.9%, respectively.
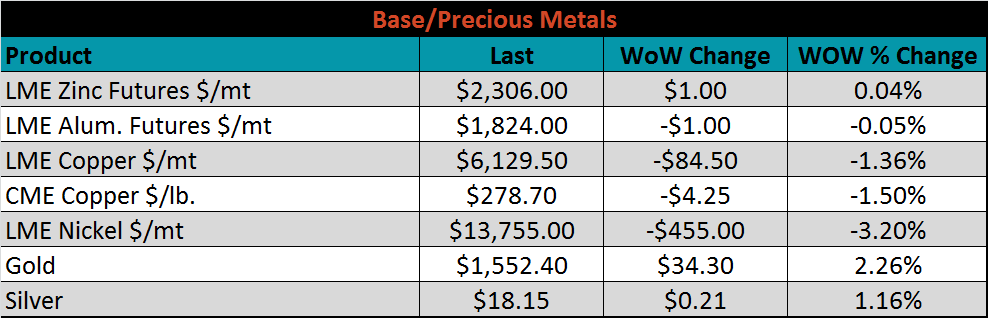
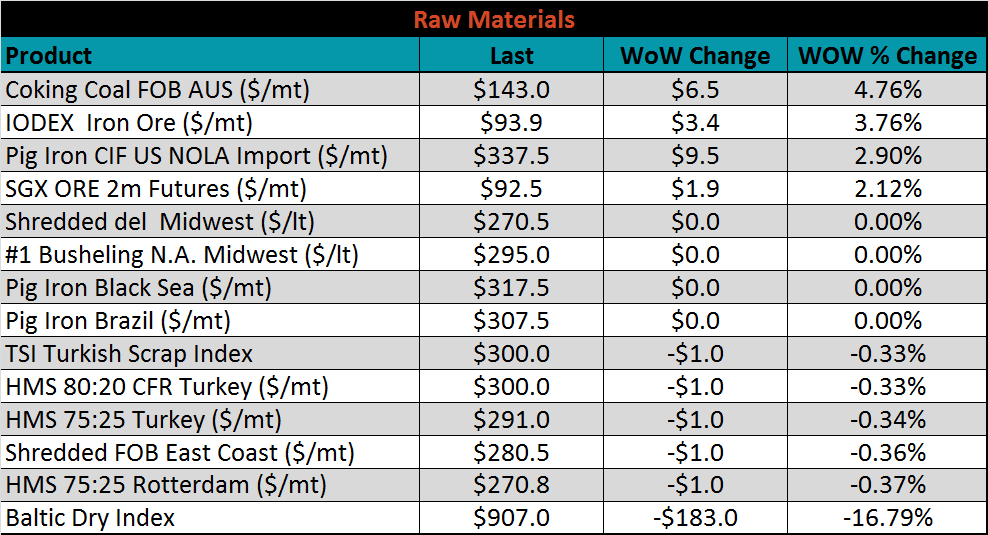
Raw material prices were mixed. Australian coking coal was up 4.8%, while Rotterdam HMS was down 0.4%.
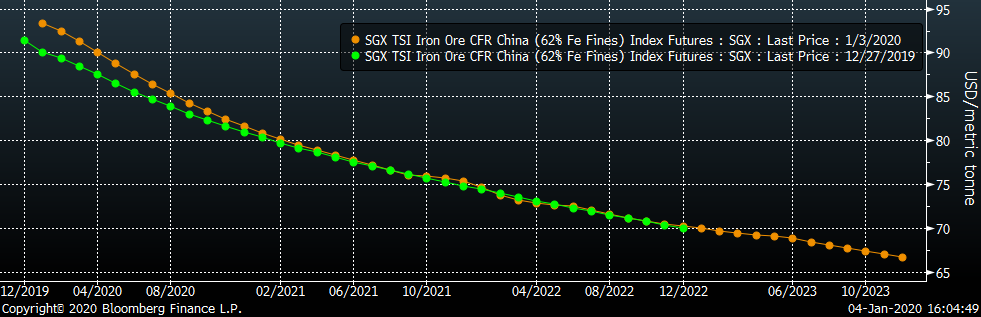
Below is the iron ore future curve with Friday’s settlments in orange, and the prior week’s settlements in green. The curve shifted higher.
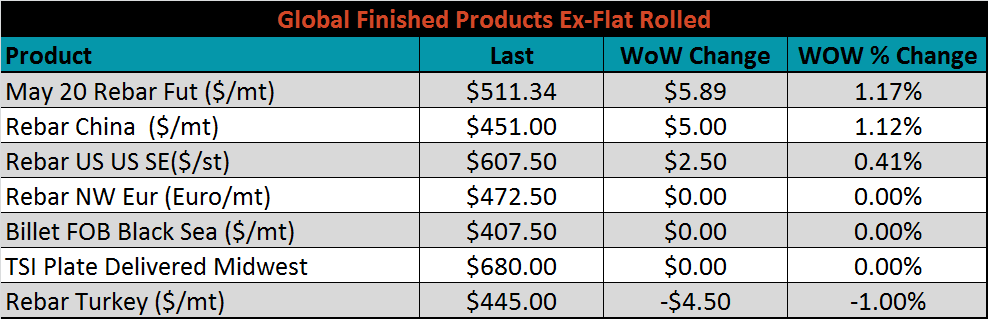
The ex-flat rolled prices are listed below.

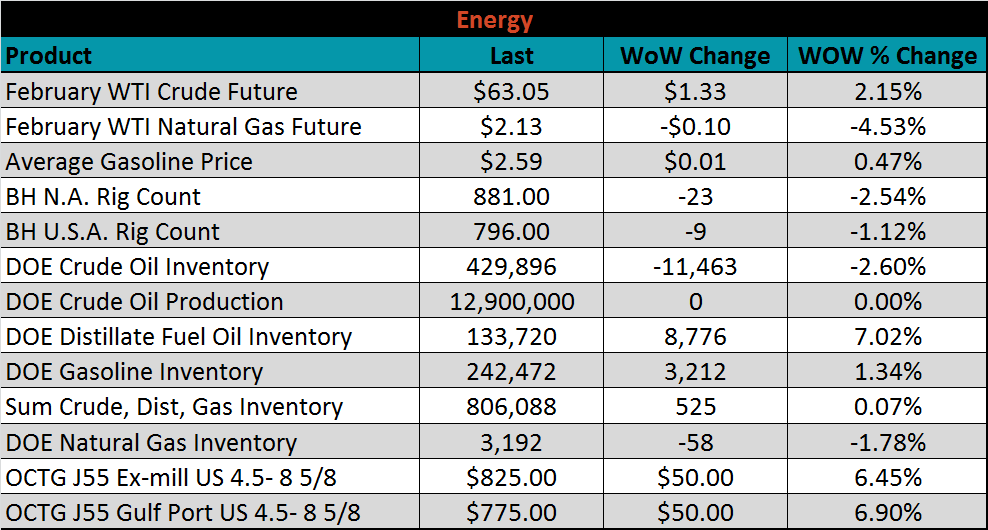
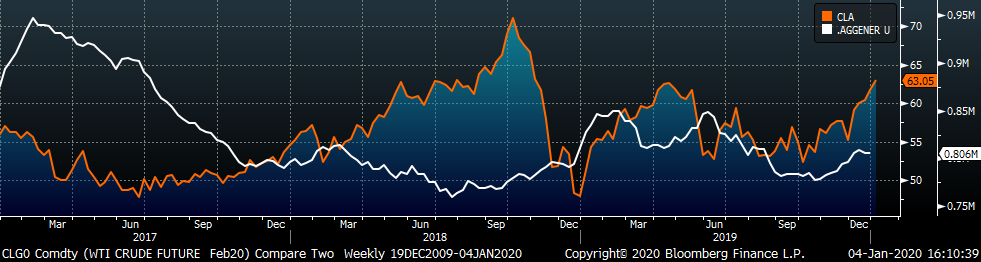
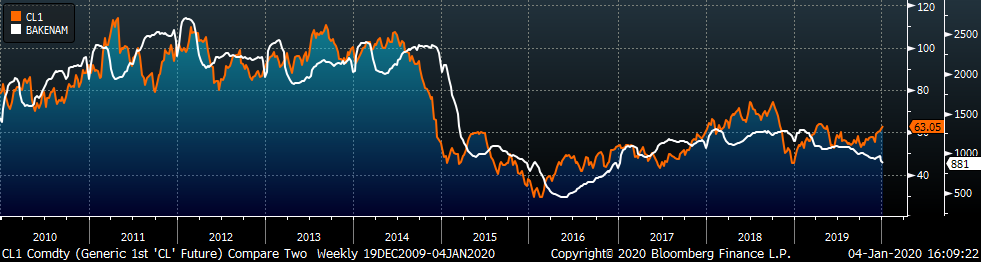
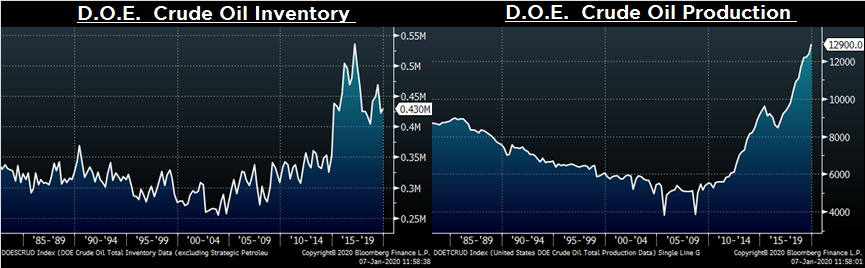
Last week, the February WTI crude oil future gained $1.33 or 2.2% to $63.05/bbl. The aggregate inventory level was up 0.1% and crude oil production remains at 12.9m bbl/day. The Baker Hughes North American rig count was down twenty-three rigs while the U.S. rig count was down nine.
The list below details some upside and downside risks relevant to the steel industry. The orange ones are occurring or look to be highly likely. The upside risks look to be in control.
Upside Risks:
Downside Risks: