Content
-
Weekly Highlights
- Market Commentary
- ISM PMI
- Auto Sales
- Global PMI
- Risks


The following issues provide the foundation of our view:
While last month’s economic data was mixed leaving some uncertainty about how Q1 would start for the steel industry, the price action and latest data have clarified that flat rolled prices have moved into a bear market. Some define a bear market as one that is simply down 20% from its highs. A more nuanced definition includes the following description:
As you will see below, our caution is no longer in question, after prices have fallen over $100 since Thanskgiving. Now, the focus turns to how the following weeks and months unfold.
The reason for the sharp mid-year turnaround and subsequent collapse in price and demand could be due to any number of factors such as increased supply, demand destruction, slowing growth, the downside of the business cycle, the Federal Reserve’s monetary tightening policy/higher interest rates and President Trump’s disruptive trade policy. While we won’t fully know the “why” for months to come, we do know steel fundamentals have turned precipitously worse.
There is a common pattern across a broad based group of commodity prices and economic indicators breaking sharply below their long-term multi-year uptrends.
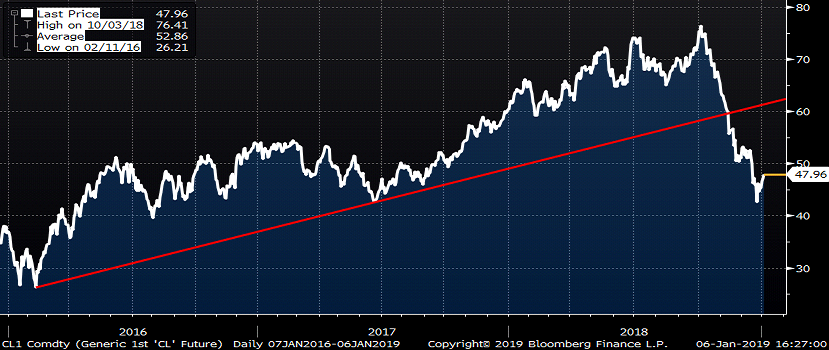
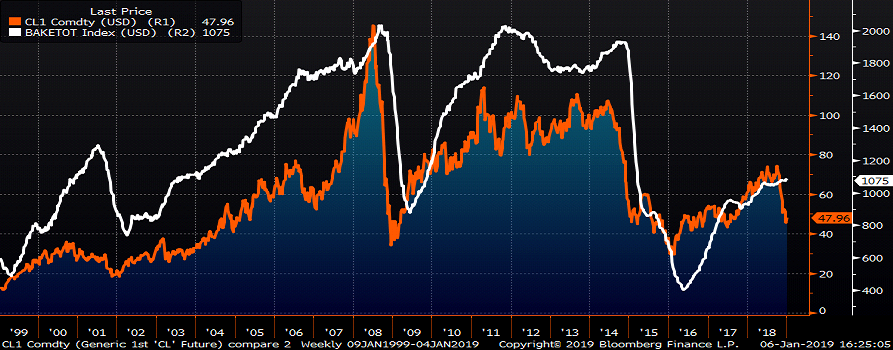
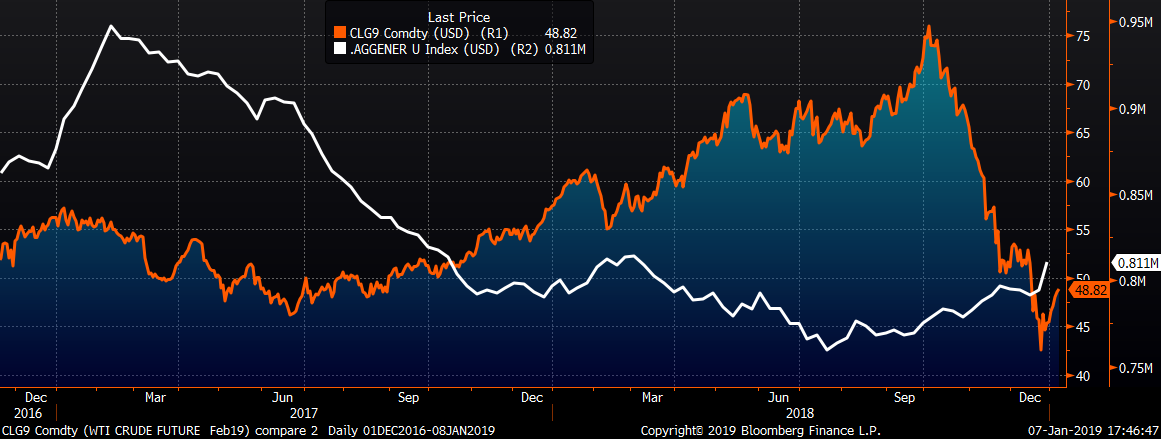
This is of concern not only because it indicates weaker economic demand and inflation, but also forecasts a sharp drop in rig counts in the coming months, which will translate into weak demand for energy related steel products. As you can see in the chart below, the rig count has a strong lagged correlation with the oil price.
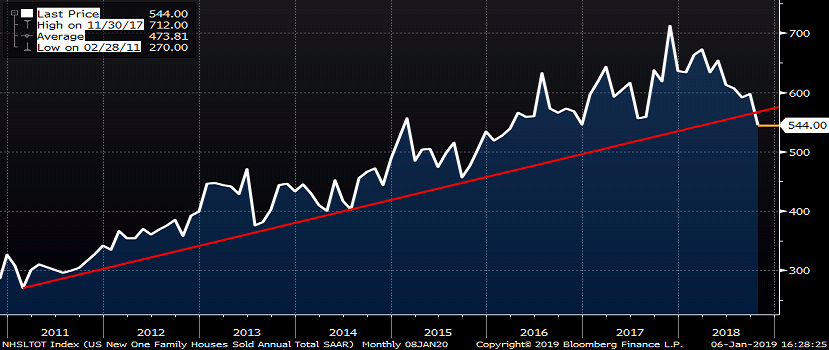
This chart of U.S. new home sales is another example of the above-mentioned pattern forcibly breaking below its almost eight-year uptrend.
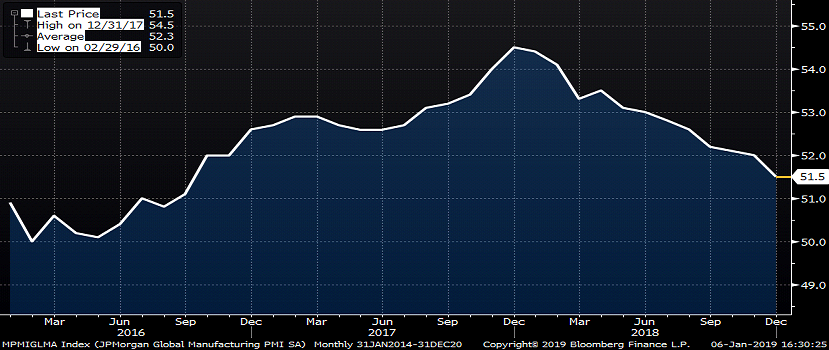
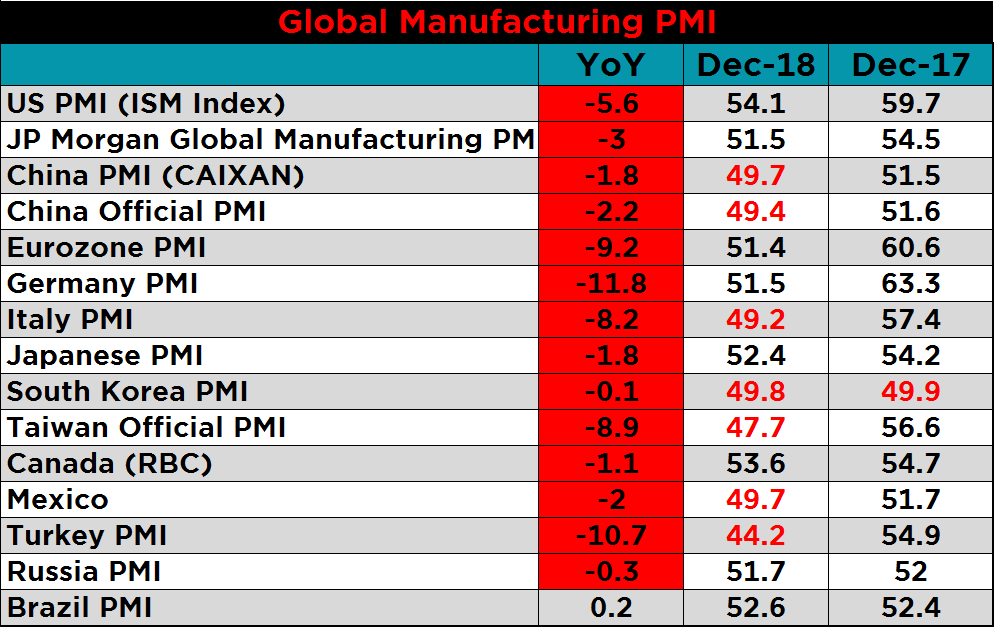
Economies had been growing in unison since the bottom in 2016 gaining momentum throughout 2017. However, that peaked at the turn of 2018 and the global manufacturing PMIs have been trending lower ever since.
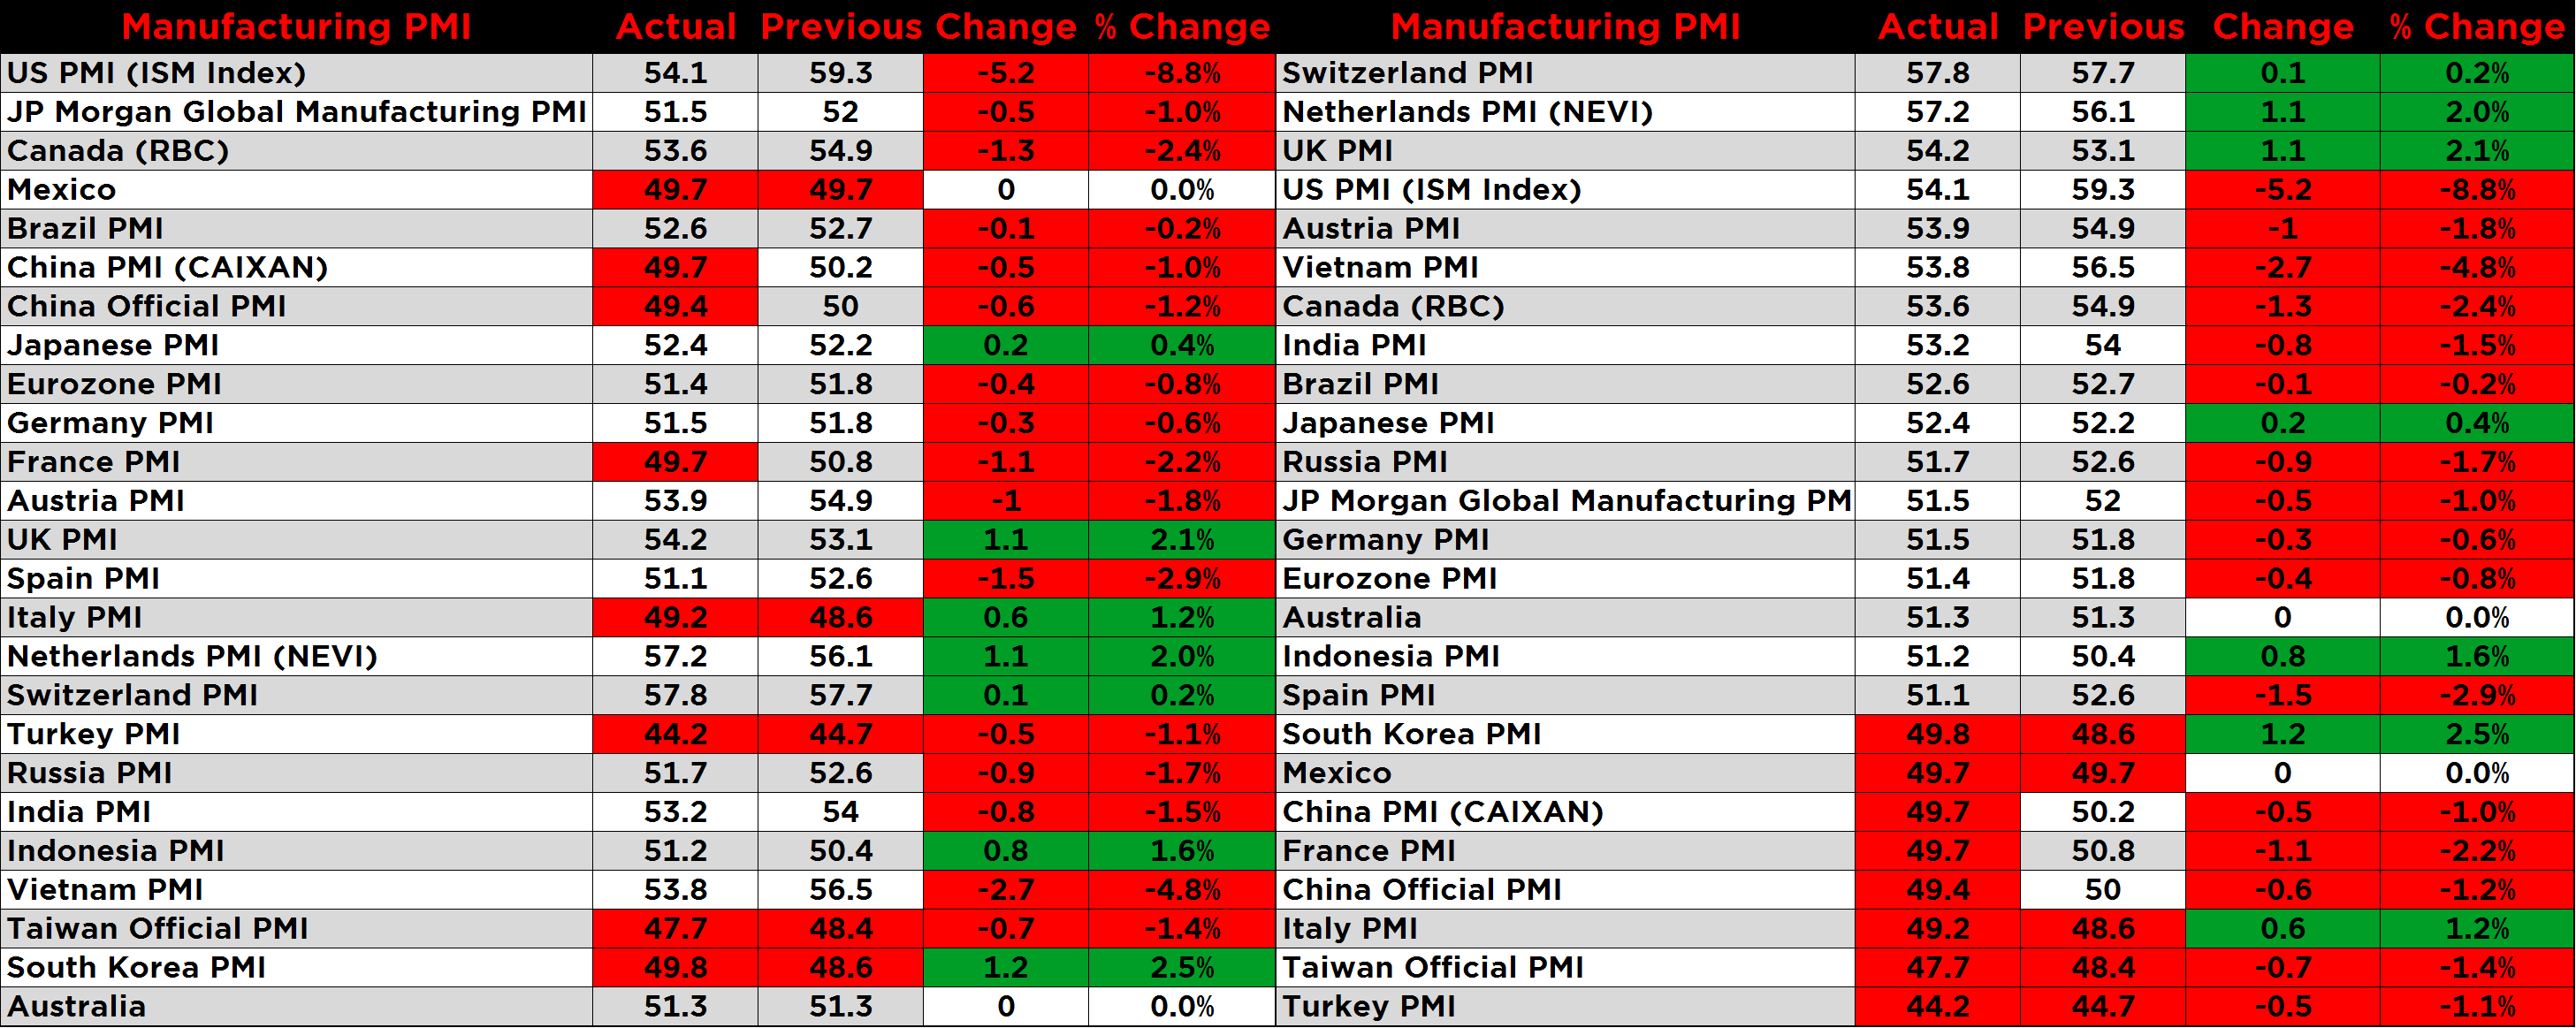
The most recent manufacturing PMI’s showed the majority of countries took continued lower in December including seven countries now with a PMI in contraction territory below 50. This table shows a number of countries with a sharp YoY drop in their manufacturing PMI.
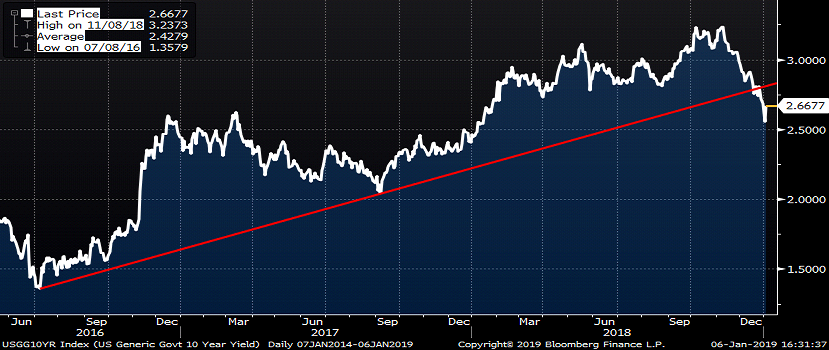
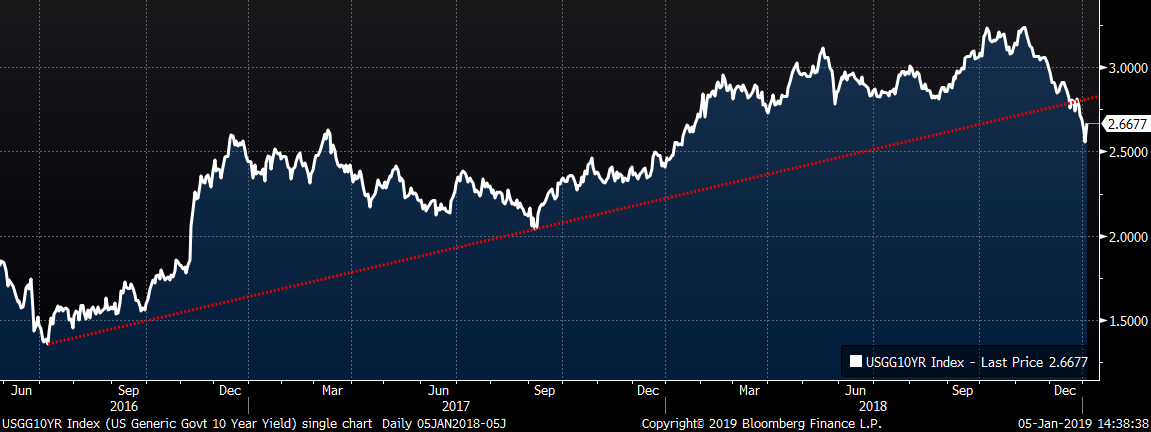
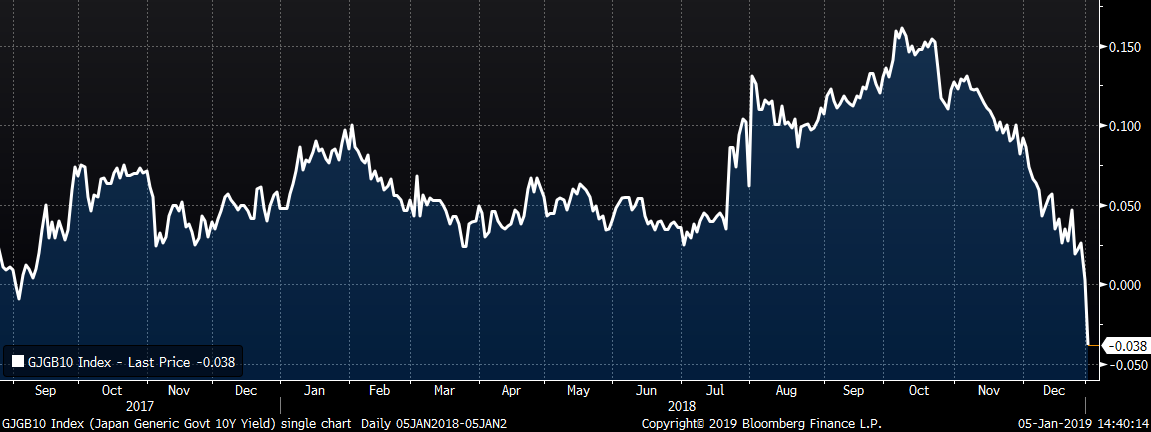
The U.S. ten-year treasury yield is yet another example of this pattern indicating a reversal of the animal spirits unleashed following the election has occured. Risk aversion has spread across financial markets with undertones of deflationary pressures starting to percolate best evidenced by the Japanese 10-year treasury yield now in negative territory.
The following six regional manufacturing reports precede the ISM PMI. All six were lower, with the bottom four surprisingly weak. All of them are lower YoY, four of them moved much lower.

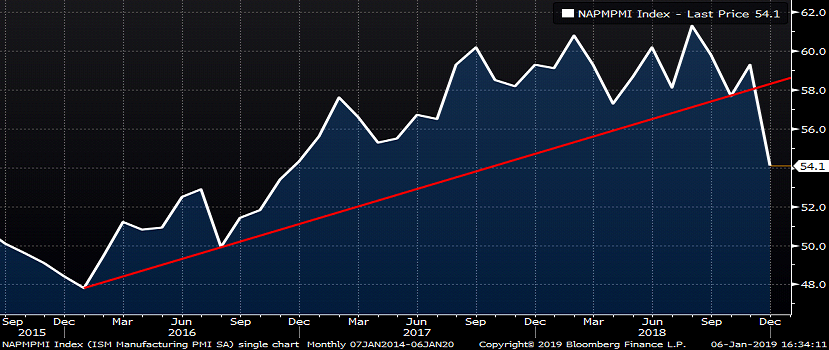
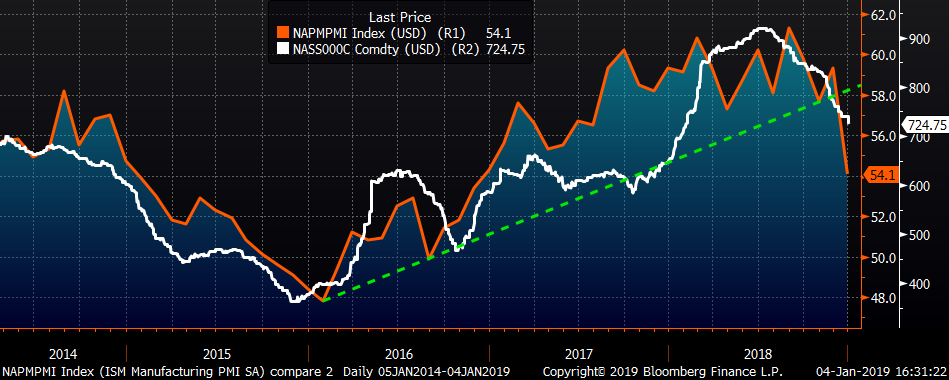
FGM has been closely following these regional manufacturing indexes throughout December; forecasting a downside surprise in the ISM Manufacturing PMI on my twitter account @TheFeldstein. However, the ISM exceeded even my most bearish expectations falling 5.2 points to 54.1. A deep dive into the ISM PMI is below, but the sharp drop in the PMI is yet another example of a sharp break below a long term uptrend. Charts patterns are indicators at best and can be unreliable, but when you see sharp moves like this and this pattern repeated across multiple industries, it becomes much more meaningful. If the uptrend is over, then it is a downtrend.
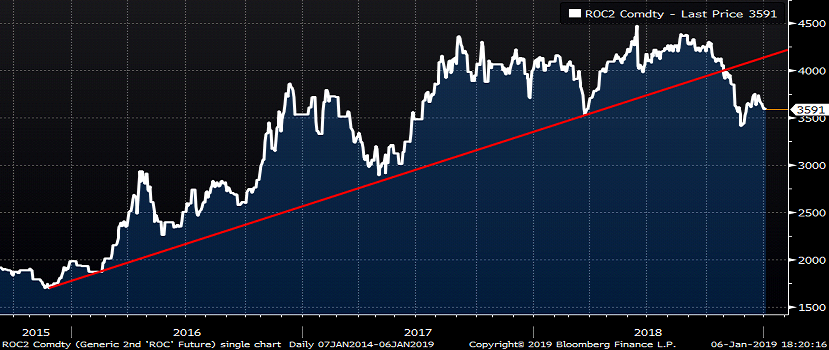
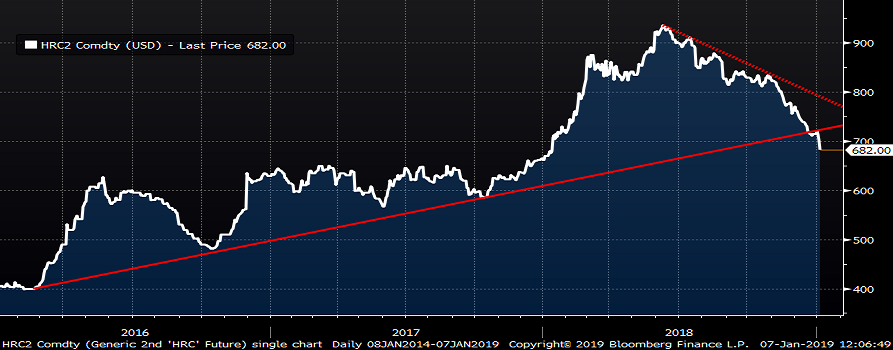
The next two charts are further examples of this pattern, the first being the 2nd month Chinese HRC future and the second the Chinese HRC spot price.
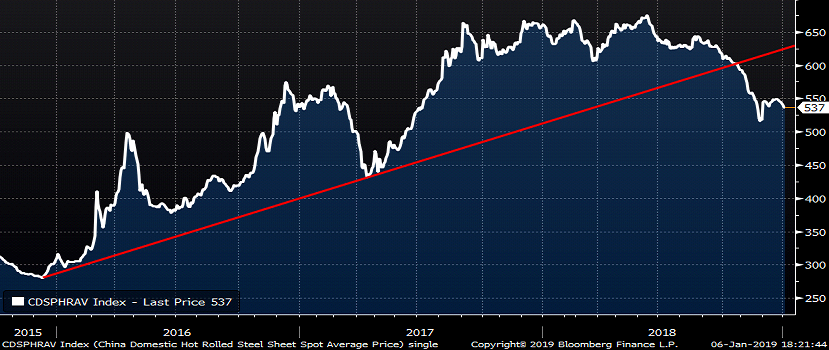
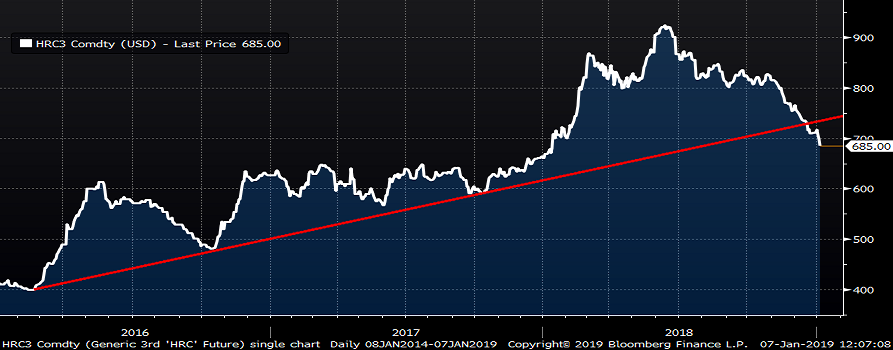
Finally, we see the pattern in the 2nd and 3rd month CME HRC futures.
The last chart to go is the Platts TSI Midwest HRC index. Late last week, the index fell 14 points to 726 closing in on the uptrend line. Keep an eye on the $715 level.
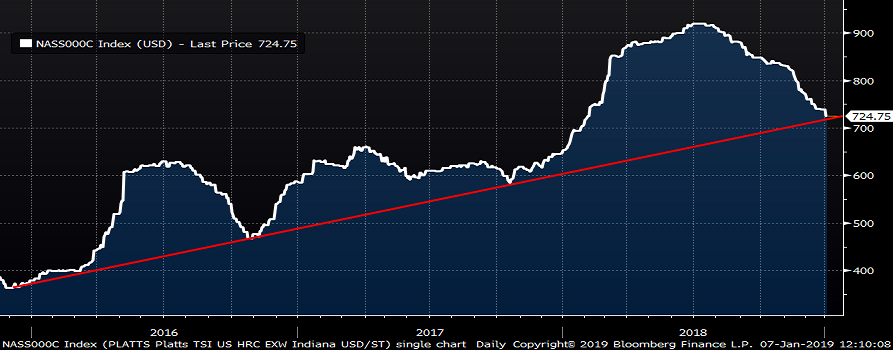
While the drop from $900 to $700 has been huge, these charts indicate HRC prices failed to find support in the low $700s and are closer to the second stage of the sell-off than to finding a short-term bottom. Typically, when prices break below a support level, they have to fall significantly to a level buyers see the value being attractive enough to assuage their fears while those enduring losses panic and overshoot “rational” values.
“The market can stay irrational longer than you can stay solvent”
“The cure for low prices is low prices.”

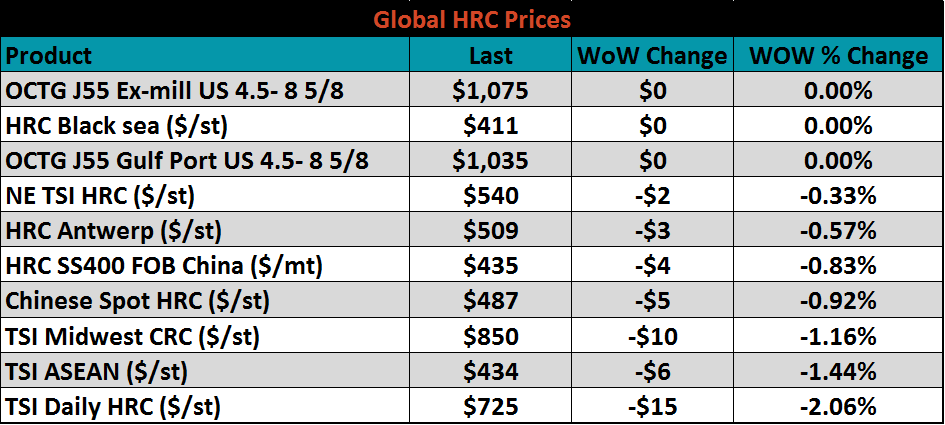
The December ISM Manufacturing PMI fell 5.2 points to 54.1 and missing downwardly revised expectations of a drop to 57.5. The Platts TSI Daily Midwest HRC Index fell $15.25 to $724.75.
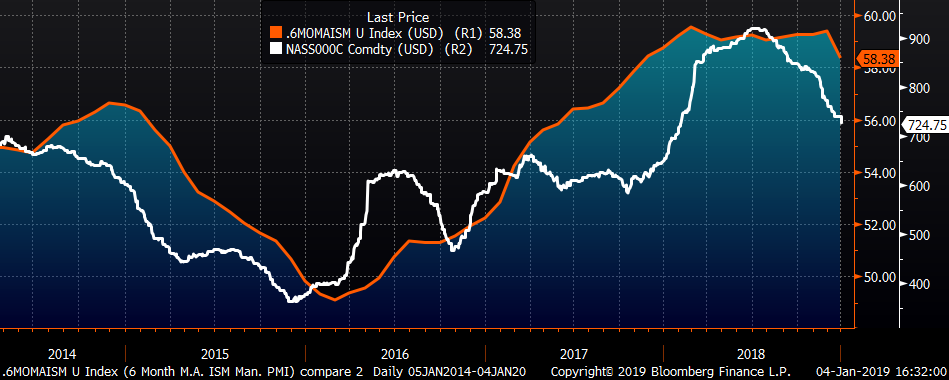
The ISM Manufacturing PMI six-month moving average dropped a full point to 58.38.
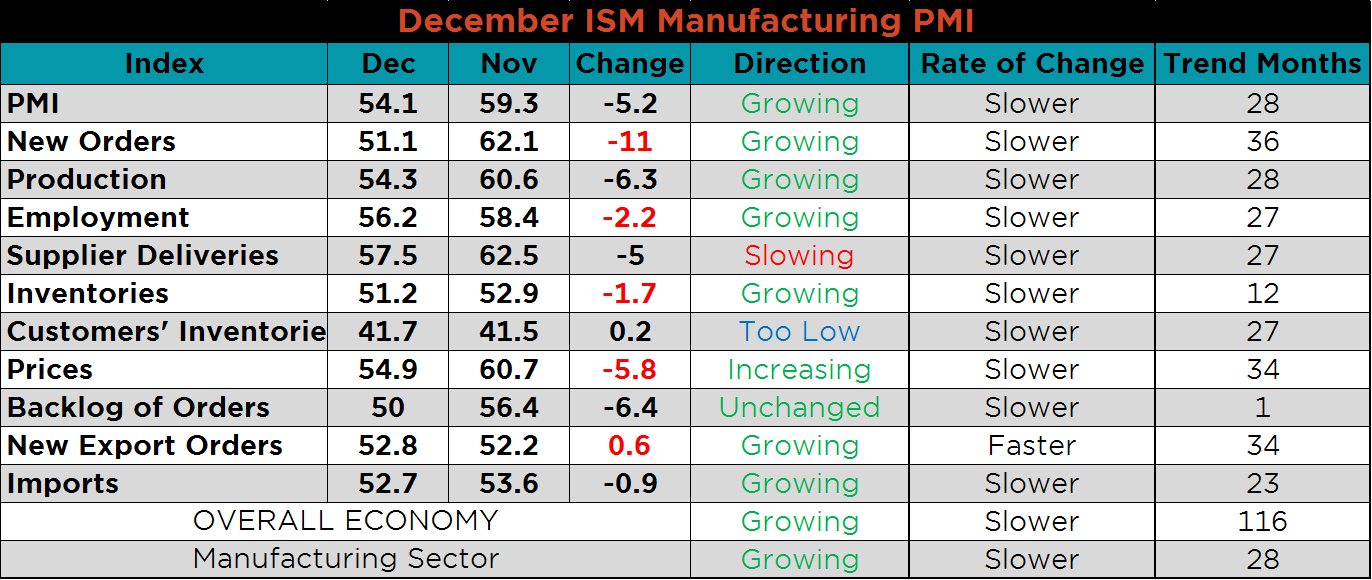
The significance of the drop in December’s ISM PMI should not be underestimated. The 5.2 point drop is the third largest drop going back to January 2000 (216 months). The 5.2 point drop is a 2.9 standard deviation move. The 11 point drop in the new orders subindex is the fourth largest drop going back to January 2000 and is a 3 standard deviation move. The 6.4 point drop in backlogs is the fourteenth largest drop back to January 2000 being only a 1.7 standard deviation move, but adding the new orders and backlog together, there was a 17.4 point drop, the third largest drop and a 2.6 standard deviation move.
The ISM Manufacturing PMI printed at the second lowest level for the month of December going back five years.

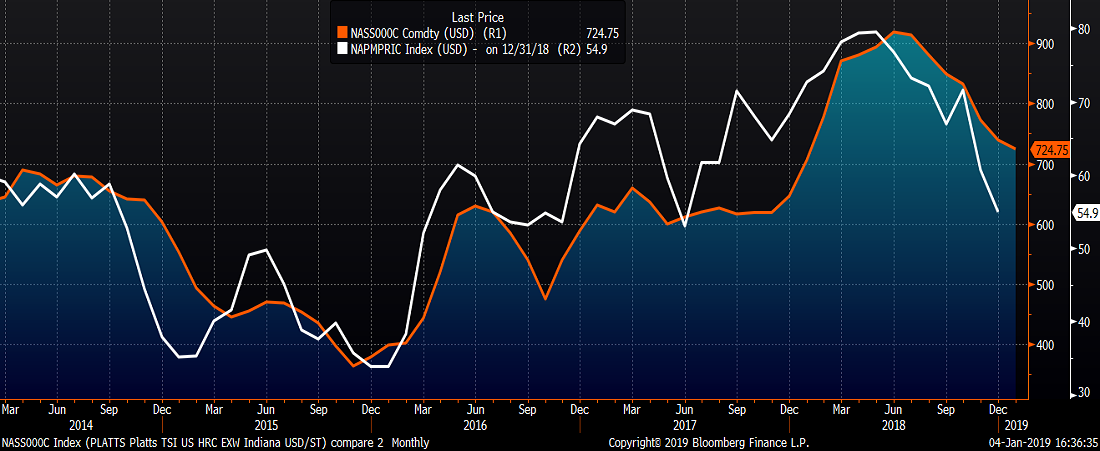
The next two charts compare the ISM new orders subindex and ISM prices subindex with the Platts TSI Daily Midwest HRC Index. Both ISM subindexes have a solid correlation with the hot rolled price indicating another leg lower is coming for hot rolled.
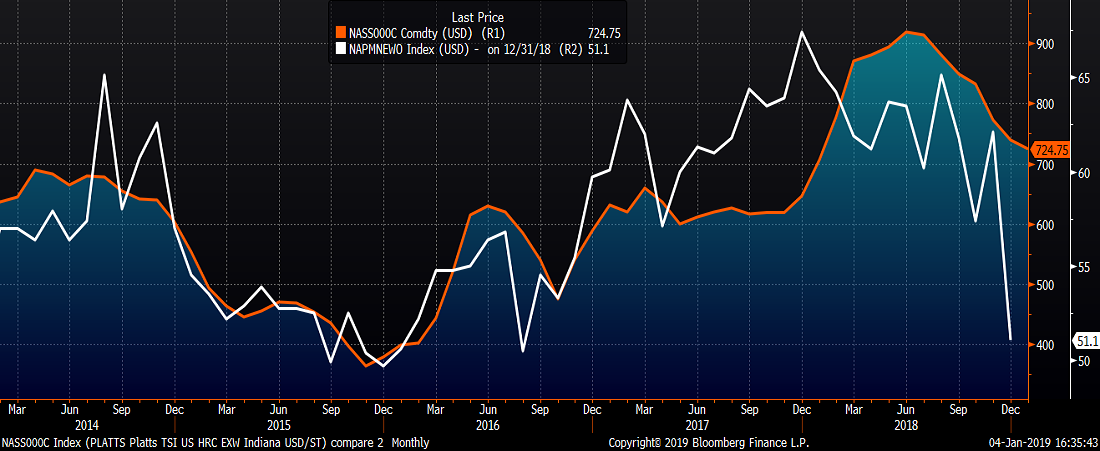
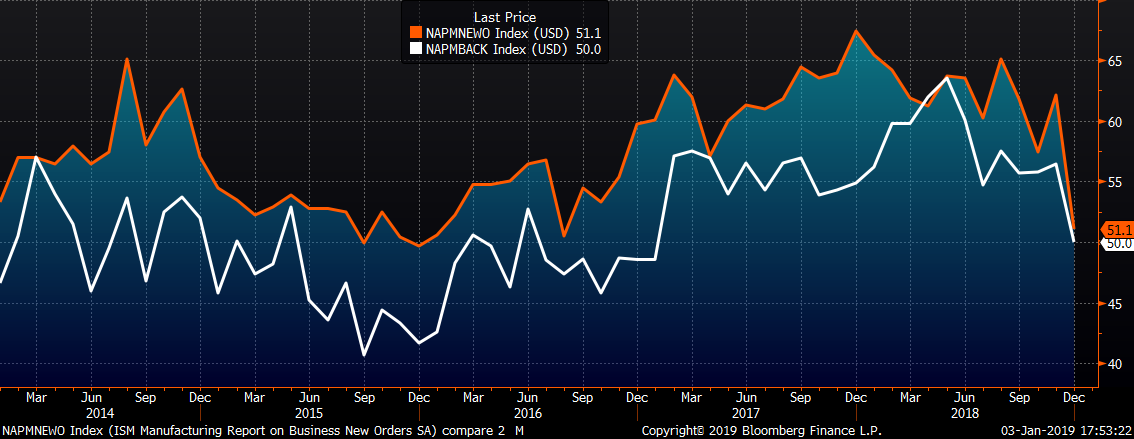
The December ISM new orders subindex fell 11 points to 51.1 while the backlog subindex fell 6.4 points to 50. This is a bold statement indicating something is very wrong with demand.
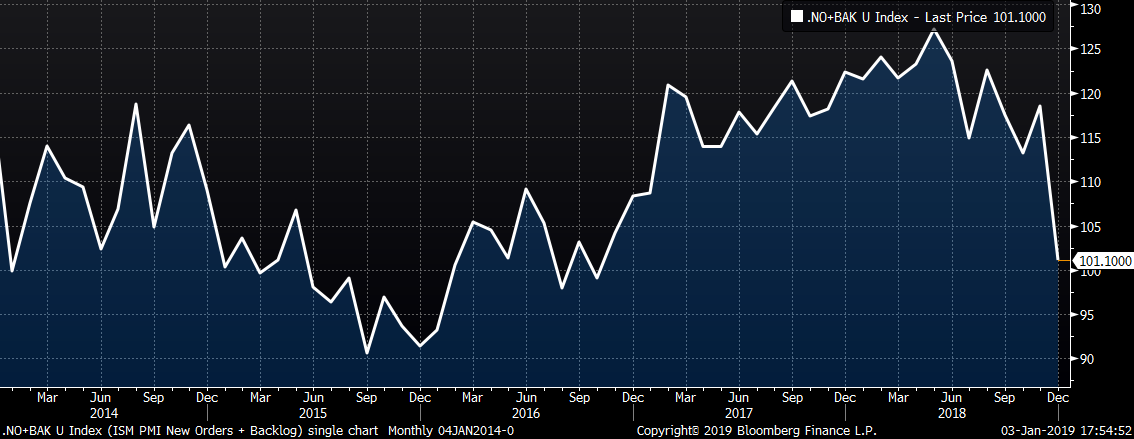
This chart adds the new orders and backlog subindexes, printing at its lowest level since October 2016.
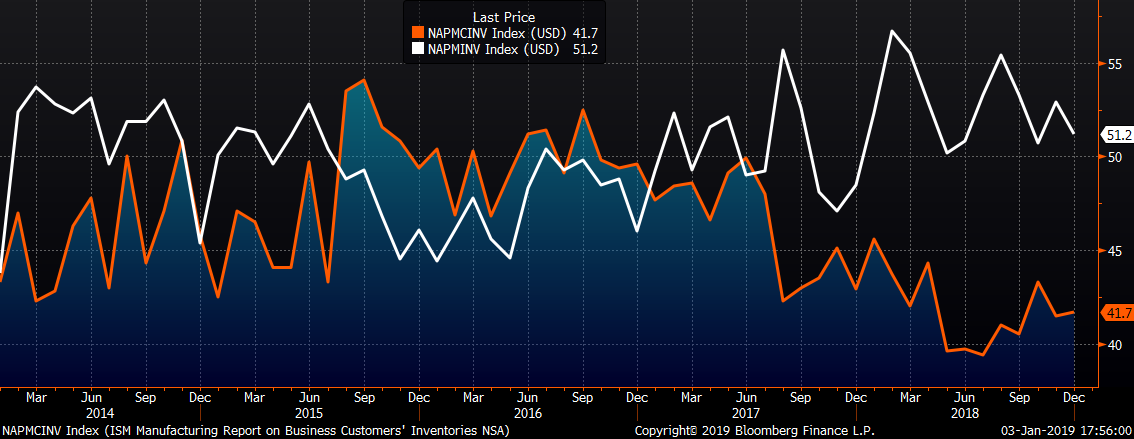
The chart below shows the producer inventory subindex decreasing 1.7 points to 51.2, while the customer inventory subindex rose slightly to 41.7.
This table shows the monthly ISM PMI and subindexes back to December 2017. Most subindexes are down YoY with the new orders, production and prices subindexes down the most.

The table below shows the monthly ISM and regional PMIs back to December 2017. As discussed above, all of the regional reports are down MoM and YoY with the Dallas, Richmond and K.C. Fed and the Empire Manufacturing Index all falling to their lowest levels since July 2017.


Due to the government shutdown, a number of economic reports, including construction spending and unadjusted monthly auto sales, have been delayed.
December US light vehicle sales rose slightly to a 17.5m seasonally adjusted annualized rate (S.A.A.R).
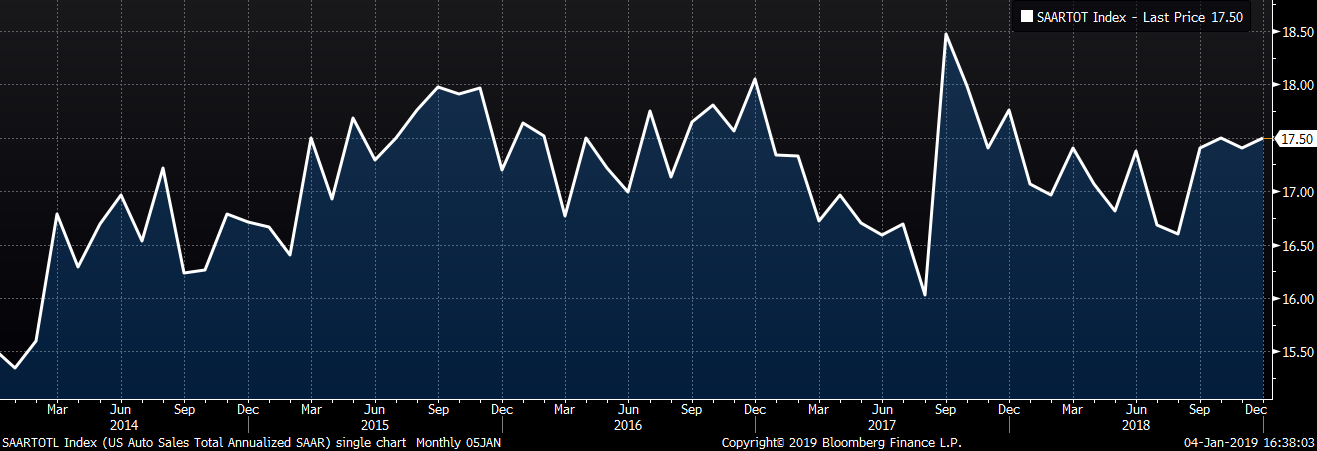
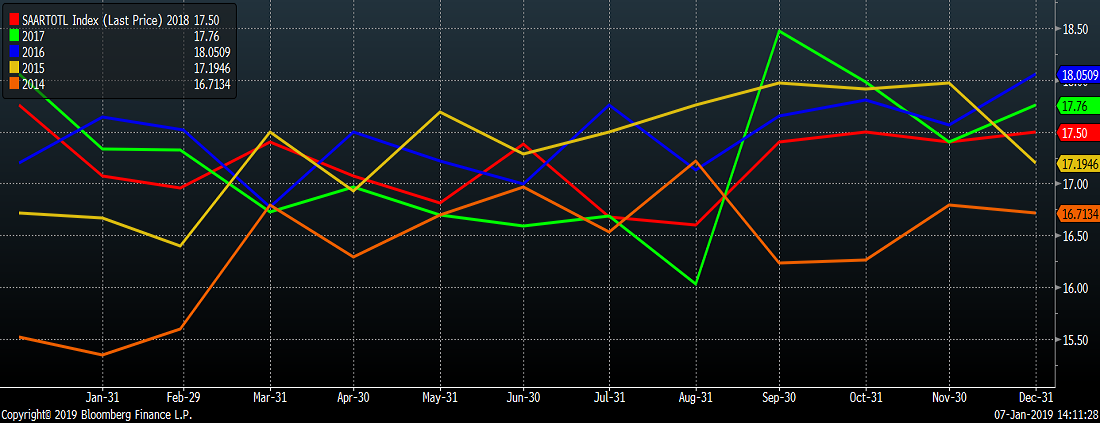
December US auto sales (S.A.A.R) was down 1.5% YoY.
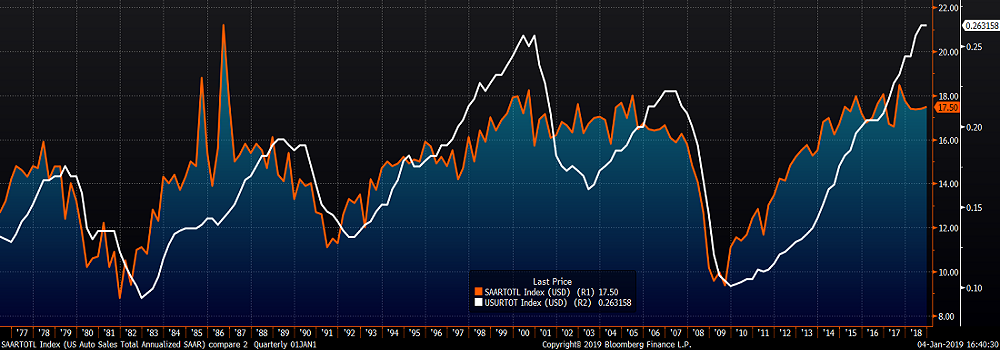
Auto sales remain range bound while the US unemployment rate remains near all-time lows.

December global purchasing manager indexes continued to decline with seven countries now in contraction. Moreover, those seven contracting countries include steel intensive China, South Korea, Taiwan, Mexico, Italy and Turkey. The JP Morgan Global Manufacturing PMI dropped 0.5 points to 51.5.
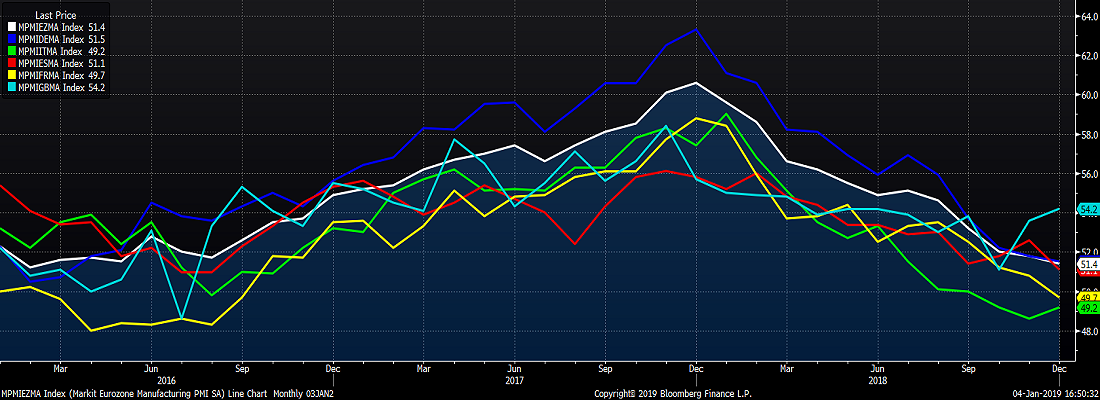
The overall downtrend in European PMIs continued in December. The PMIs of the Eurozone, Germany, Spain and France were lower, while the PMIs of Italy and the U.K. gained. Italy and France fell below 50.
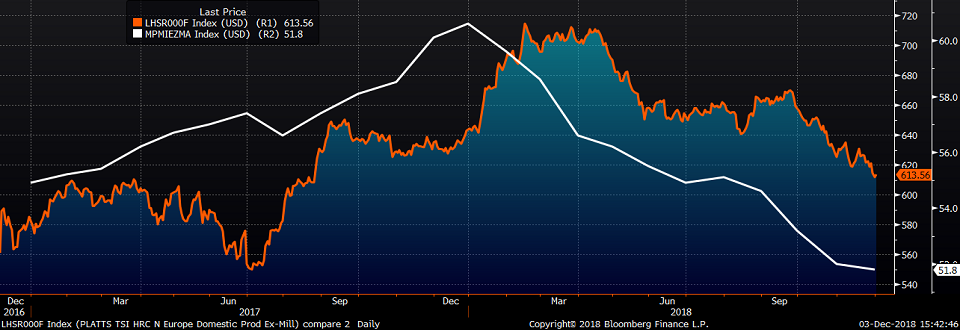
The chart below shows the Eurozone PMI and the TSI North European HRC Index continuing their long-term downtrend.
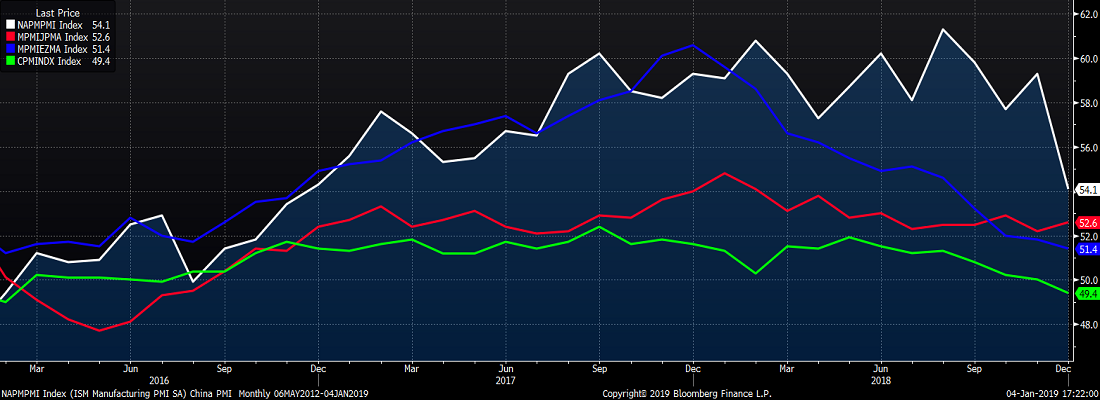
The PMIs of the U.S., Europe, and China were all lower, while Japan saw its PMI gain.
Both China’s official PMI and Caixan Manufacturing PMI fell below 50 into contraction territory. One of China’s largest exports over the past few years has been deflation. The saying “inflation is too much money chasing too few goods” was hammered into my brain during business school. So if inflation is too much money chasing too few goods, then is “too much goods chasing too few money” deflation? If so, China going into contraction indicates another round of deflation may be loading on to bulk vessels at ports across China. Pay close attention to prices of Chinese finished steel products, iron ore, coal and base metals in the coming weeks and months.
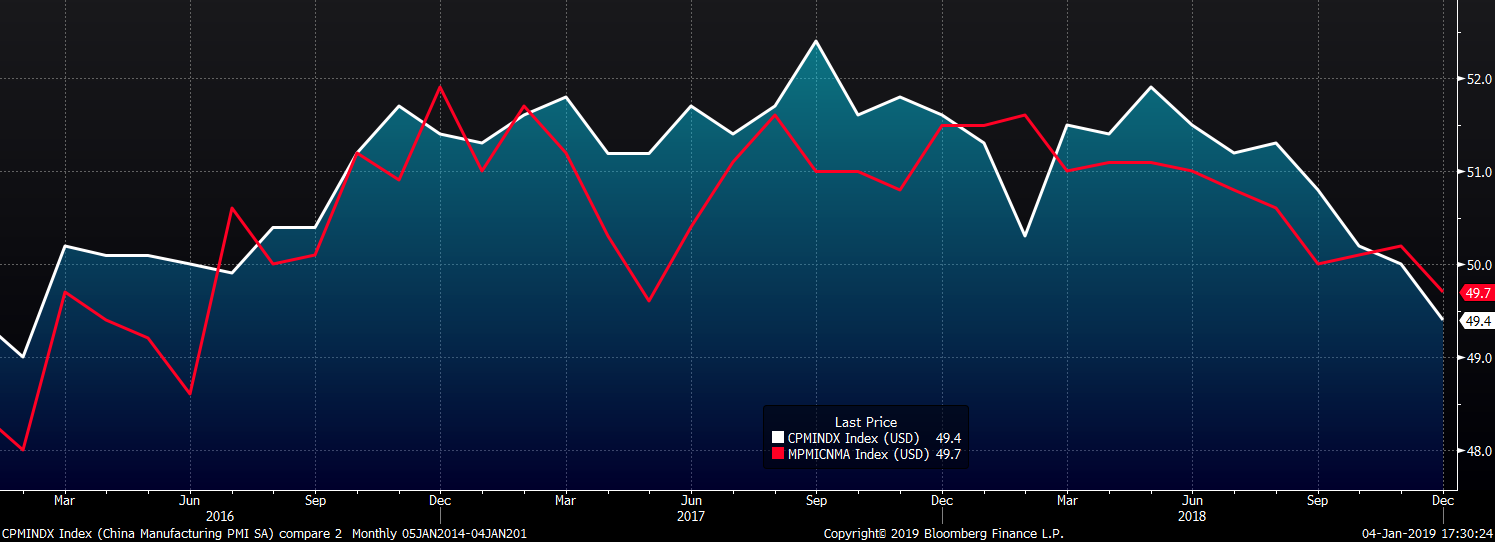
China’s official PMI printed at the lowest December level of the last five years.
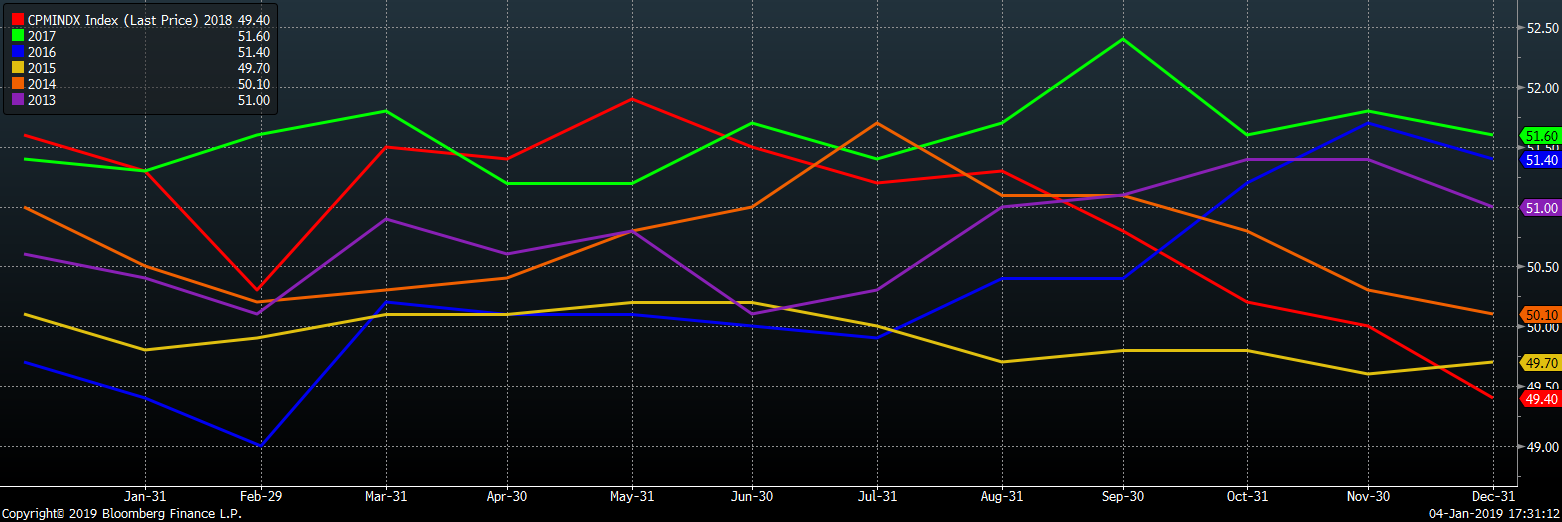
The table below breaks down China’s official manufacturing PMI subindexes. Ten of the thirteen subindexes are now in contraction with the official PMI and new orders subindex falling below 50 for the first time since February 2017 and January 2016, respectively.

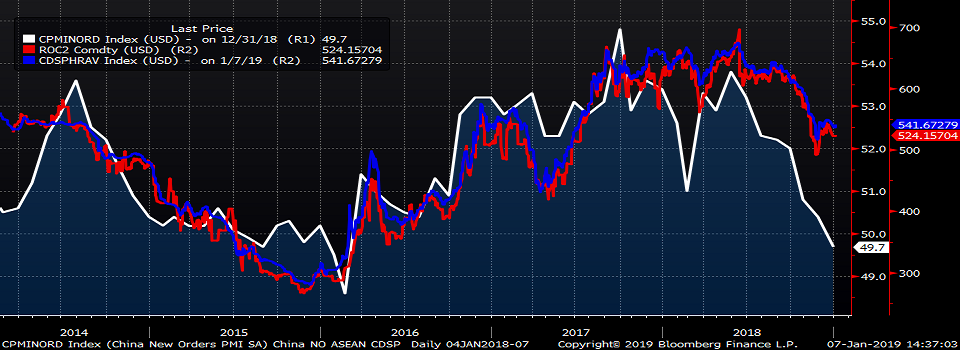
China’s new orders subindex fell into contraction indicating more room for the Chinese hot rolled price to fall.

Upside Risks:
Downside Risks:

The January CME HRC future decreased $5 to $717 and the Platts TSI Daily Midwest HRC Index was down $15.25 to $724.75.
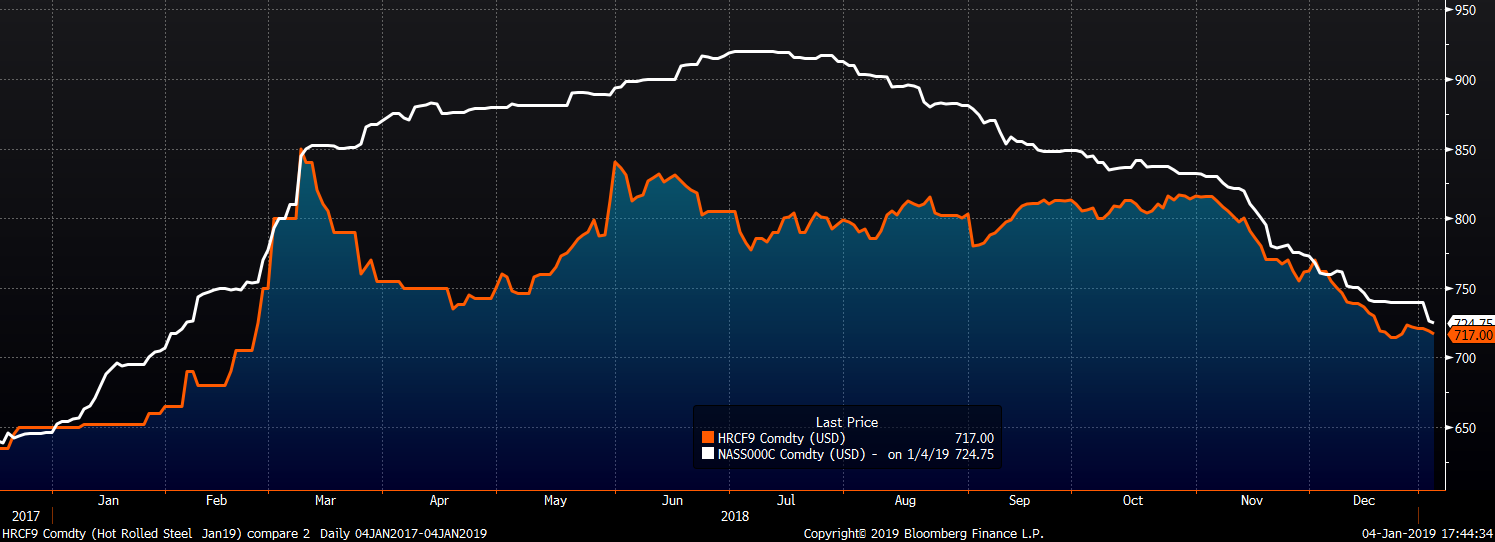
The CME Midwest HRC futures curve is below with last Friday’s settlements in orange. The curve was down sharply with the back end of the curve falling the most.

February ferrous futures are listed below. Australian coking coal and LME Turkish scrap futures saw losses of 9.6% and 4.2% respectively.
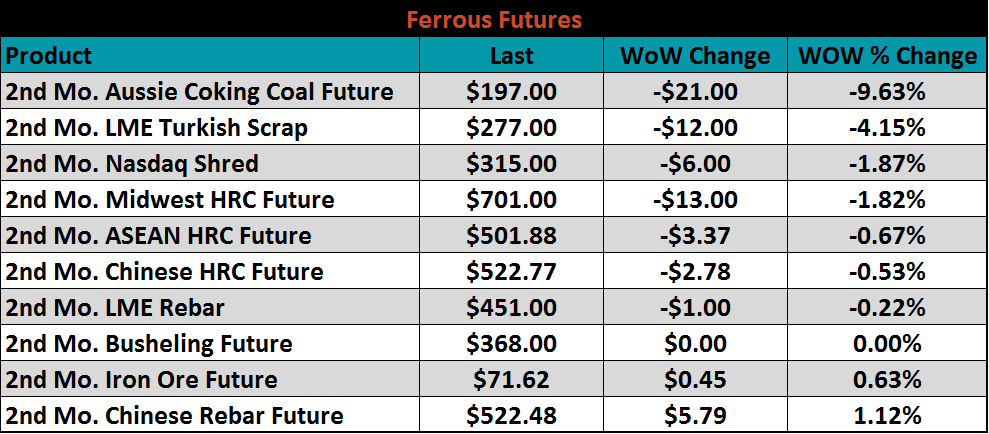
Flat rolled indexes were mostly lower. The Platts TSI Daily Midwest HRC fell 2.1%.

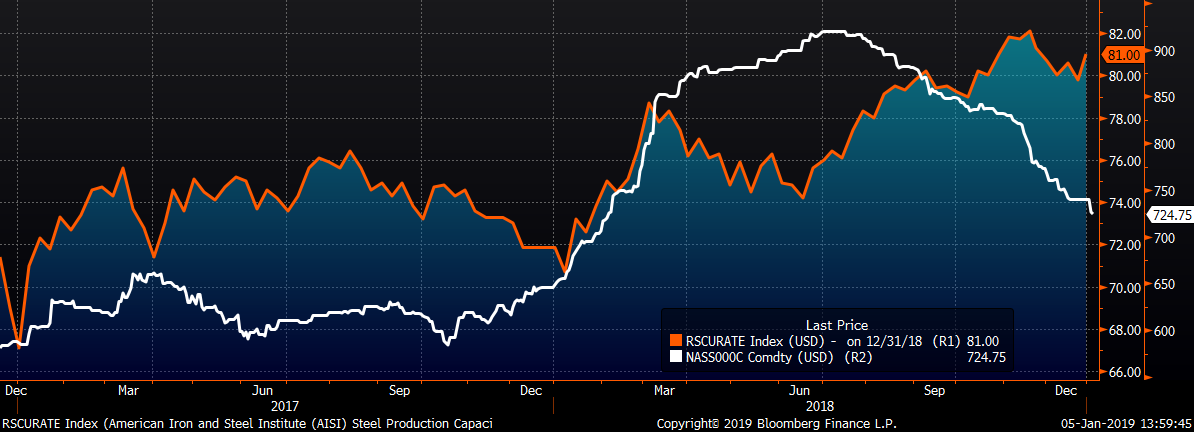
The AISI Capacity Utilization Rate rose to 81%.

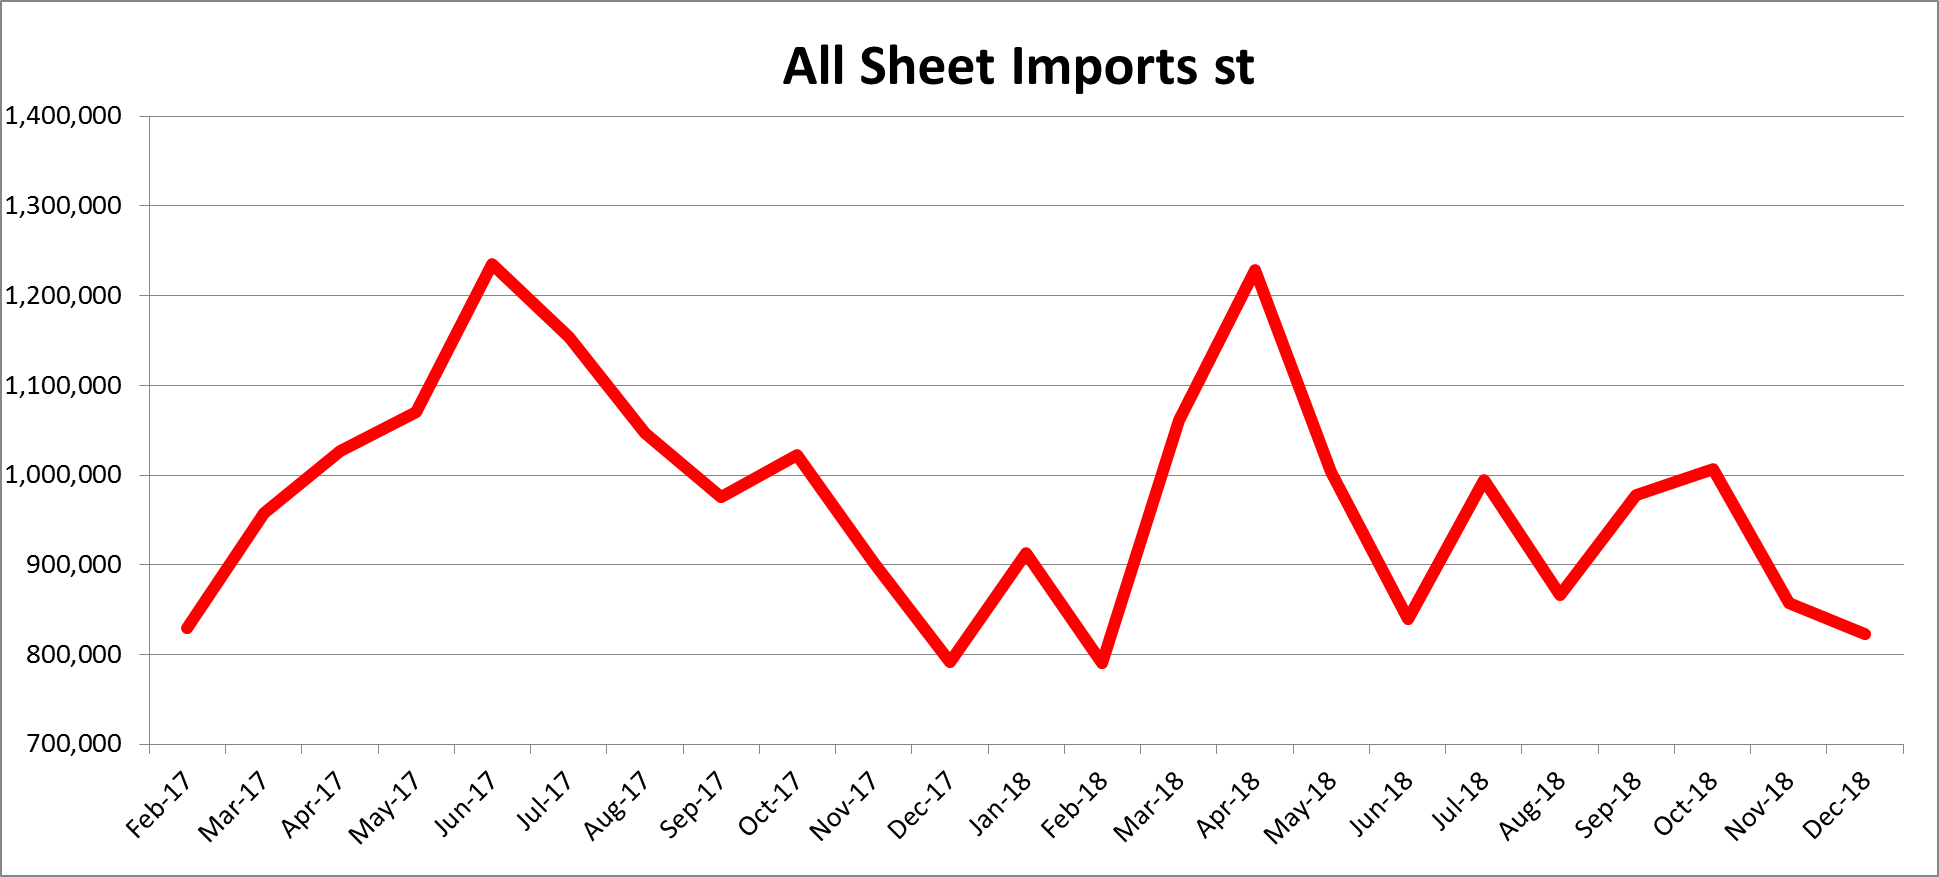
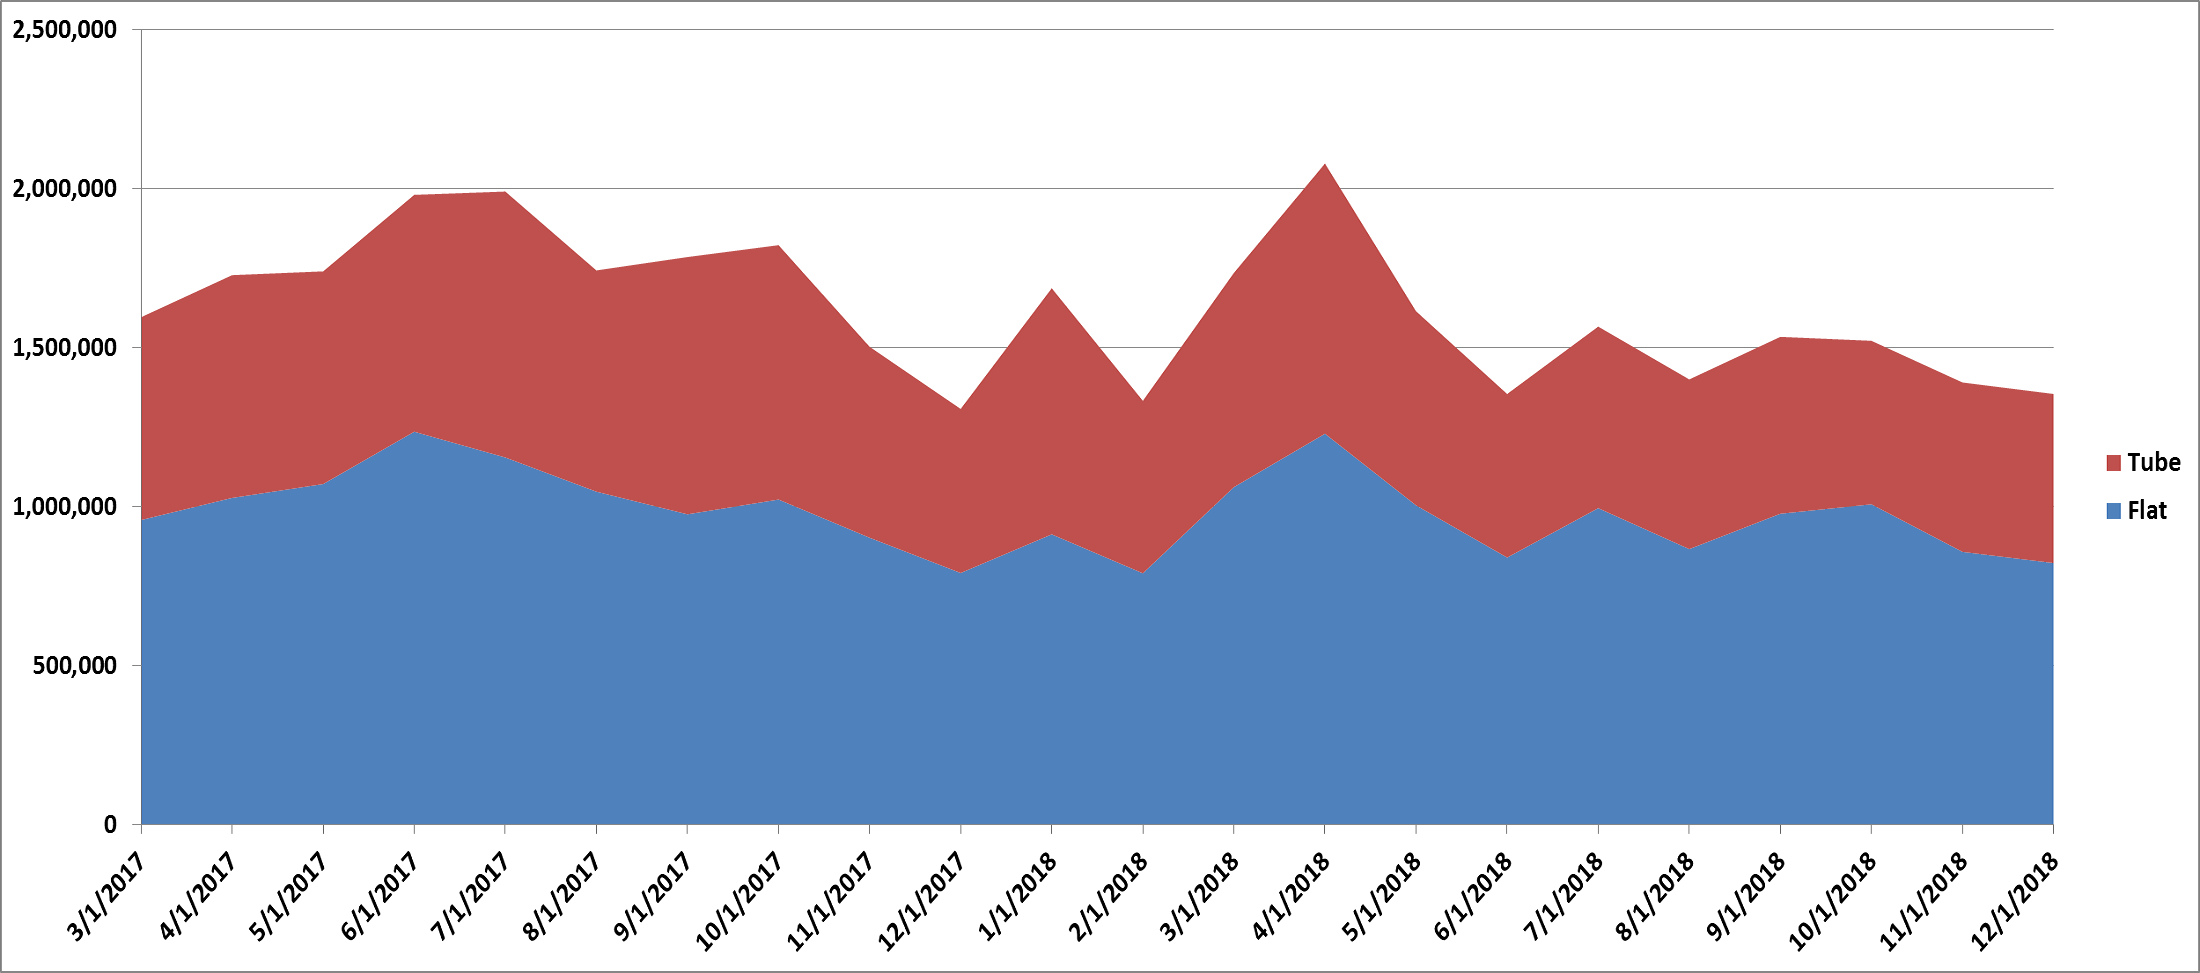
Import license data has been delayed by the shutdown. The last report we saw on December 18 showed December flat rolled import license data forecasting a 35k ton MoM decrease to 822k.
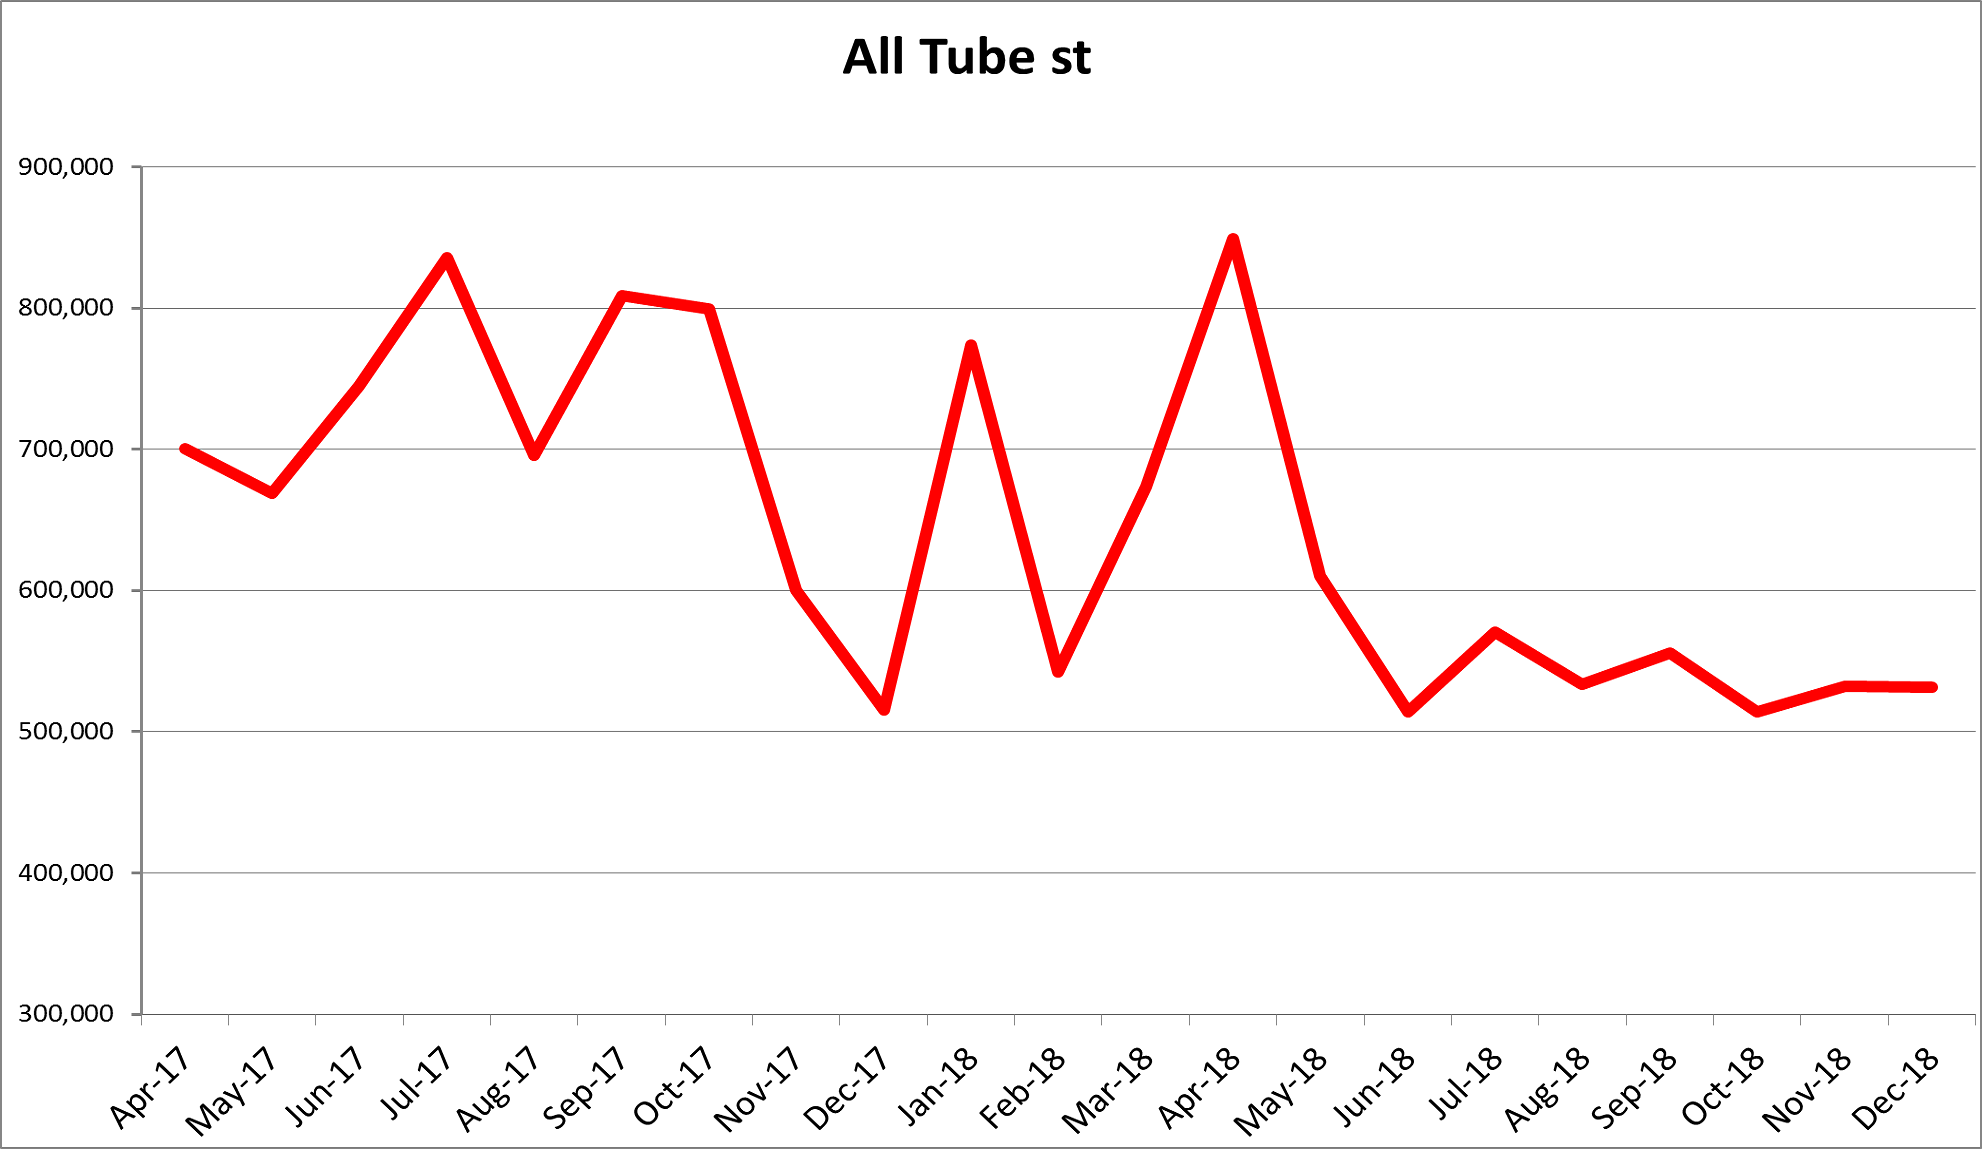
December’s tube import license data is forecasting little change MoM at 531k tons.
December’s combined flat rolled and tube import license data is forecasting 1.35m tons, slightly lower MoM.
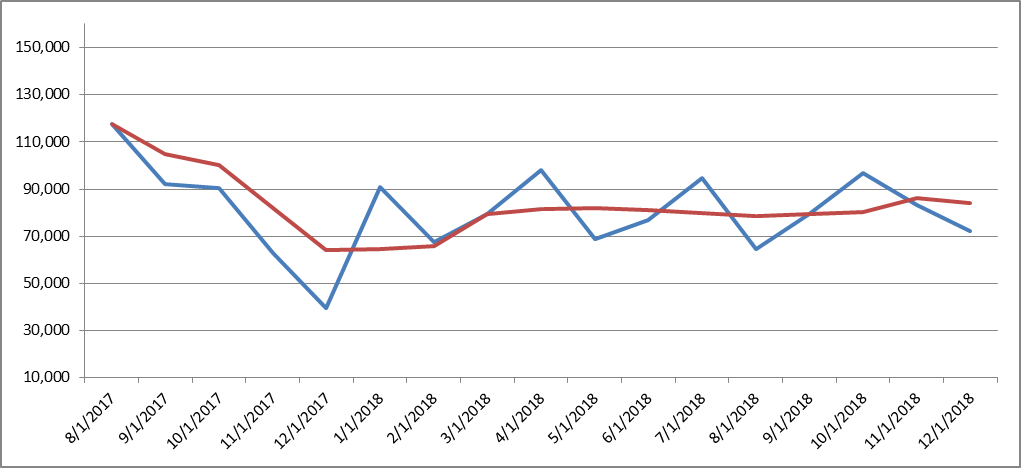
December AZ/AL import licenses are projecting a decrease of 11k tons MoM to 72k.
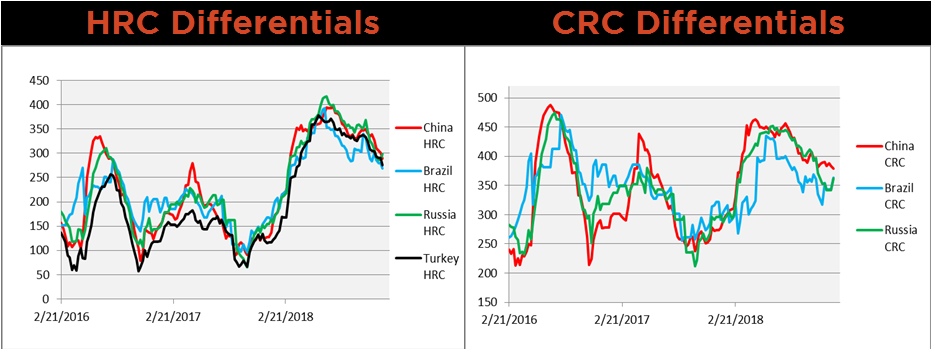
Below are HRC and CRC Midwest vs. each country’s export price differentials using pricing from SBB Platts. HRC differentials continued to decline, while Brazilian and Russian CRC differentials increased slightly.
SBB Platt’s HRC, CRC and HDG WoW pricing is below. The U.S. Midwest HRC was down 2%, the Midwest CRC price fell 1%, and the Midwest HDG price was unchanged. The Russian and Brazilian HRC and CRC export prices were down over 5% while the Brazilian Domestic HDG price was down nearly 10%. Japanese and Mexican HRC and Mexican CRC prices were up 3%.


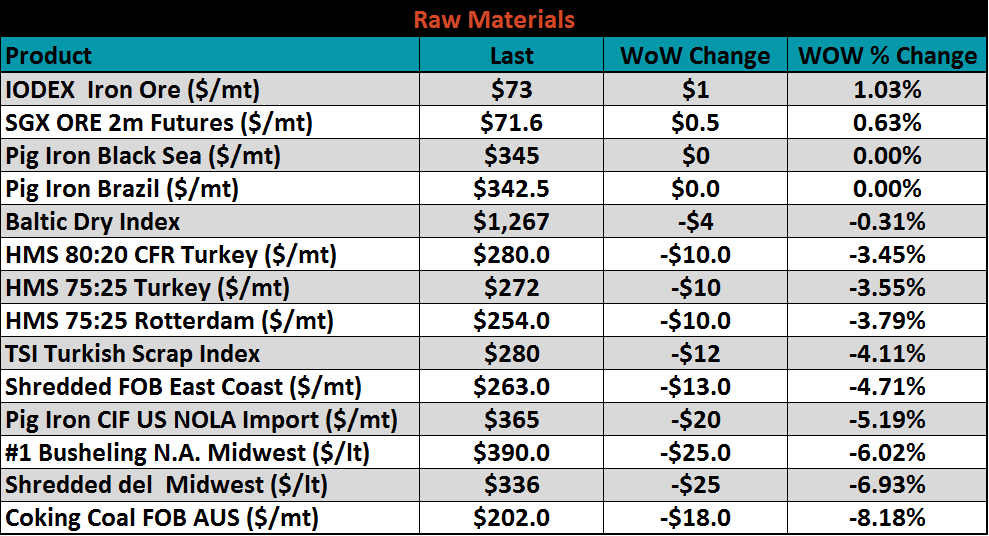
Listed below are ferrous raw materials WoW price changes. Coking coal was down 8.2% while Midwest shred and #1 busheling were down 6.9% and 6%, respectively.
The 2nd month CME busheling and LME Turkish scrap futures are below showing a clear downtrend.
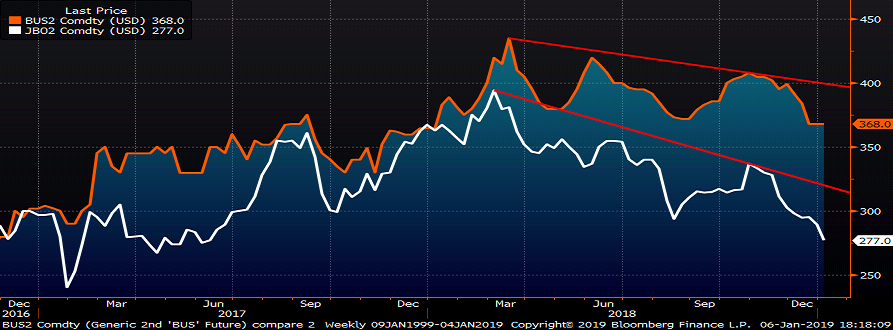
The SGX iron ore future gained $2.17 to $71.68 while the January Turkish scrap future dropped $9 to $280.00.

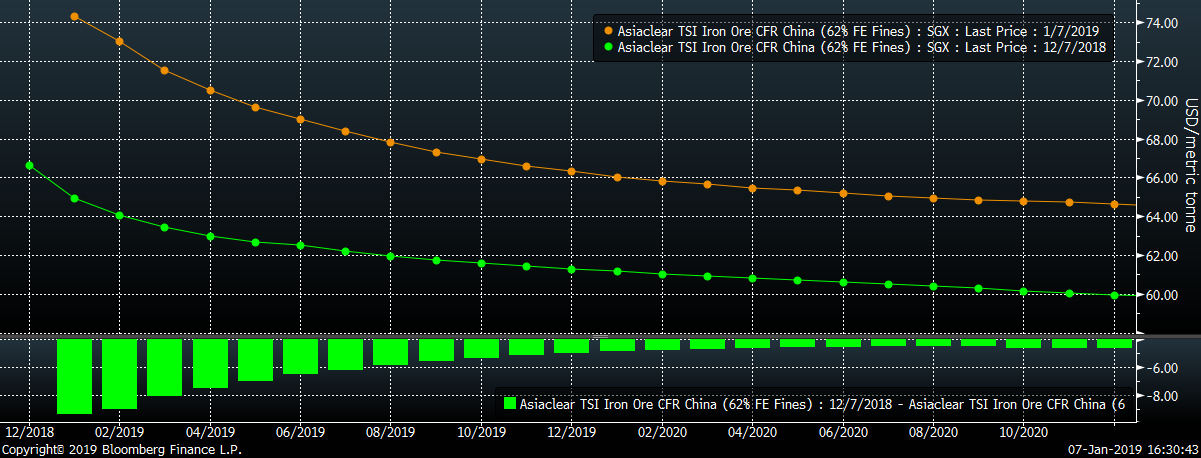
The SGX iron ore futures curve has rallied significantly with the front of the curve rallying more than the back.
Ex-flat rolled prices were mixed with the May Shanghai rebar future up 1.9%, while Turkish rebar fell 1.9% WoW.


Below are inventory levels for Chinese finished steel products and iron ore. Chinese HRC and rebar inventory rose 6.2% and 6%, respectively while 5-city inventory rose 5%.


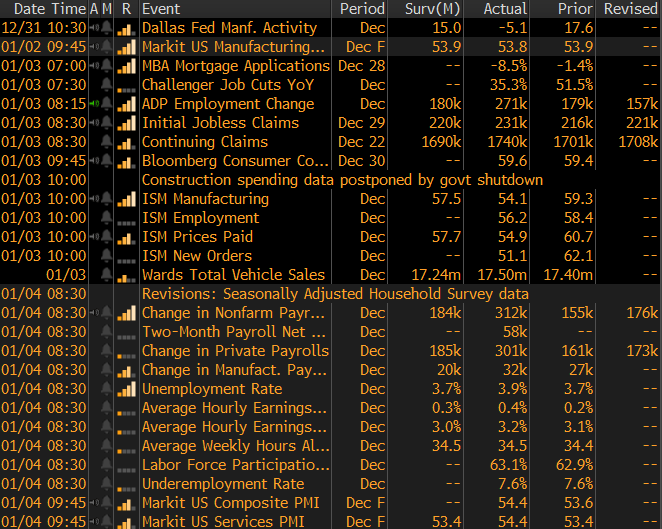
Last week’s economic data is below. The regional manufacturing indexes were discussed above. The December employment report saw 312k new jobs added and November’s payroll gains were increased 21k to 176k. Average hourly earnings rose by 3.2% YoY, beating expecations of a 3.0% YoY increase. The labor participation rate rose to 63.1%, which resulted in an increase in the unemployment rate to 3.9%.

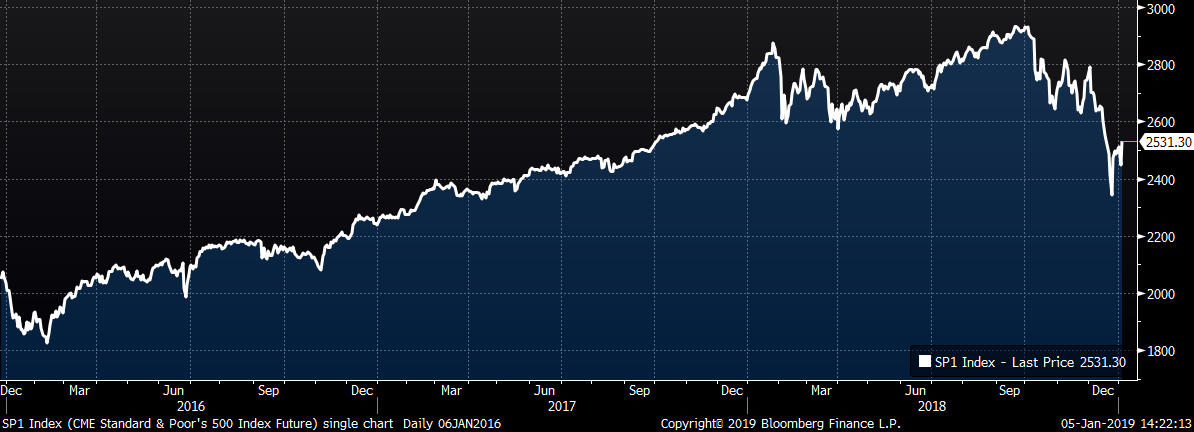
The S&P 500 rose 1.8% and The Shanghai Property Index was up 2%, while the Korean KOSPI Index fell 1.5%.

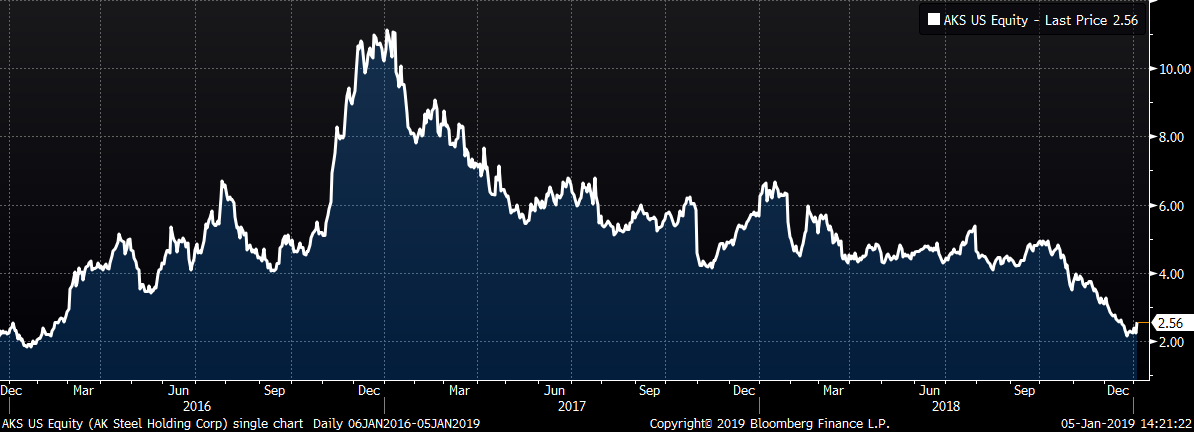
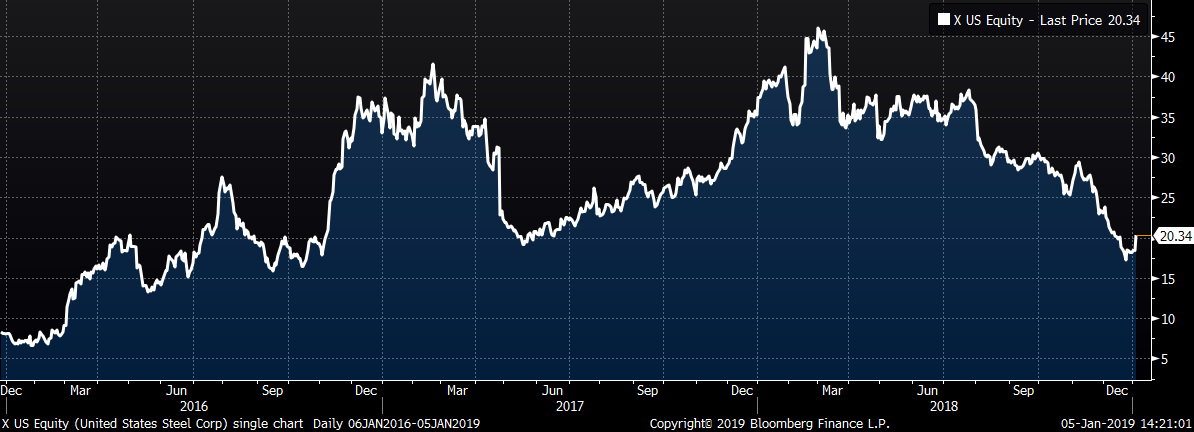
Steel mill stocks saw large gains led by AK Steel and US Steel up 12.8% and 11.5%, respectively.

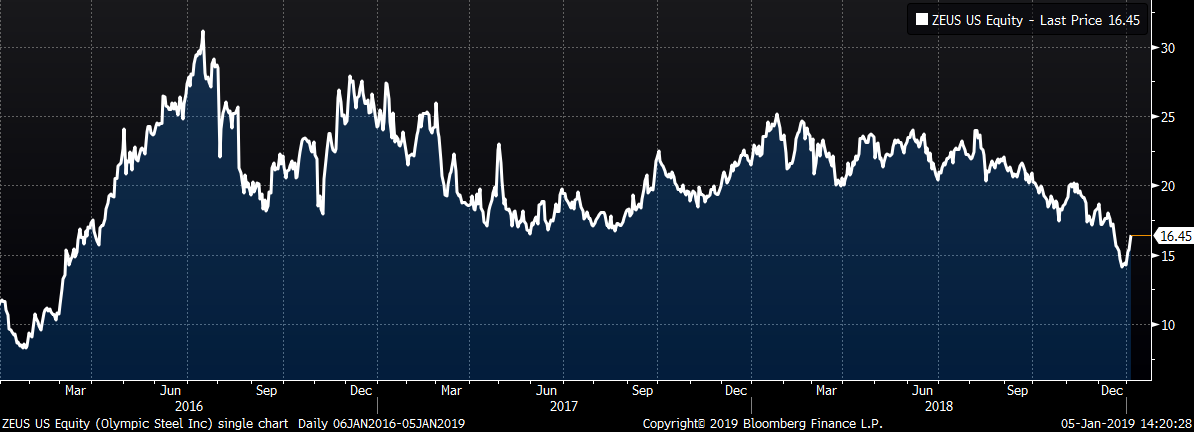
Service center stock’s WoW performance is shown below. Olympic Steel gained 14% after a sharp move lower over the past few weeks.

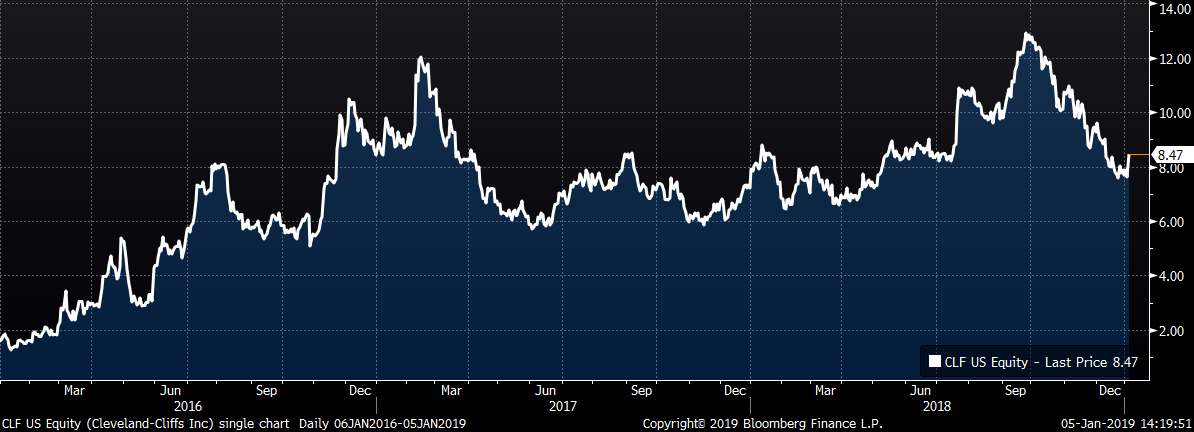
Mining’s stocks all gained, led by Cleveland Cliffs and Vale both up 7.8% and 7.7%, respectively.



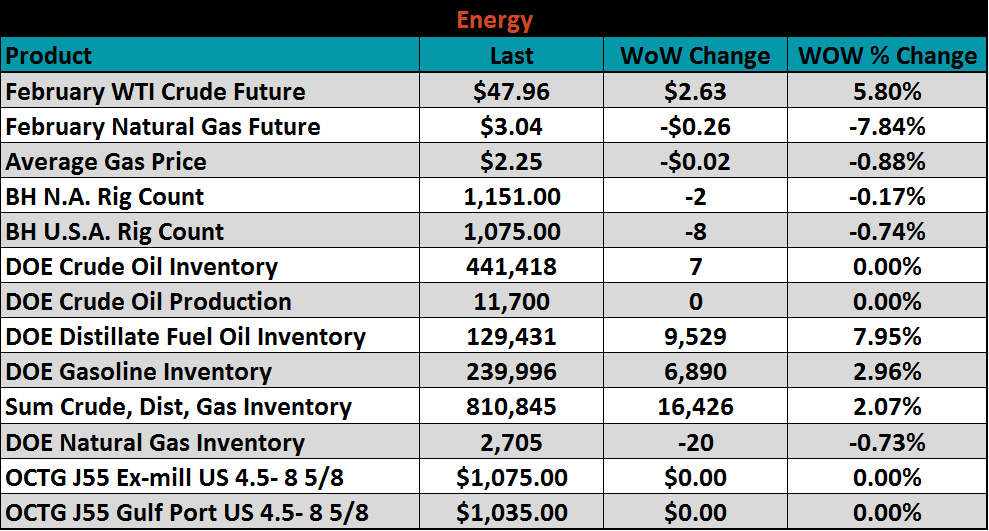
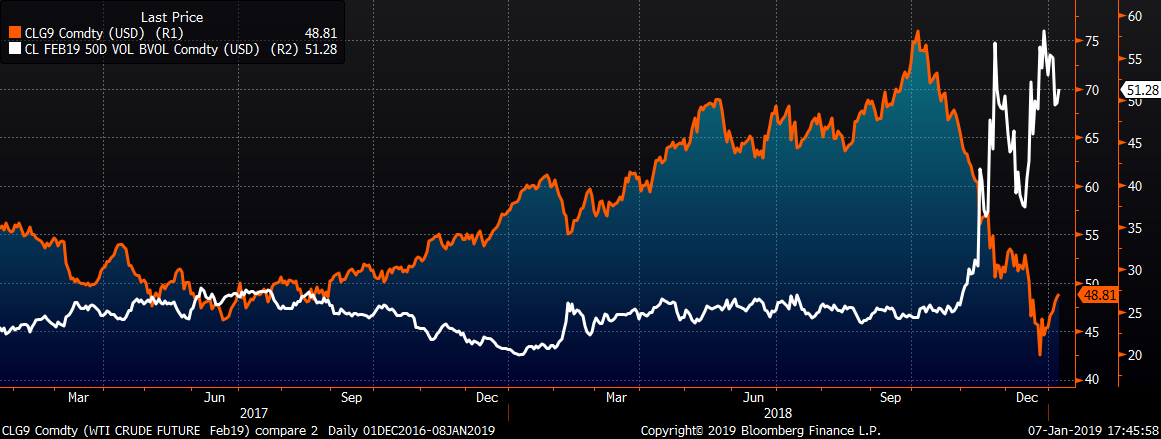
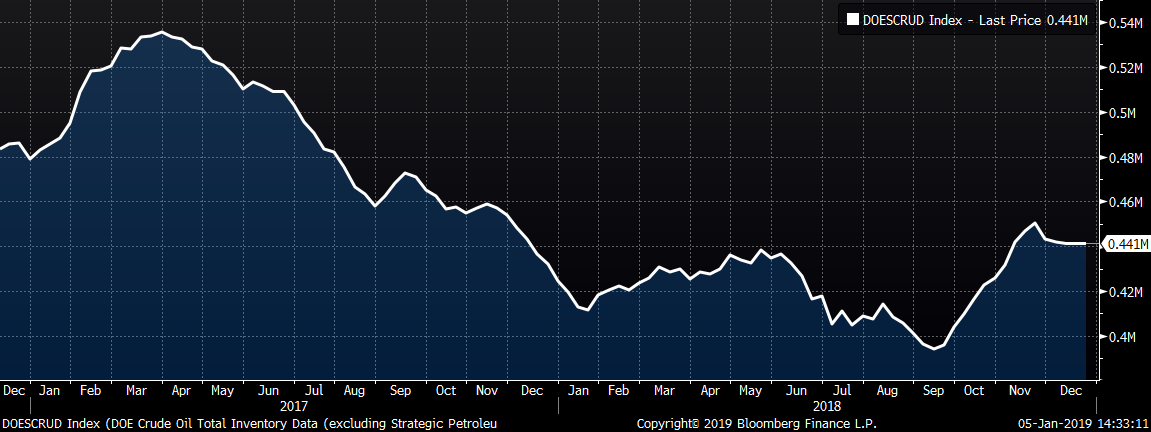
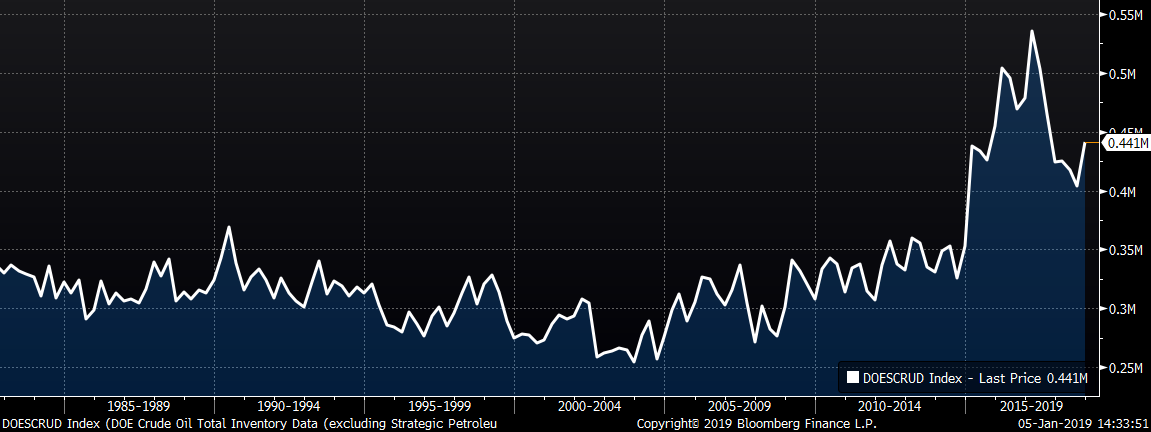
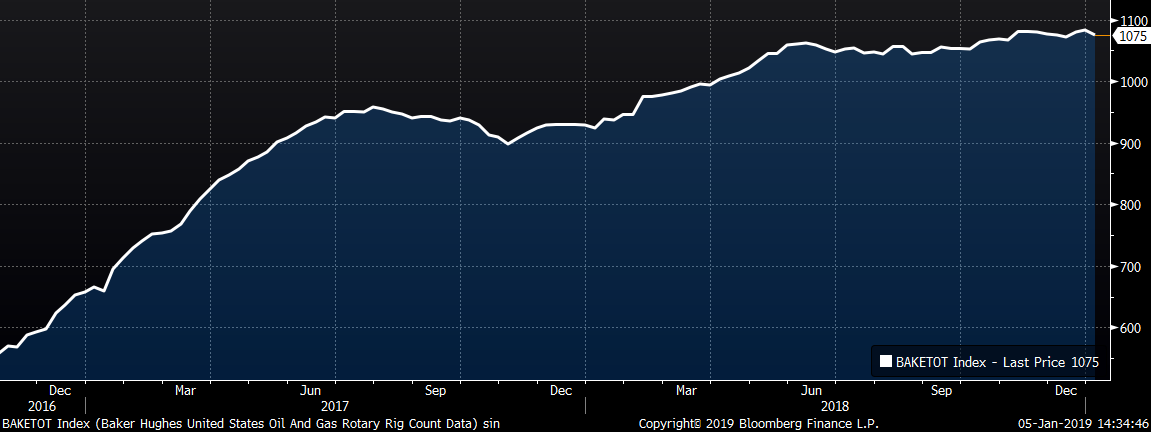
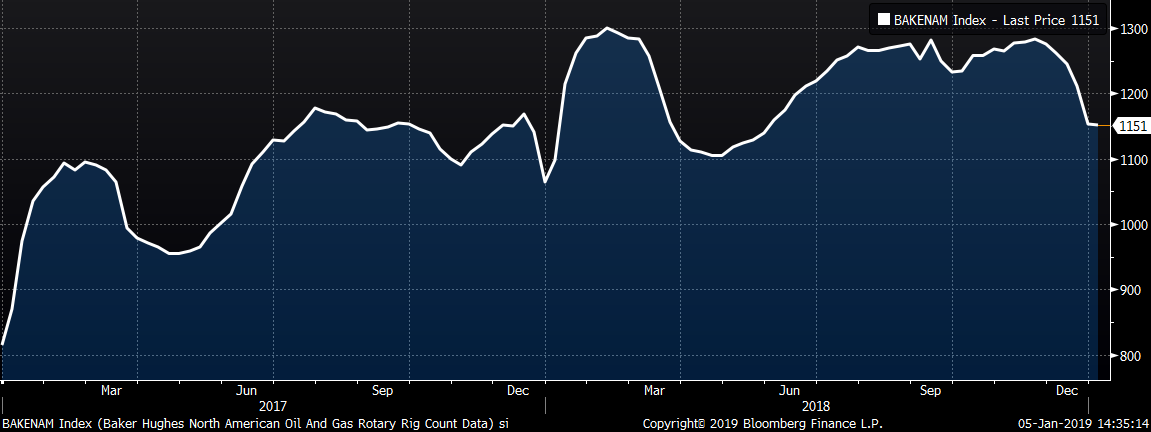
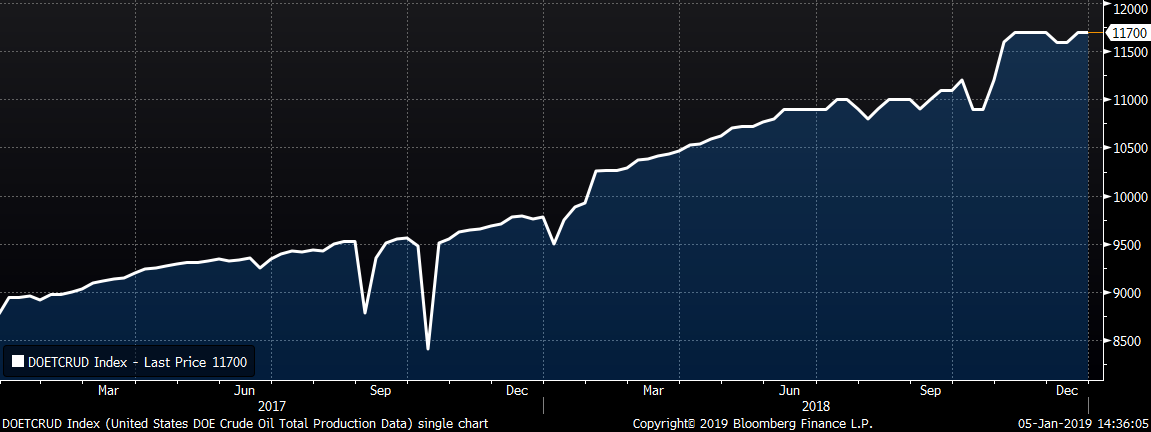
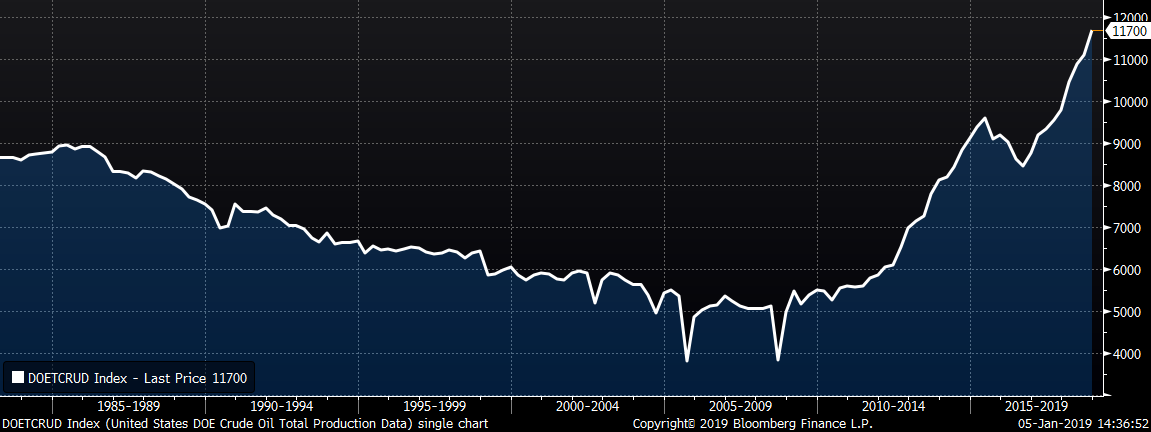
The January WTI crude oil future gained $2.63 or 5.9% to $47.96/bbl. Crude oil inventory was unchanged, while distillate inventory and gasoline inventory added 8% and 3%, respectively. The aggregate inventory level was up 2.1%. Crude oil production was unchanged at 11.7m bbl/day. The U.S. rig count decreased by eight rigs and the North American rig count by two. The January natural gas future fell by $0.26 or 7.8% to $3.04/mmBtu. Natural gas inventory fell 0.7%.

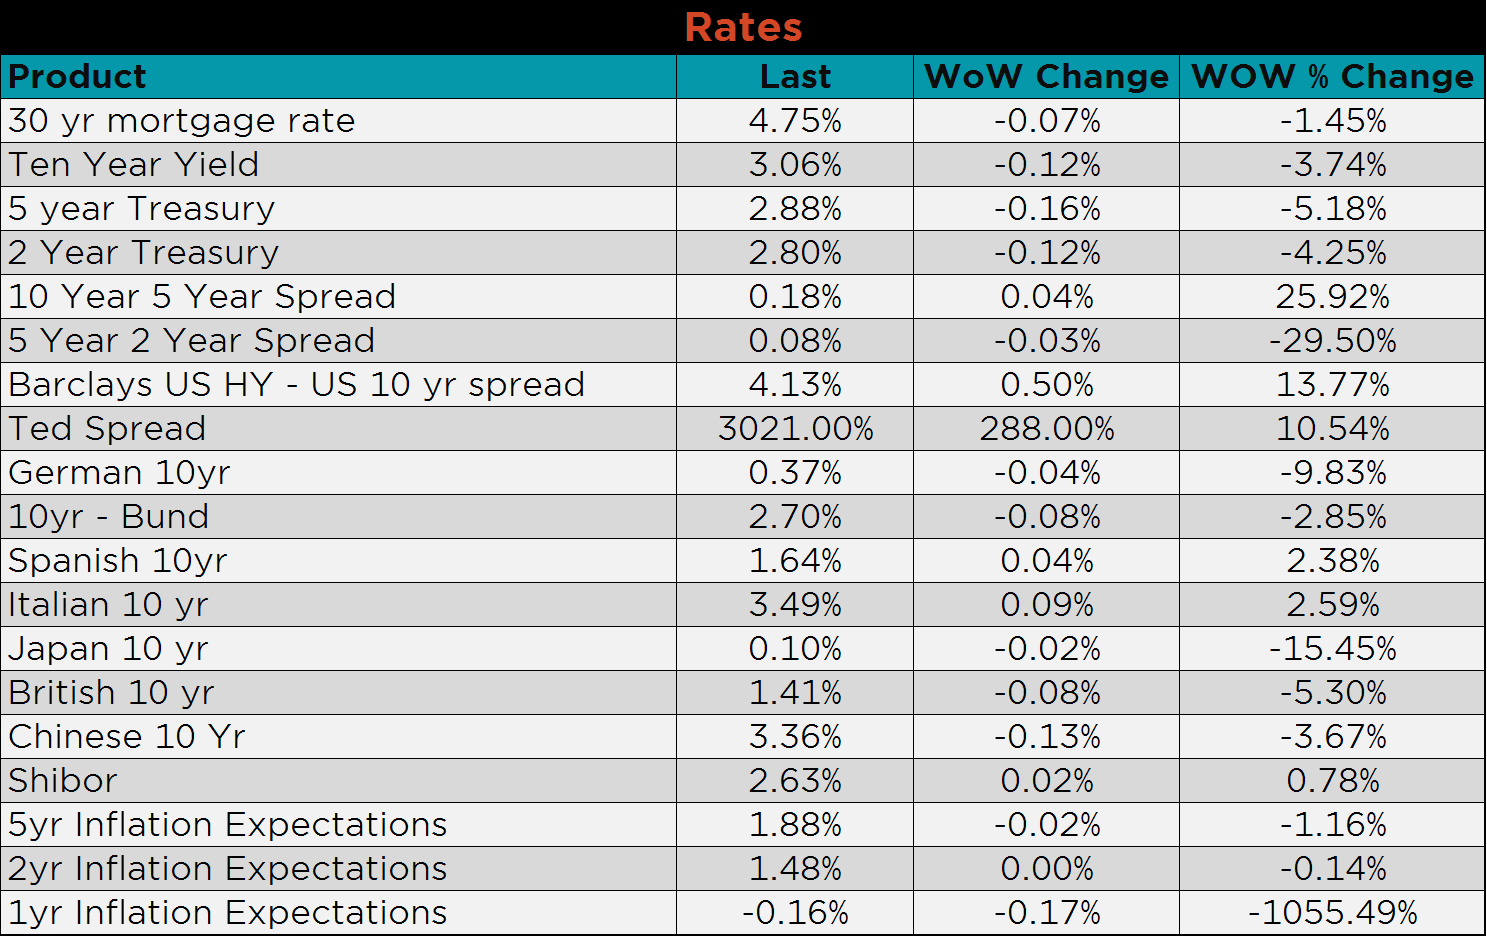
The U.S. ten-year treasury yield was down five basis points closing the week at 2.67%. The Japanese ten-year treasury yield decreased by four basis points, and is now negative for the first time since September 2016. 30-year mortgage rates fell fourteen basis points to 4.46%.

The list below details some upside and downside risks relevant to the steel industry. The bolded ones are occurring or look to be highly likely.
Upside Risks:
Downside Risks: