

January 6, 2023

Market Commentary
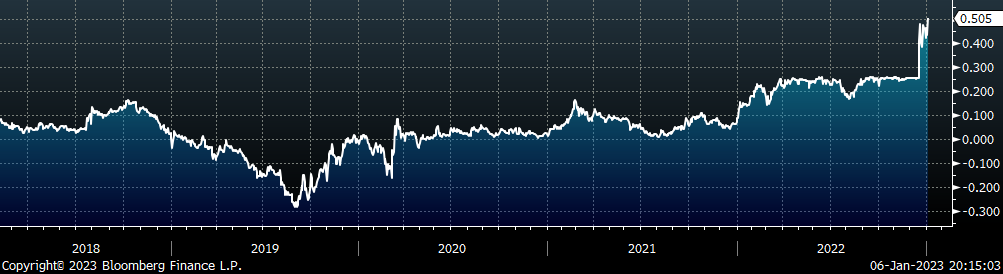
Below are the primary demand components of the ISM Manufacturing PMI, with new orders (white), backlog (blue), and new export orders (yellow).
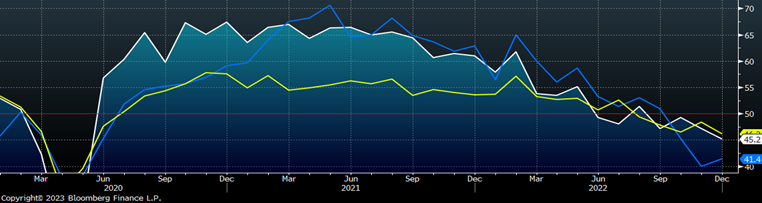
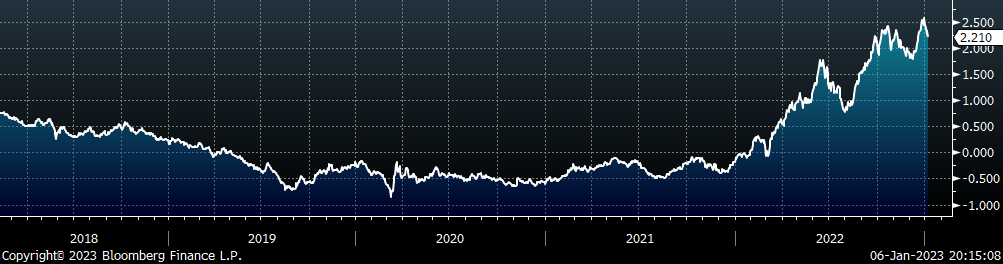
All three have been in contraction territory (below 50), since October, following a two year stretch of strong expansion in the manufacturing sector. This trend is also emblematic of the larger slowdown in steel consuming sectors writ large. However, it is important to not assume that reduced demand inherently means lower prices in 2023. The chart below shows weekly domestic raw steel production as measured by AISI, in thousands.
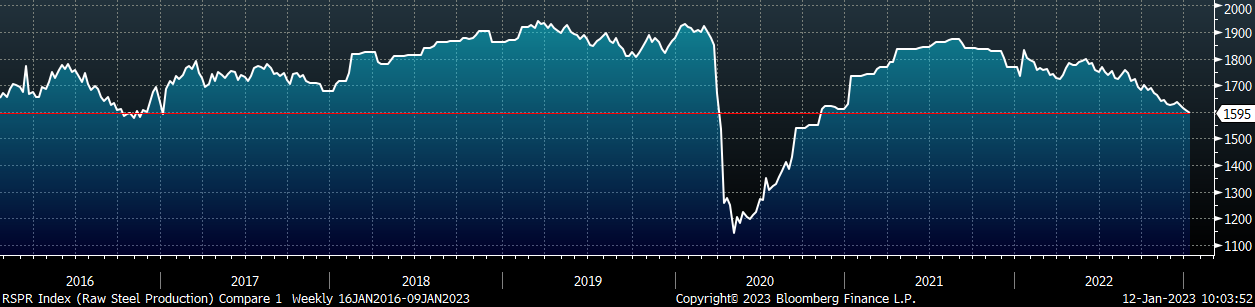
The last time that domestic production was at its current level (excluding the pandemic) was in October of 2016. Immediately following these production cuts came a 41% rally in steel prices over the next 5 months. Furthermore, total sheet imports in the six months prior to October 2016 were 1.16M tons higher than they were over the last 6 month’s. The main takeaway from this is that price will always be driven by the supply and demand relationship. Mills have been aggressive in throttling back production in an attempt to match supply with reduced levels of demand. If they remain disciplined, the assumption that prices will fall simply because demand is lower will prove costly.
ISM PMI
The chart below is the Platts Midwest HRC index (orange) and the ISM Manufacturing PMI (white). The HRC price was higher in December, and diverged further from the topline ISM Manufacturing PMI index which moved deeper into contraction territory.
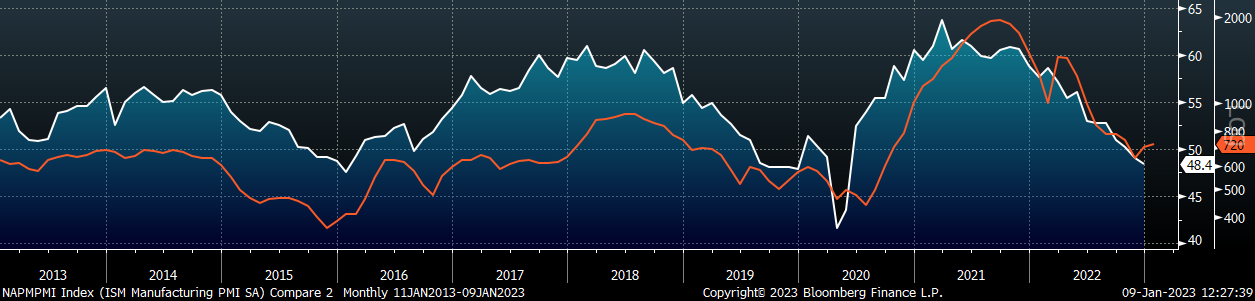
The December ISM Manufacturing PMI fell deeper into contraction territory.
The chart below breaks down all the subcomponents of the ISM Manufacturing report into 3 categories: demand, consumption, and inputs. Of the three categories, the demand side subindexes fell most significantly, for the second month in a row, while inputs eased and consumption was flat at the 50 level.
ISM Manufacturing PMI: Demand (blue), Consumption (white), & Inputs (orange)
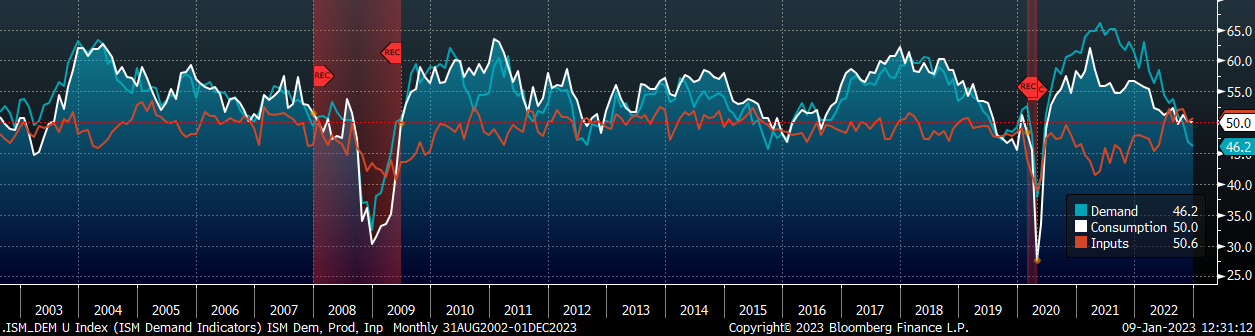
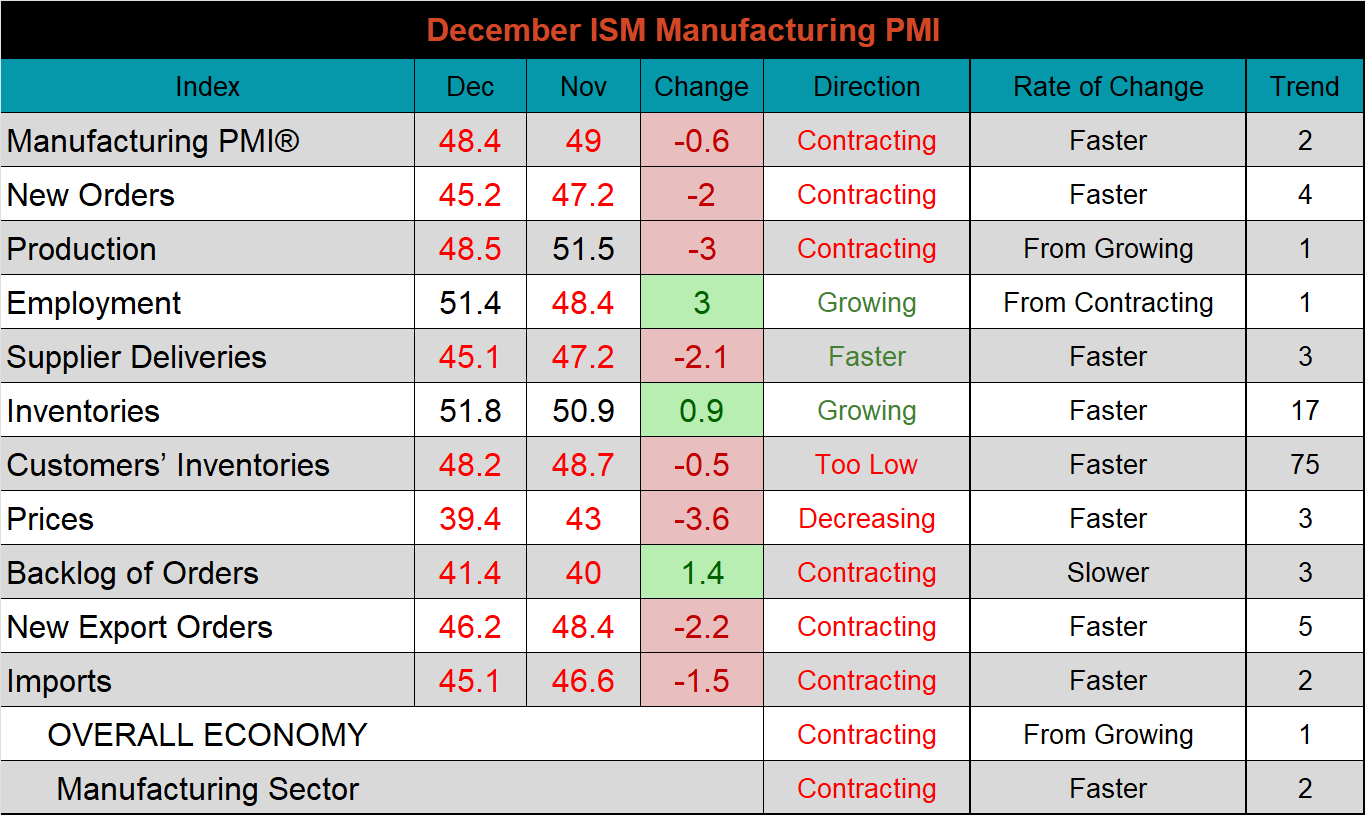
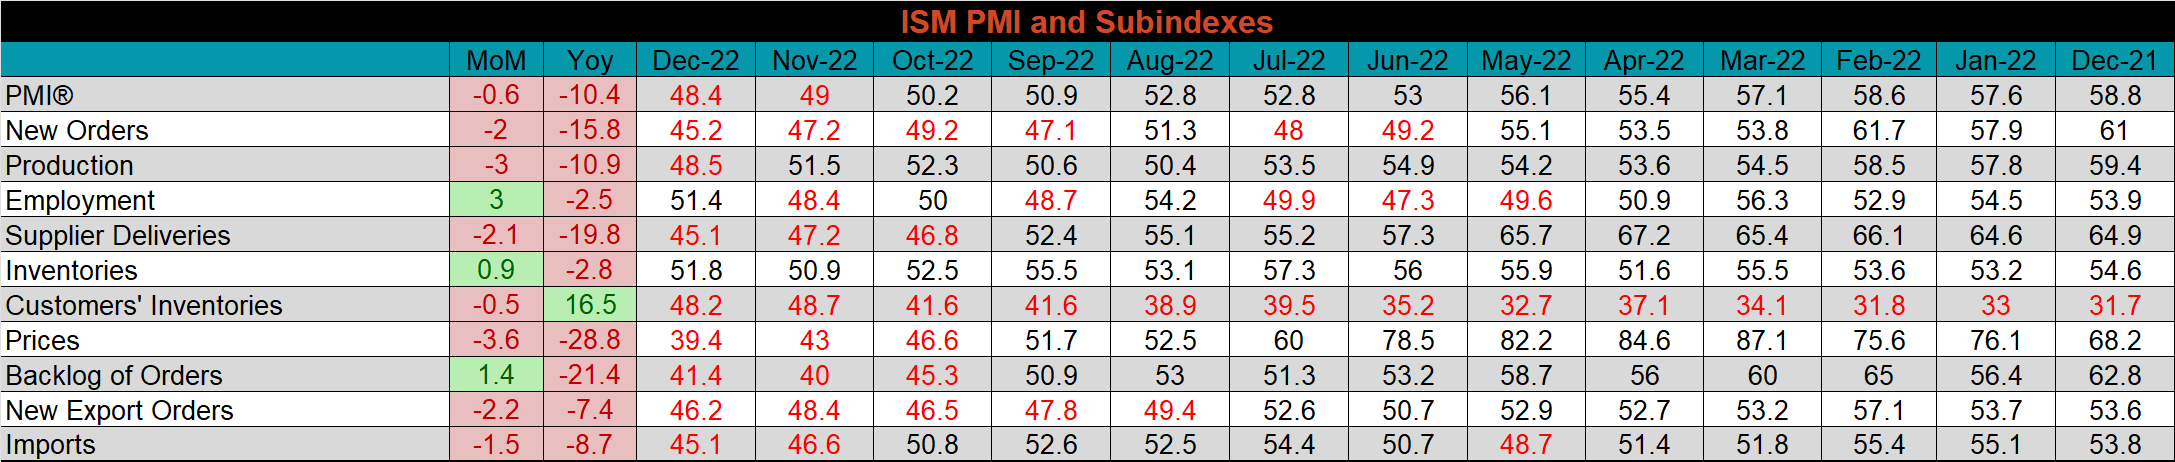
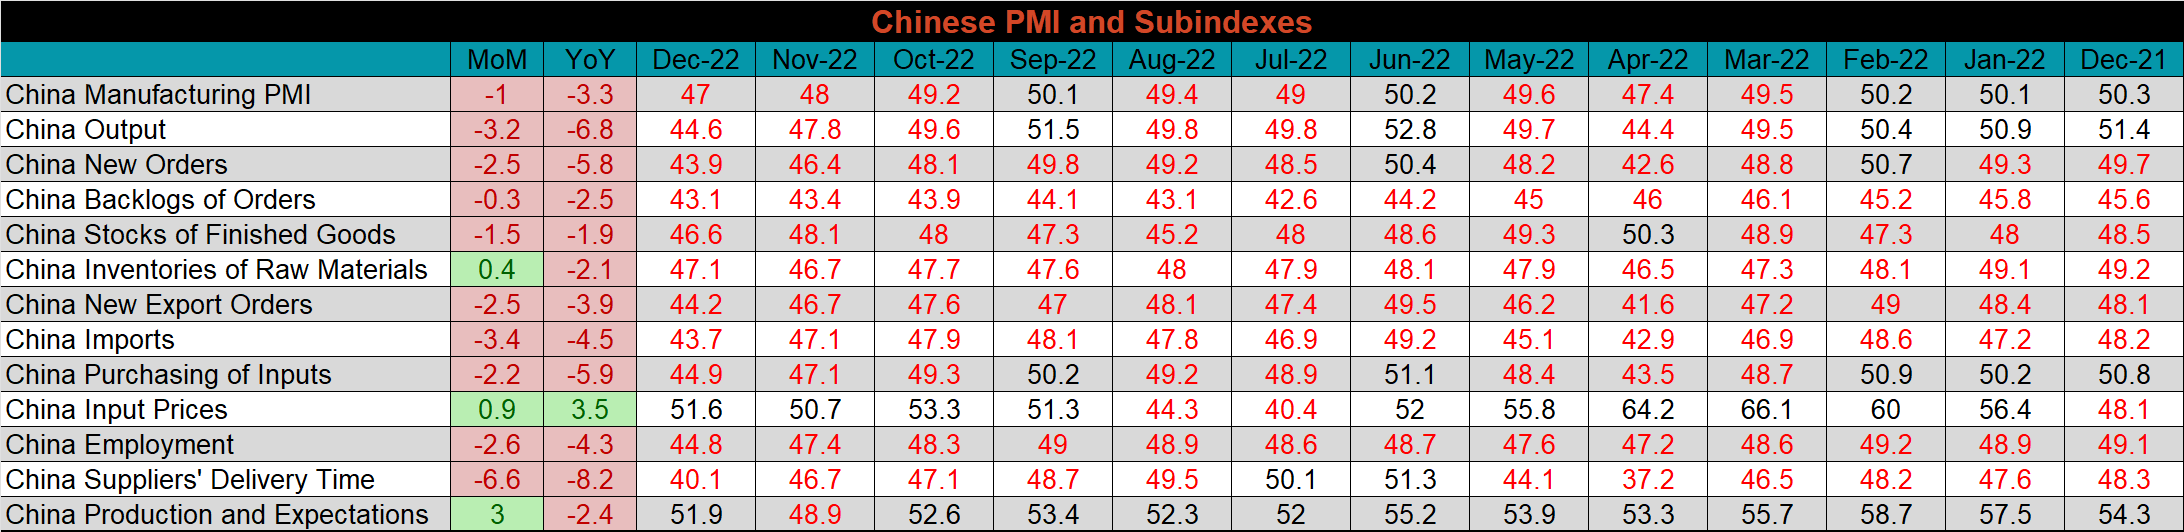
The table below shows the historical values of each subindex over the last twelve months.
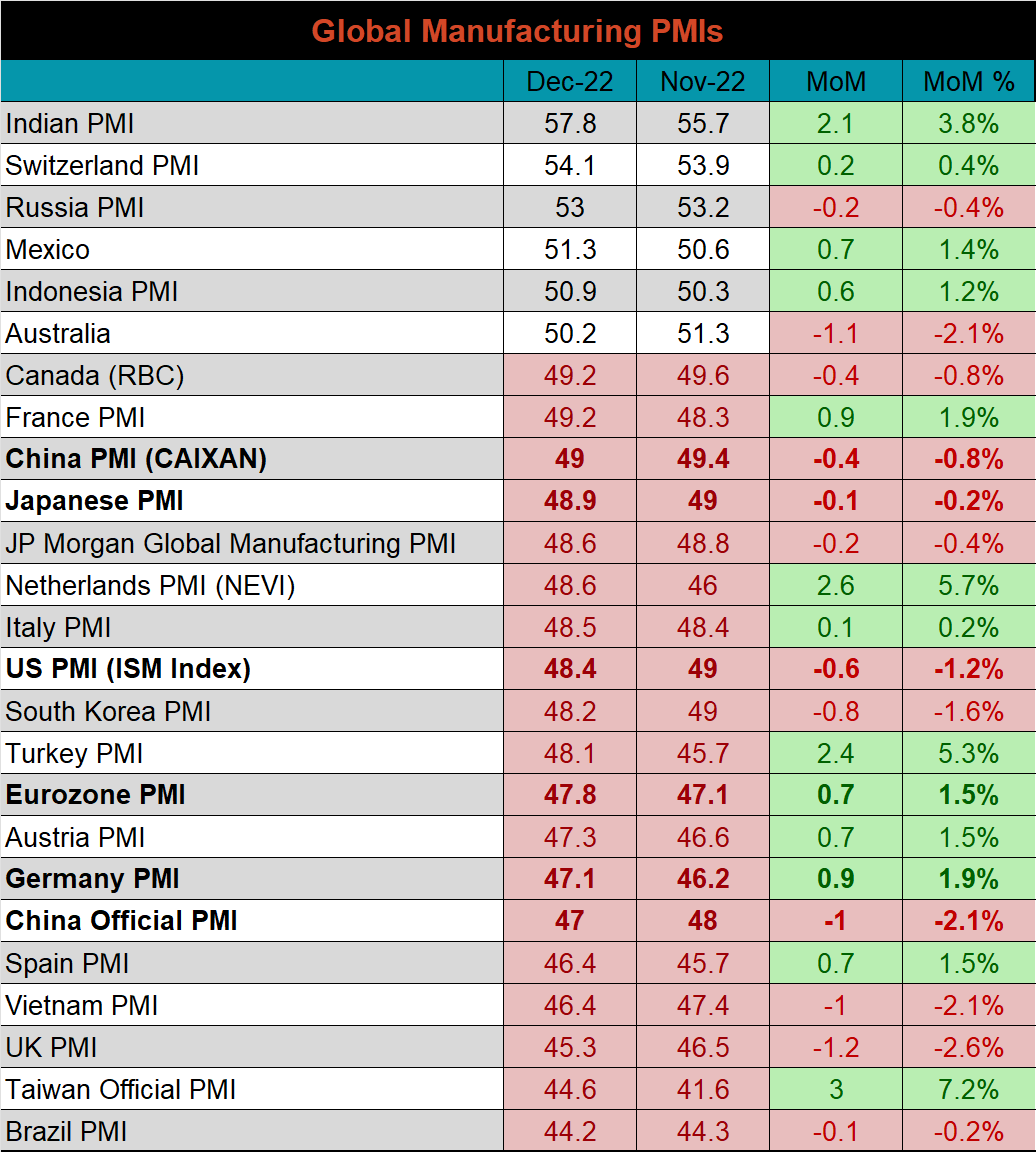
Global PMI
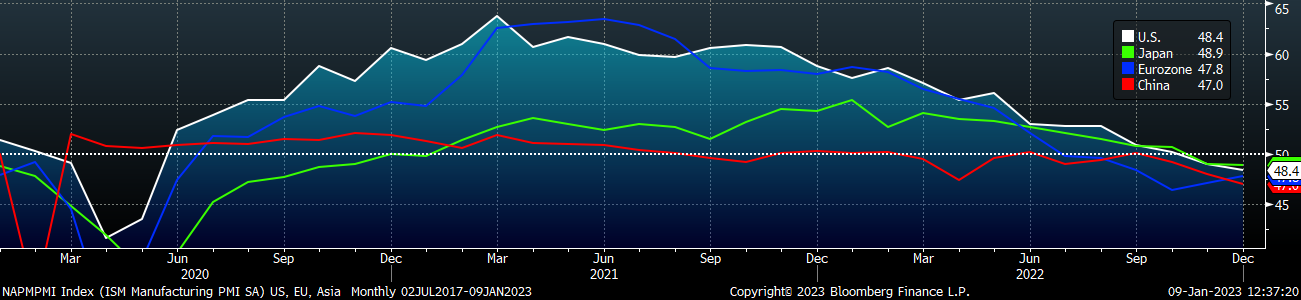
December global PMI data continues to show broad contraction in global manufacturing with all of the countries that were in contraction last month, still in contraction territory.
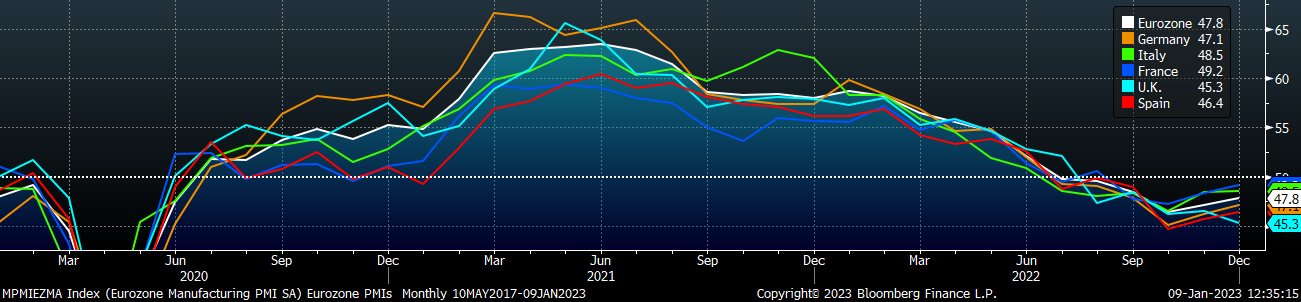
Eurozone (white), German (orange), Italian (green), Spanish (red), and French (blue), U.K. (teal) Manufacturing PMIs
US (white), Euro (blue), Chinese (red) and Japanese (green) Manufacturing PMIs
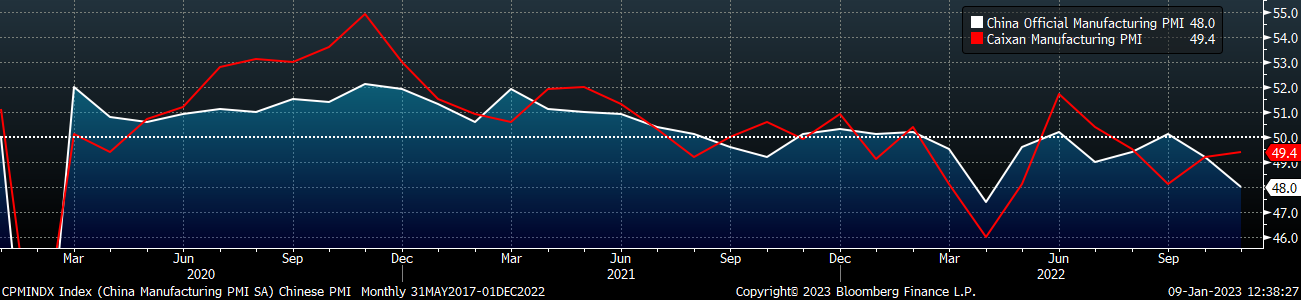
The Caixin PMI was slightly higher again this month, but it and the Chinese official PMI index remain in contraction territory.
China Official (white) and Caixan (red) Manufacturing PMIs
The table below breaks down China’s official manufacturing PMI subindexes. The Chinese manufacturing sector fell deeper into contraction territory. The production and expectations subindex was up significantly and moved back into expansion territory. This month’s print was impacted by the Chinese government’s removal of their covid zero policy. Skyrocketing cases have dampened short-term activity, but long-term outlook has improved.
Construction Spending
November U.S. Construction Spending
November seasonally adjusted U.S. construction spending was up 0.2% MoM and 8.5% above last year’s spending level.
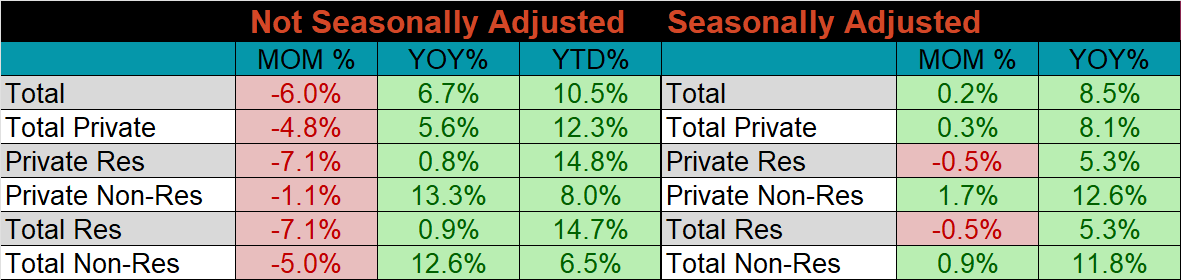
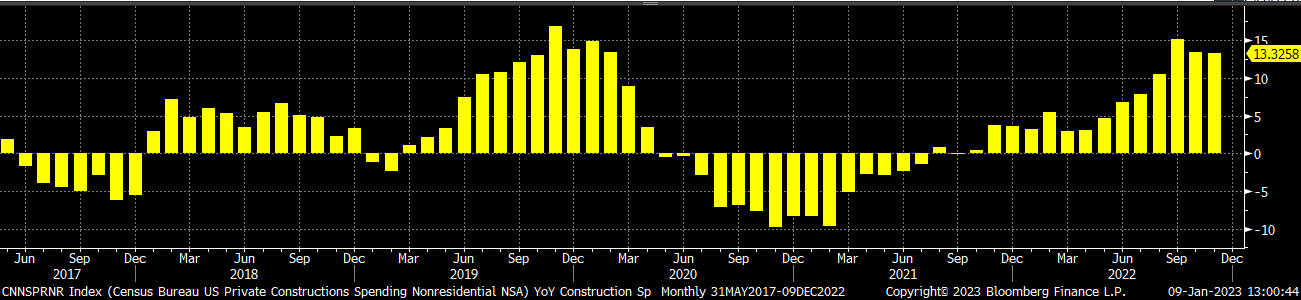
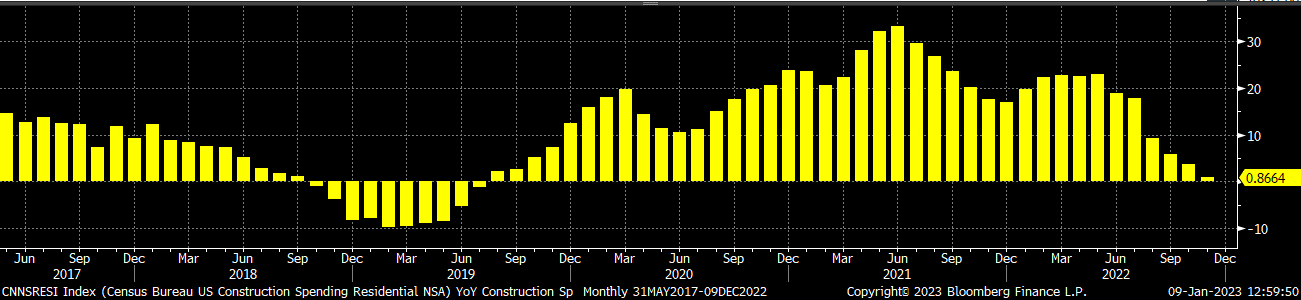
The charts below show the YoY changes in not seasonally adjusted construction spending. Both private residential and non-residential spending continue to show YoY increases. However, residential spending, the larger of the two, is clearly trending lower since May of this year and was only 0.9% above last year’s level.
U.S. Private Nonresidential Construction Spending NSA YoY % Change
U.S. Residential Construction Spending NSA YoY % Change
Auto Sales
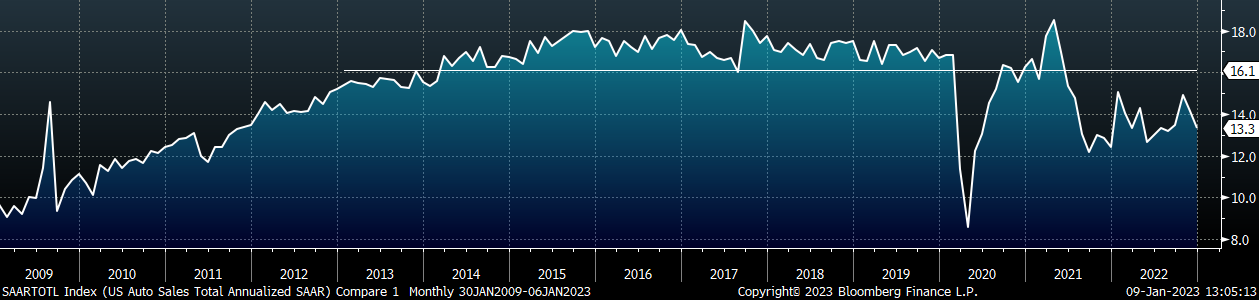
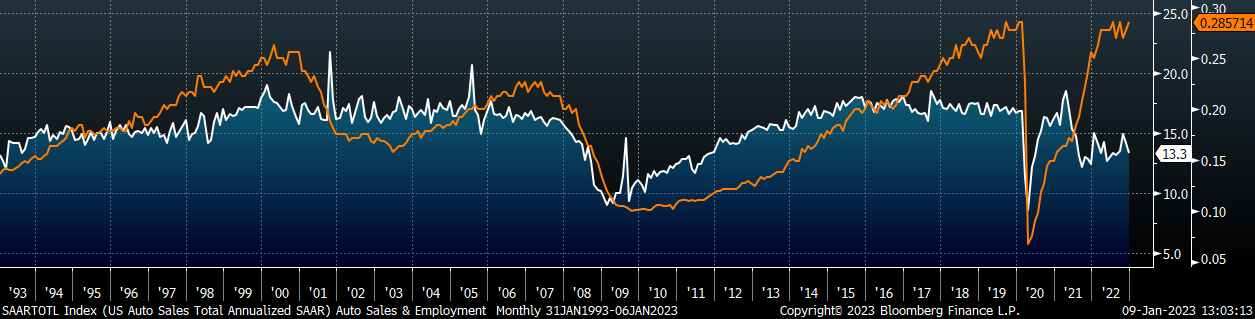
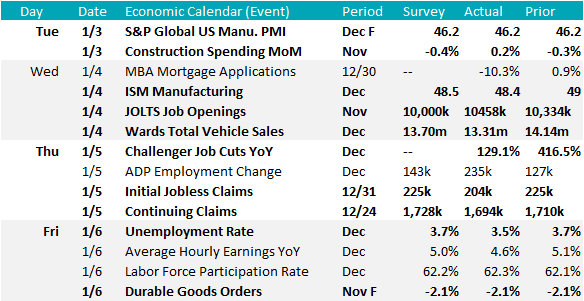
December U.S. light-vehicle sales decreased to a 13.3M seasonally adjusted annualized rate (S.A.A.R). This was the second month of decreasing sales and it is well below the 10-year average of 16.1M. The second chart shows the relationship between the unemployment rate and auto sales. The unemployment rate is inverted to show that declining unemployment typically leads to increasing auto sales. This month’s jobs report showed a labor market that continues to be remarkably resilient, with the December unemployment rate falling to 3.5%. We continue to view the gap between the two as bullish for the auto industry and expect this to bouy steel demand as construction continues to slip because of higher interest rates.
December U.S. Auto Sales (S.A.A.R.)
December U.S. Auto Sales (white) and the Inverted Unemployment Rate (orange)
Risks
Below are the most pertinent upside and downside price risks:
Upside Risks:
- A sudden dovish shift in financial policy leading to less aggressive rate hikes
- Strategic outages overshooting and causing production to fall below demand levels
- Easing supply chain restraints and labor shortages causing an increase in activity
- Energy issues abroad curtailing global production
- China reopening its economy with further stimulus measures
Downside Risks:
- Economic slowdown caused by increasing interest rates and sustained restrictive policy from the Federal Reserve
- Decreasing input costs allowing mills to aggressively sell lower while remaining profitable
- Increased domestic production capacity leading to an increase in competitive pricing
- Sustained levels of import arrivals keeping pressure on domestic mill pricing
- Limited desire to restock and persistently short lead times causing a “Buyer’s Strike”
HRC Futures
All of the below data points are as of January 6, 2023.
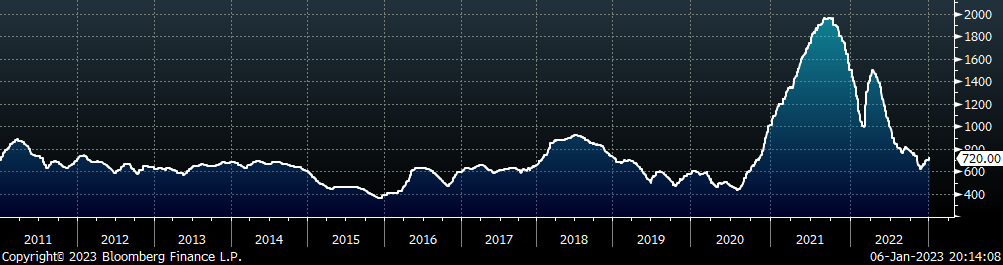
The Platts TSI Daily Midwest HRC Index was up another $20 this week, ending at $720.
Platts TSI Daily Midwest HRC Index
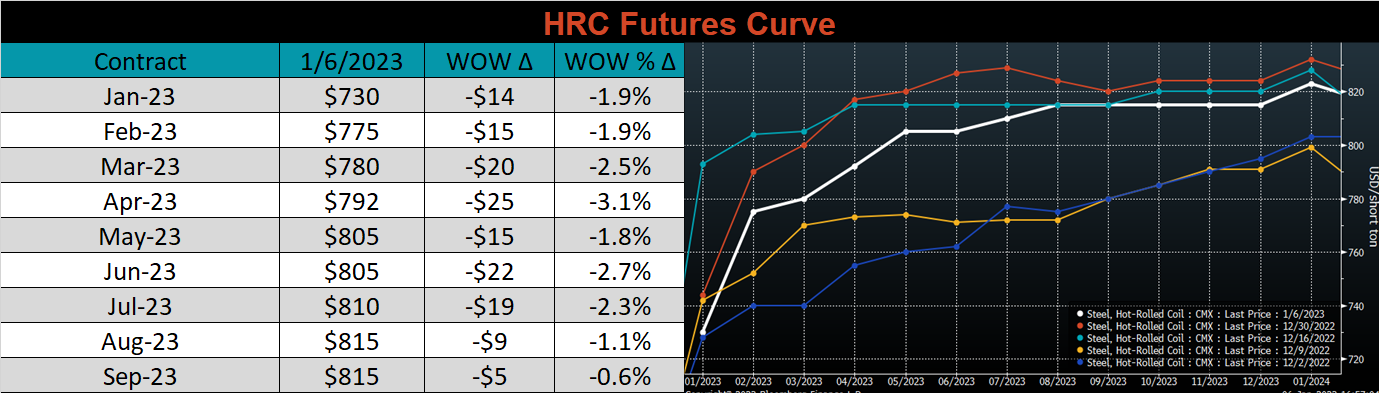
The CME Midwest HRC futures curve is below, with last Friday’s settlements in white. The entire curve ended the week lower, most significantly in the front.
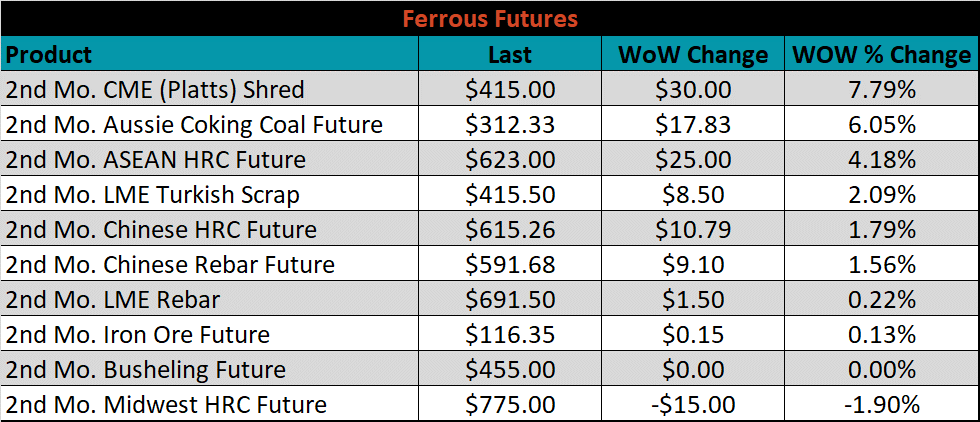
The 2nd month ferrous futures were mostly higher, led by shredded, which gained 7.8%, while Midwest HRC lost 1.9%.
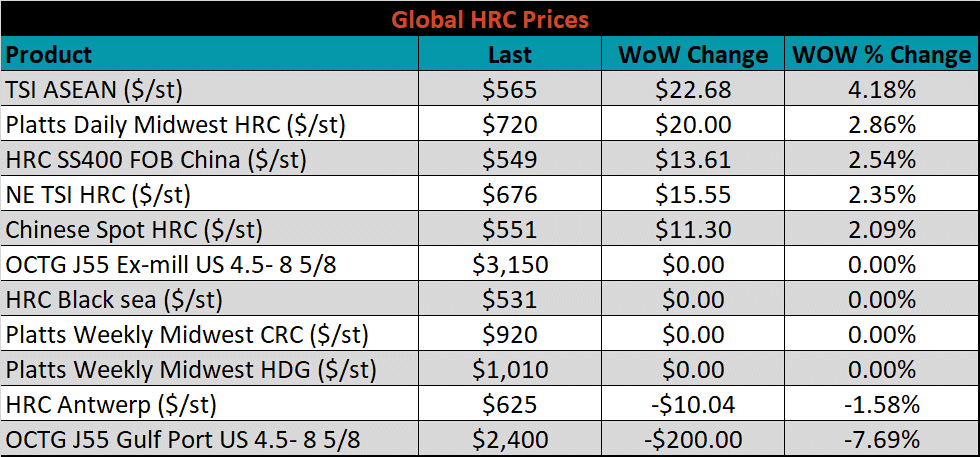
Global flat rolled indexes were mostly higher as well this week, led this time by ASEAN HRC, up 4.2%, while Antwerp HRC was down 1.6%.
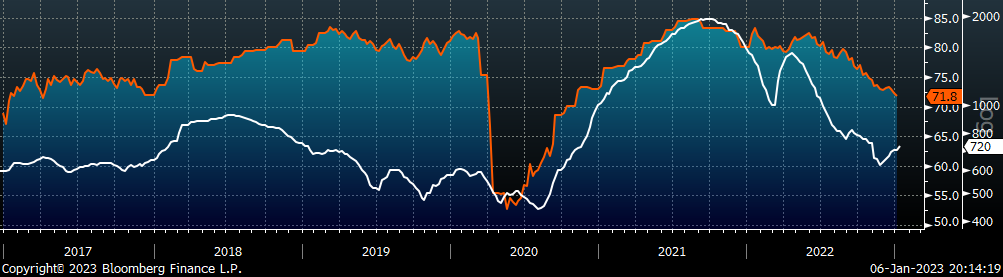
The AISI Capacity Utilization was down another 0.5% to 71.8%.
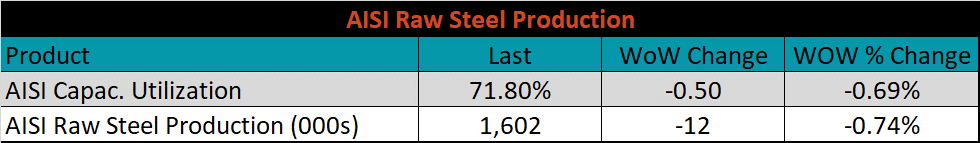
AISI Steel Capacity Utilization Rate (orange) and Platts TSI Daily Midwest HRC Index (white)
Imports & Differentials
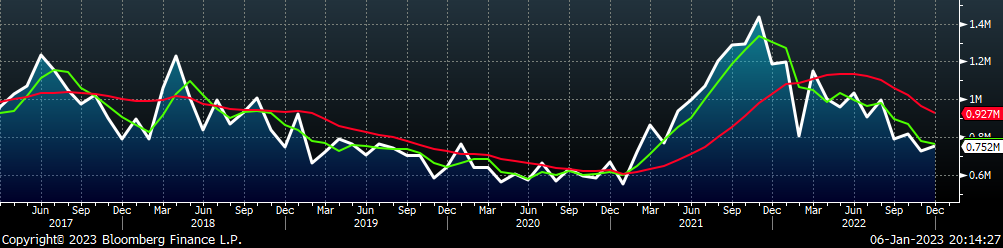
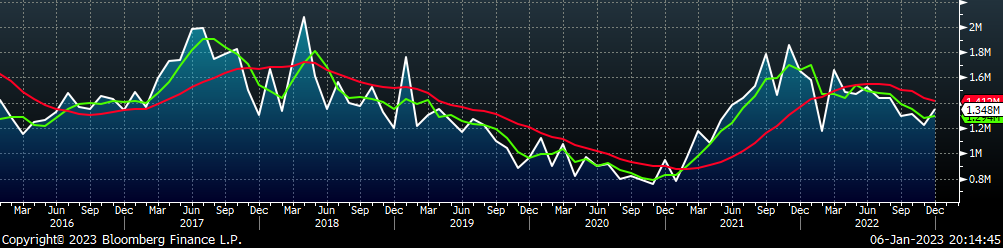
December flat rolled import license data is forecasting an increase of 27k to 752k MoM.
All Sheet Imports (white) w/ 3-Mo. (green) & 12-Mo. Moving Average (red)
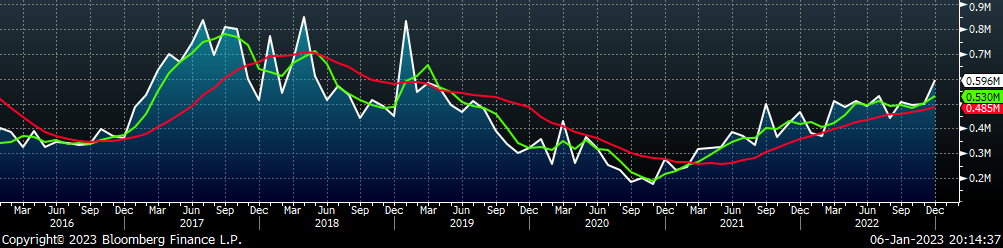
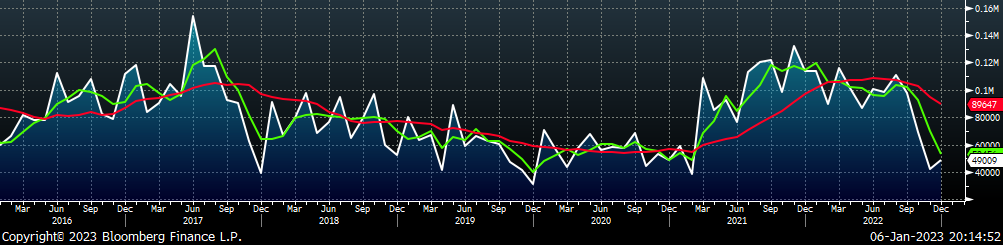
Tube imports license data is forecasting an increase of 97k to 596k in December.
All Tube Imports (white) w/ 3-Mo. (green) & 12-Mo. Moving Average (red)
All Sheet plus Tube (white) w/ 3-Mo. (green) & 12-Mo. Moving Average (red)
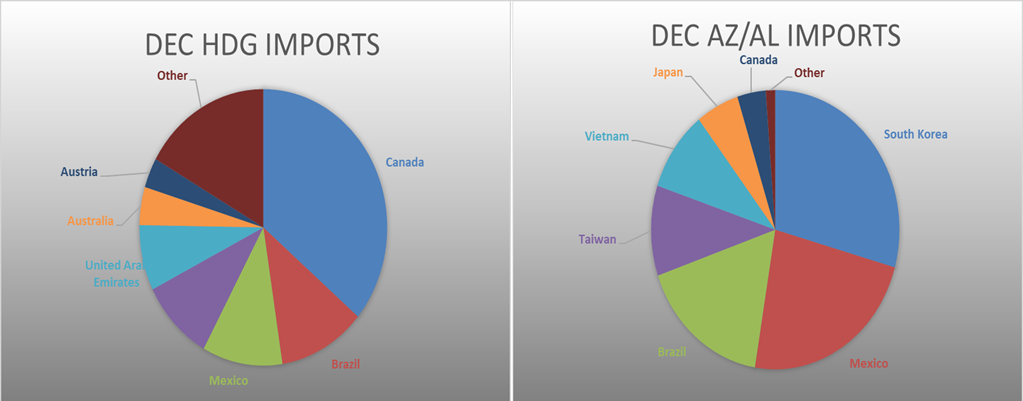
December AZ/AL import license data is forecasting an increase of 7k to 49k.
Galvalume Imports (white) w/ 3 Mo. (green) & 12 Mo. Moving Average (red)
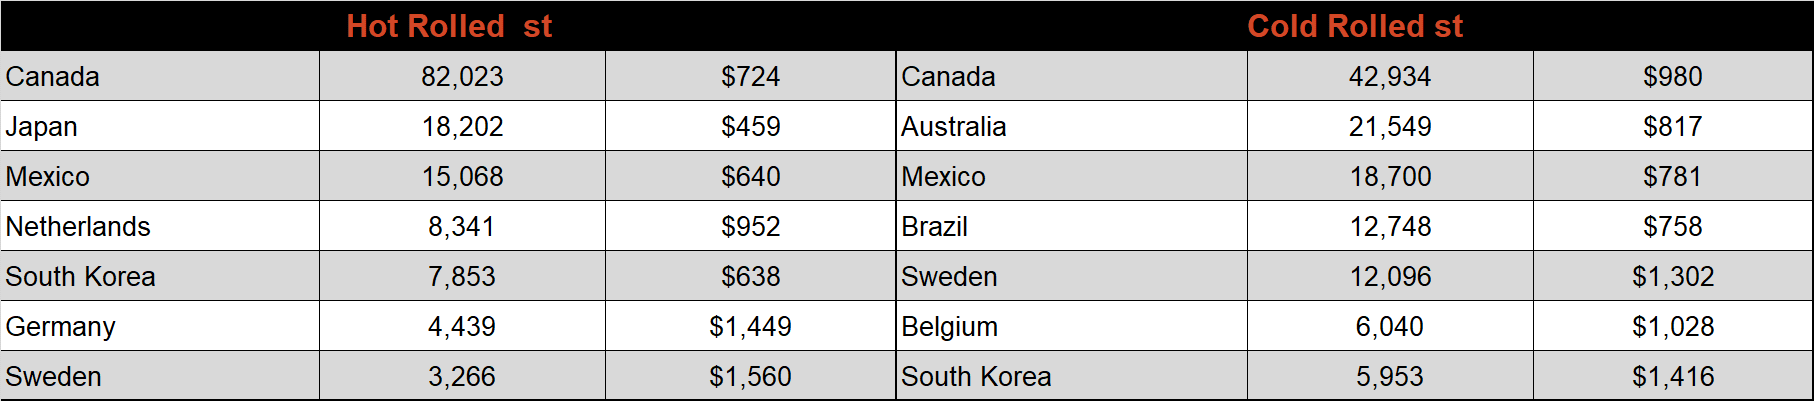
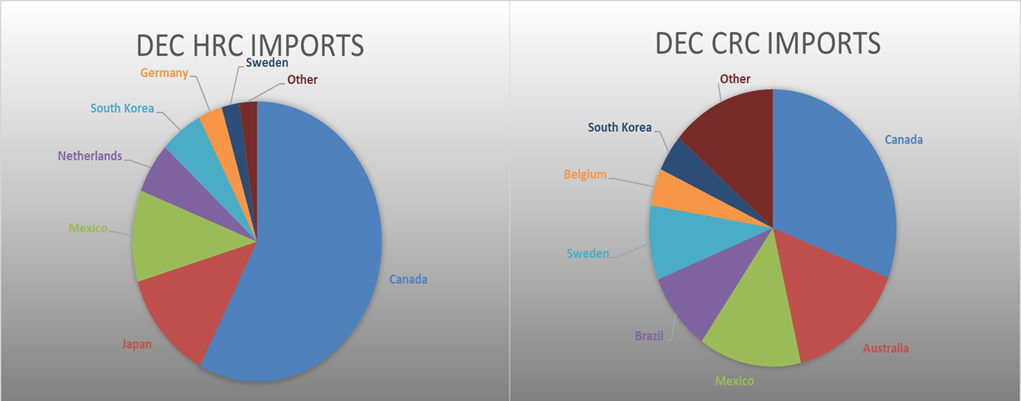
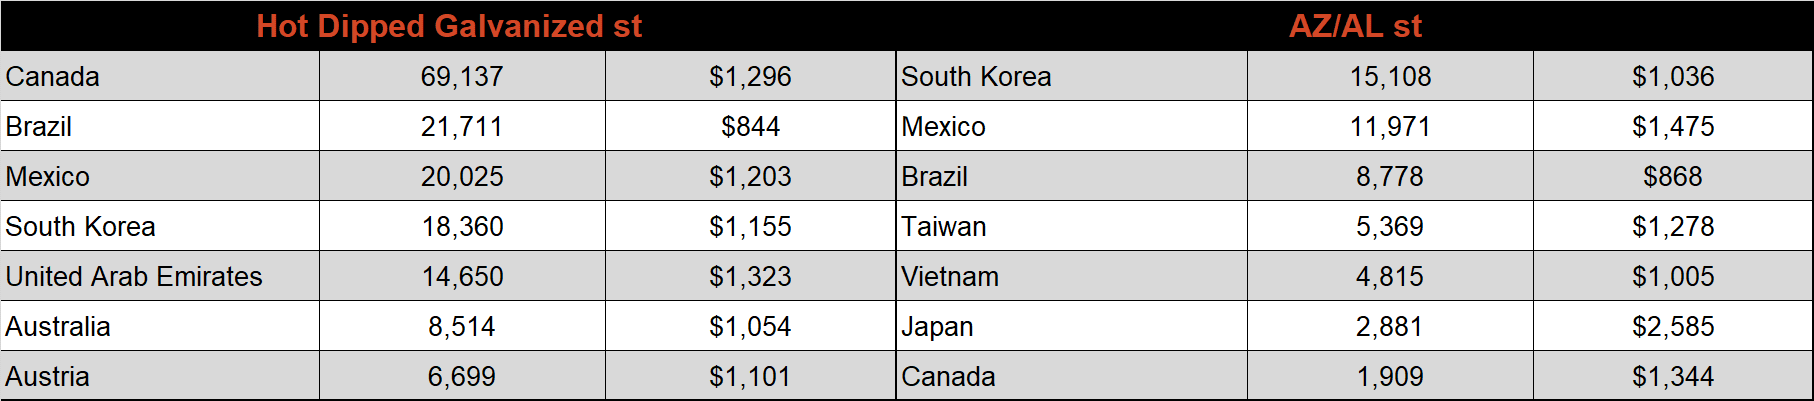
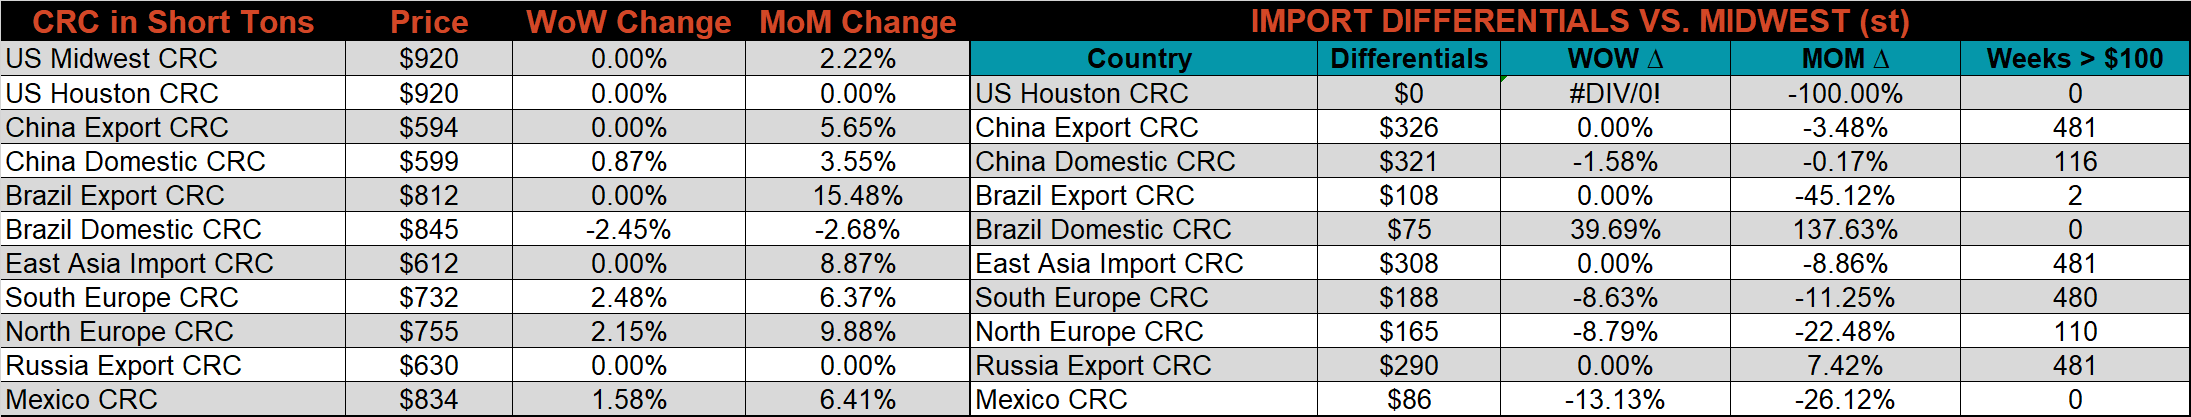
Below is December import license data through January 2nd, 2023.
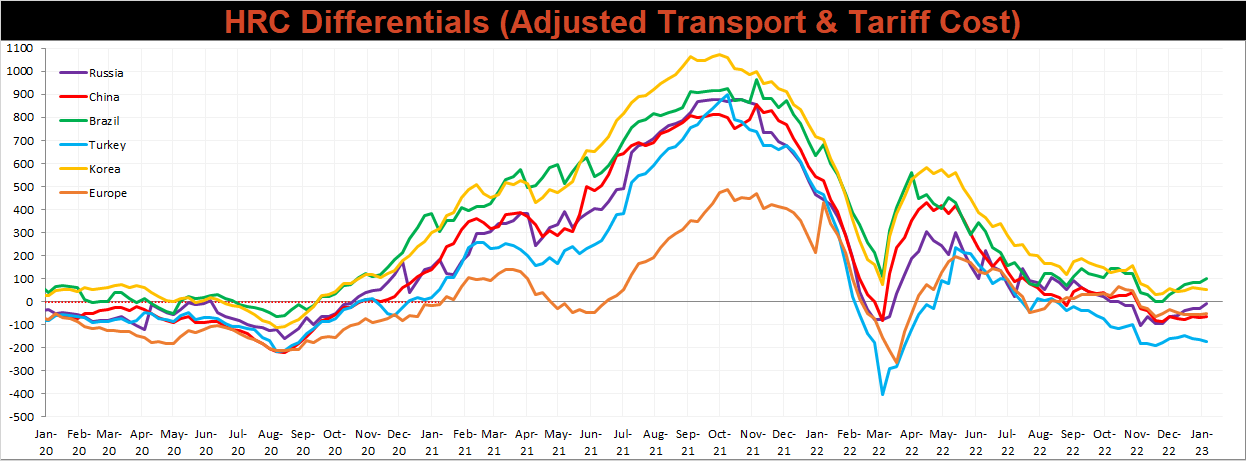
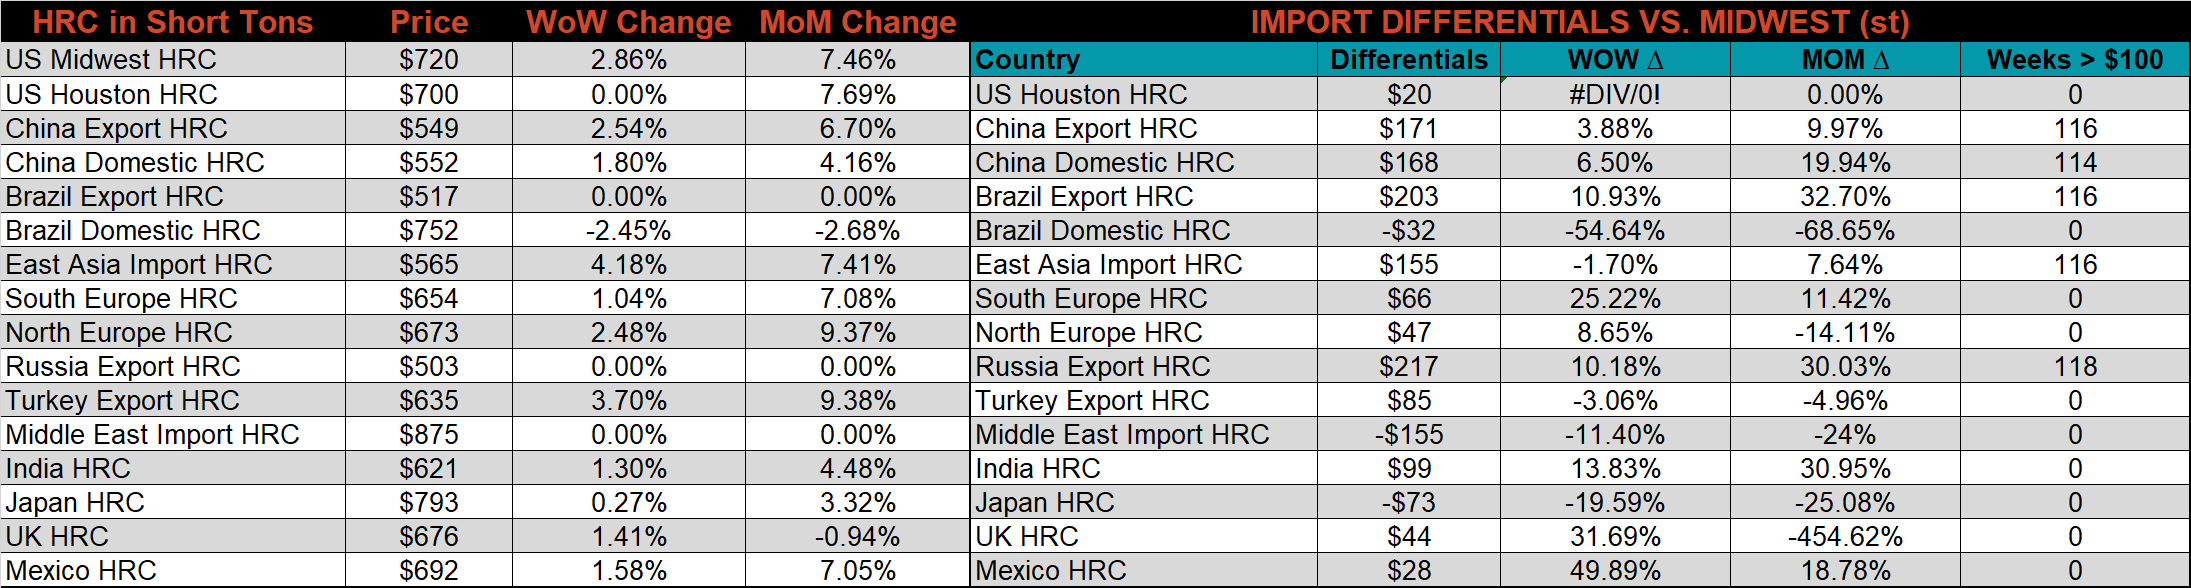
Below is the Midwest HRC price vs. each listed country’s export price using pricing from SBB Platts. We have adjusted each export price to include any tariff or transportation cost to get a comparable delivered price. The differentials for Turkey and Korea were slightly lower, while the remaining countries differentials all increased.
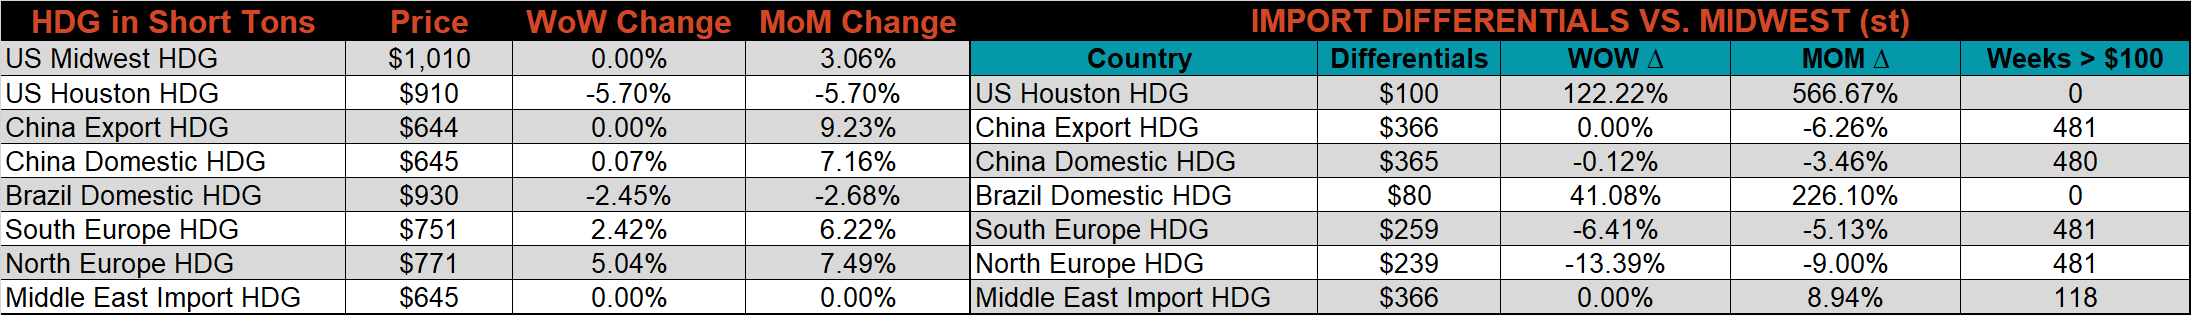
Global prices were mostly higher again this week, led by Northern European HDG, up 5%.
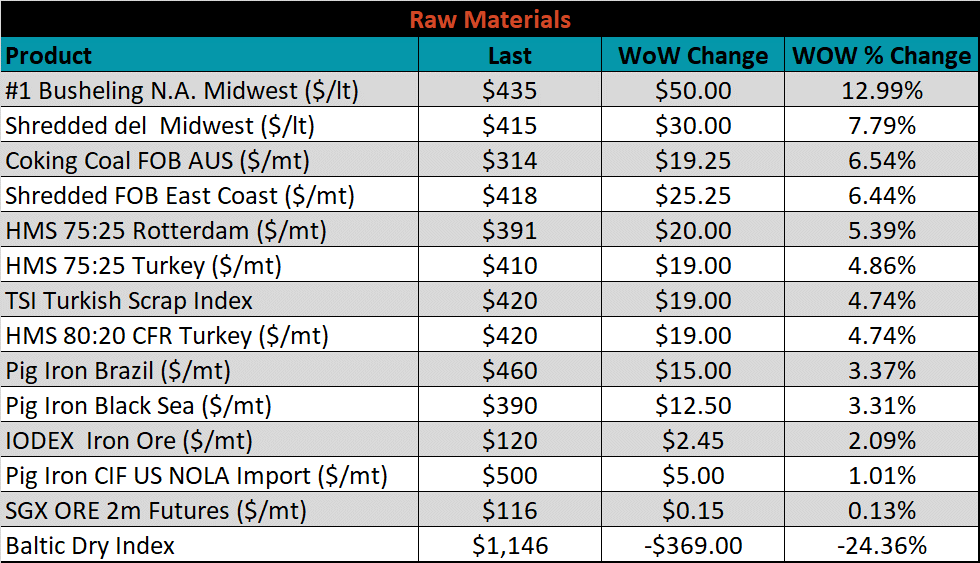
Raw Materials
Raw material prices were all higher this week, led by Midwest busheling up 13%, while the Baltic Dry Index was down sharply, 24.3%.
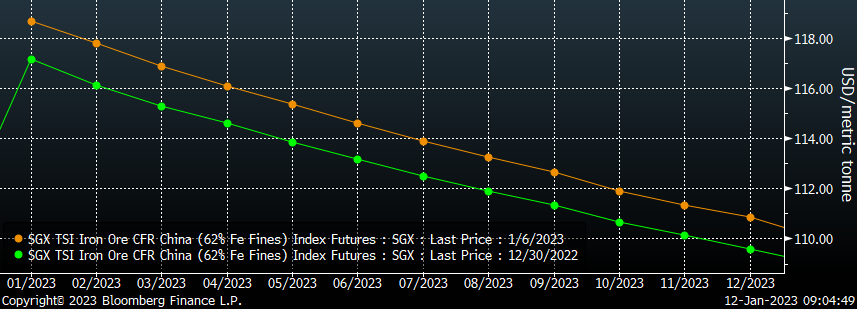
Below is the iron ore future curve with Friday’s settlements in orange, and the prior week’s settlements in green. Iron ore was up evenly across all expirations last week.
SGX Iron Ore Futures Curve
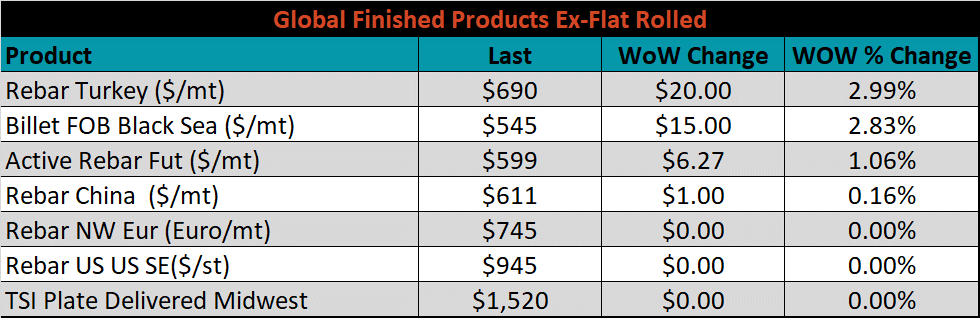
The ex-flat rolled prices are listed below.

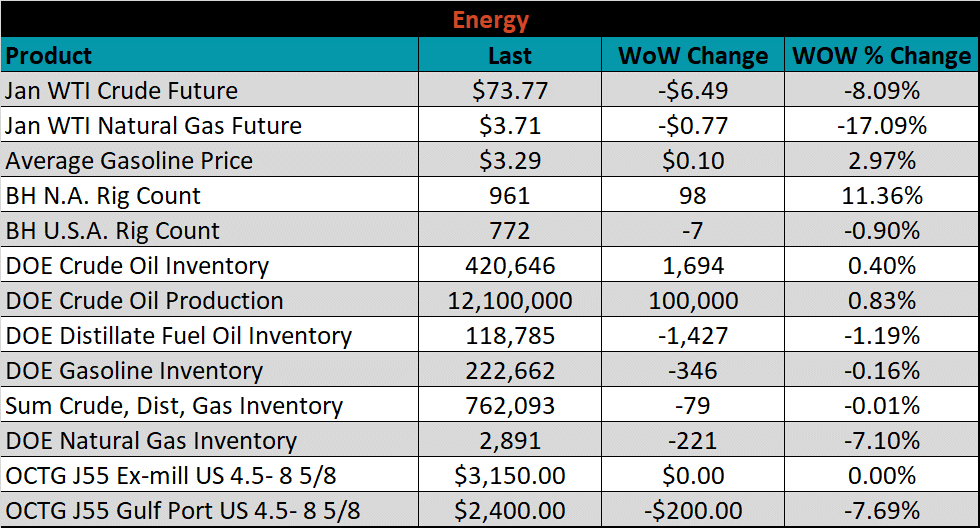
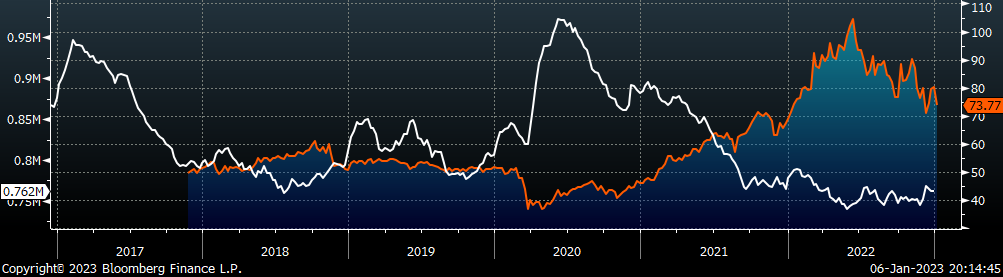
Energy
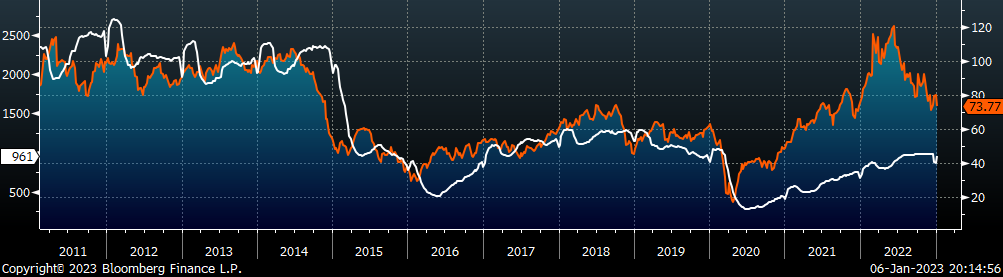
Last week, the Febuary WTI crude oil future lost $6.49 or 8.1% to $73.77/bbl. The aggregate inventory level was down 0.1%. The Baker Hughes North American rig count was up sharply, by 98 rigs, while the U.S. rig count decreased by 7 rigs.
February WTI Crude Oil Futures (orange) vs. Aggregate Energy Inventory (white)
Front Month WTI Crude Oil Future (orange) and Baker Hughes N.A. Rig Count (white)
The list below details some upside and downside risks relevant to the steel industry. The bolded ones are occurring or highly likely.
Upside Risks:
- Inventory at end users and service centers below normal operational levels
- A higher share of discretionary income allocated to goods from steel-intensive industries
- Changes in China’s policies regarding ferrous markets, including production cuts and exports
- Unplanned & extended planned outages, including operational issues leaving mills behind
- Energy issues abroad curtailing global production
- Easing labor and supply chain constraints allowing increased manufacturing activity
- Mills extending outages/taking down capacity to keep prices elevated
- Global supply chains and logistics restraints causing regional shortages
- Fluctuating auto production, pushing steel demand out into the future
- The threat of further protectionist trade policies muting imports
Downside Risks:
- Increased domestic production capacity
- Elevated price differentials and hedging opportunities leading to sustained higher imports
- Steel consumers substitute to lower cost alternatives
- Steel buyers and consumers “double ordering” to more than cover steel needs
- Tightening credit markets, as elevated prices push total costs to credit caps
- Supply chain disruptions allowing producers to catch up on orders
- Limited desire to restock at elevated prices, causing a “Buyer’s Strike”
- Economic slowdown caused by the emergence of Coronavirus Variants
- Reduction and/or removal of domestic trade barriers
- Political & geopolitical uncertainty
- Chinese restrictions in the property market
- Unexpected sharp China RMB devaluation