

January 7, 2022

Market Commentary
After turning the page on 2021 and entering the first week of the new year, the clear headline is mills have a big problem with their Q1 orderbooks. As the HRC price started to plateau at record high levels, the biggest question was how mills would react. Initially, the newly consolidated group of domestic producers held elevated offers, but as “temporary holes” continue to show up, they’ve so far elected to chase orders at lower prices rather than meaningfully reduce production. This makes sense with the record profitability they are making on the marginal ton produced. With the context of high levels of import arrivals at significantly lower prices (for the next couple months), it appears somewhat obvious that domestic mills need to price near “import busting” levels and stop the flow before regaining any leverage in the spot market. In the remainder of this week’s report, we will dig into the recently released economic data for an updated look at demand within the broader market.
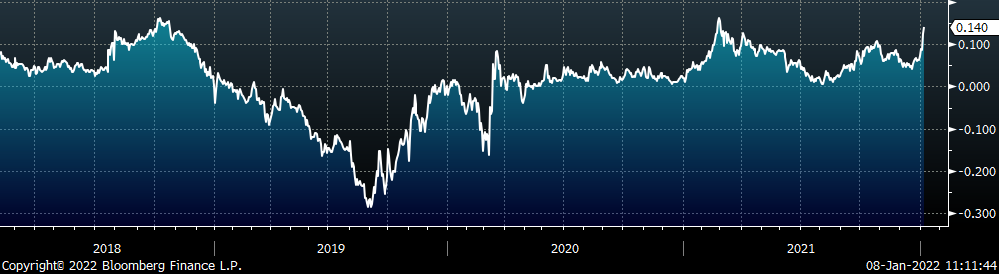
The chart below shows the ISM Manufacturing PMI backlog subindex (red) and the supplier deliveries subindex (blue). The backlog shows the level to which manufacturers have existing orders in their pipeline and supplier deliveries shows the tightness in the logistics market (high prints mean it is more difficult to ship).
ISM Manufacturing PMI Backlog Subindex (orange) & Supplier Deliveries (white)
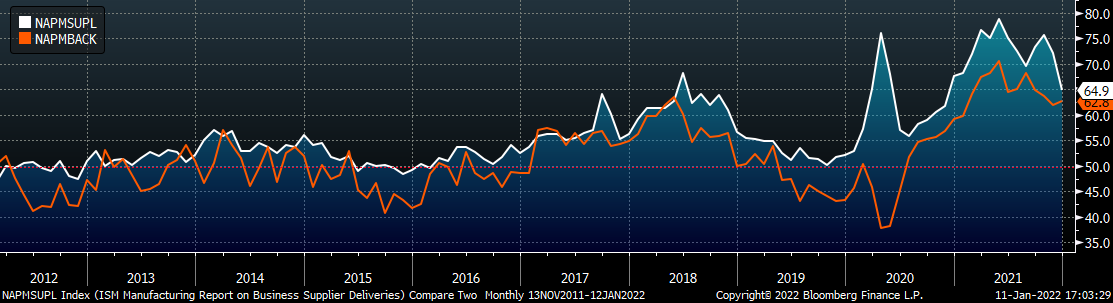
For those who are bullish on demand in the manufacturing sector, the record high levels in the backlog are one of the pillars of your conviction, and rightfully so. The problem, however, is that there is no way to separate whether the backlog is expanding because orders have been late (logistics issues). The backlog continuing to expand, while supplier deliveries ease (as they did this month) signals that demand for goods is fundamentally strong.
ISM PMI
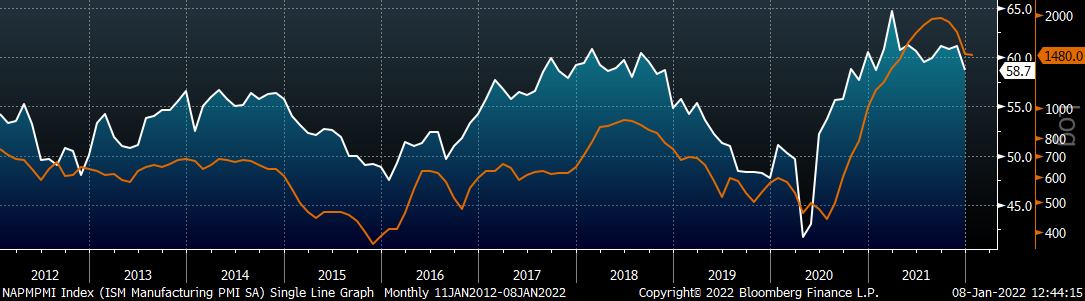
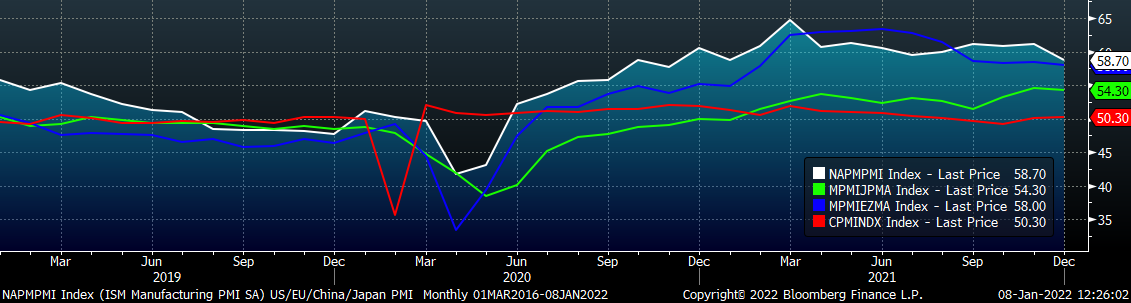
The chart below is the Platts Midwest HRC index (orange) and the ISM Manufacturing PMI (white). The topline ISM Manufacturing PMI printed lower but remains in expansion territory, while the Midwest HRC price continues its trend lower.
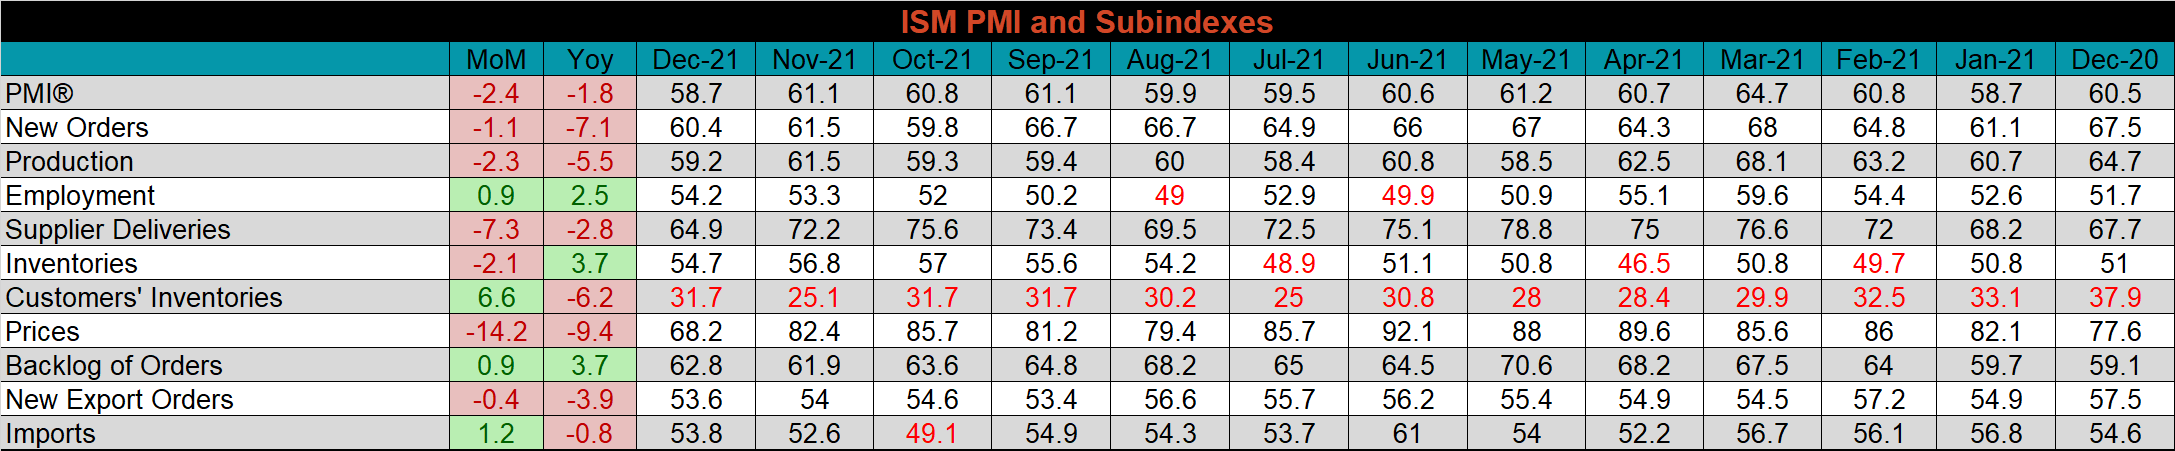
The December ISM Manufacturing PMI and subindexes are below.
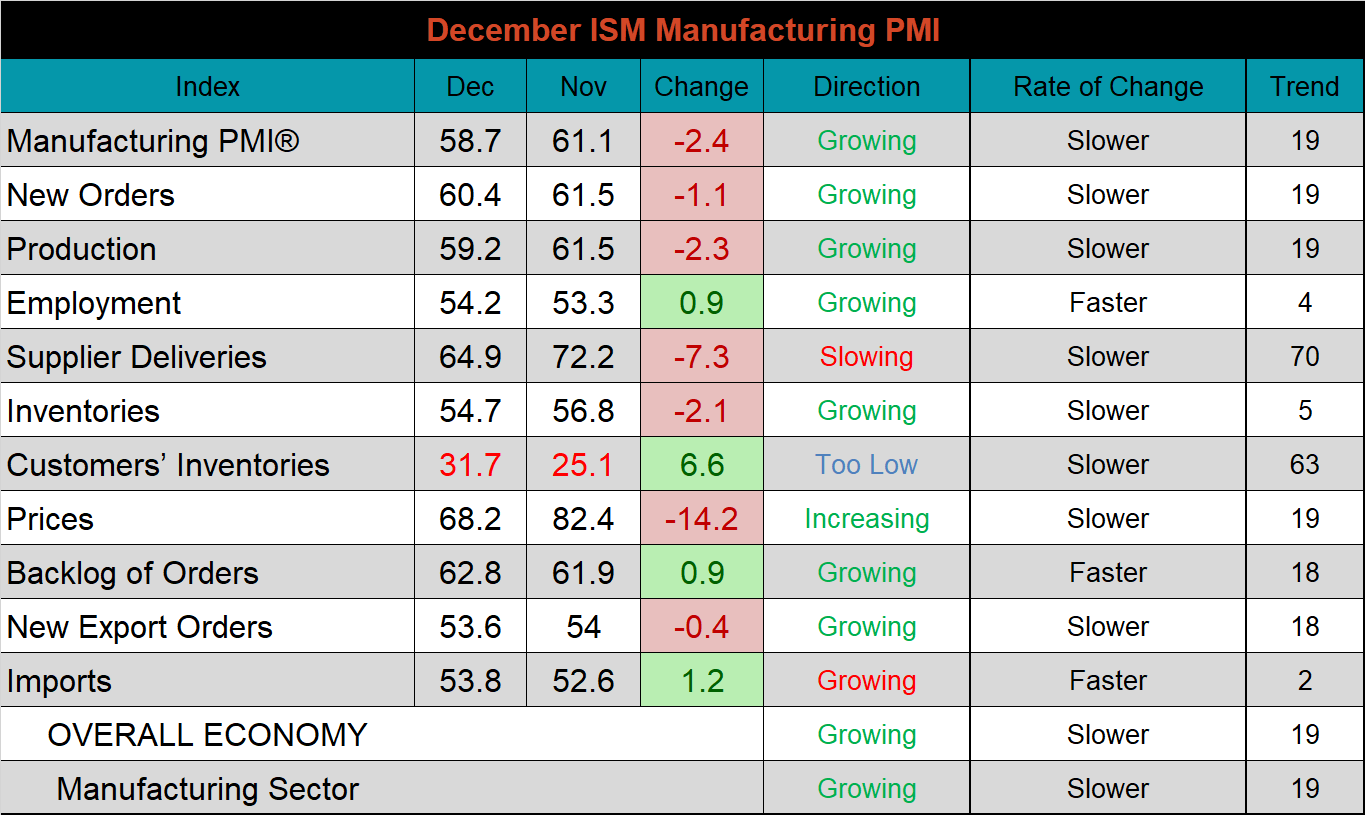
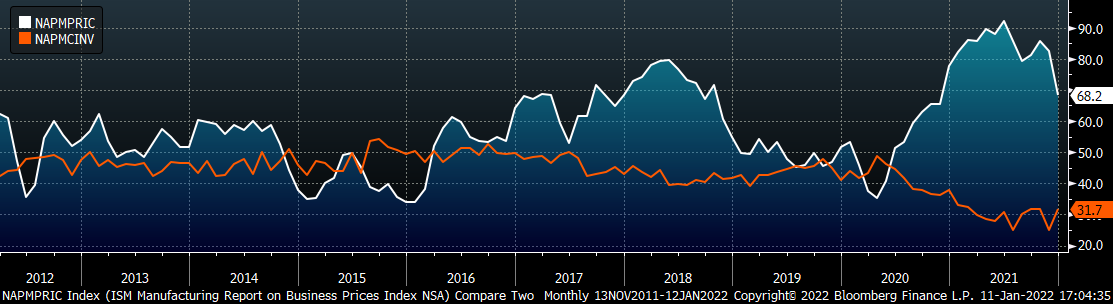
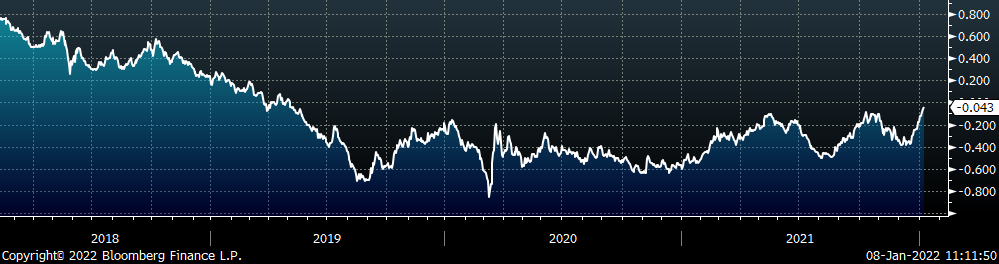
While the index remains wells in expansion territory, it is important to note that this month’s move lower represents the most significant MoM decline since the beginning of the pandemic. With that being said, the underpinnings of what led to record steel price (from a demand perspective) are mostly intact. New order and production continue to grow (albeit at a slower pace), while the employment levels grew at a faster pace. The chart below chart shows prices in white versus customer inventories in orange. Through much of the rally, we saw a historic dislocation between these two subindexes. While the spread between the two remains incredibly wide, customer inventories saw the most significant increase and prices saw the most significant decrease compared to the November readings. Continued convergence between the two will be an important signal of support for falling prices.
ISM Manufacturing PMI Customer Inventories (orange) & Prices (white)
The table below shows the historical values of each subindex over the last year.
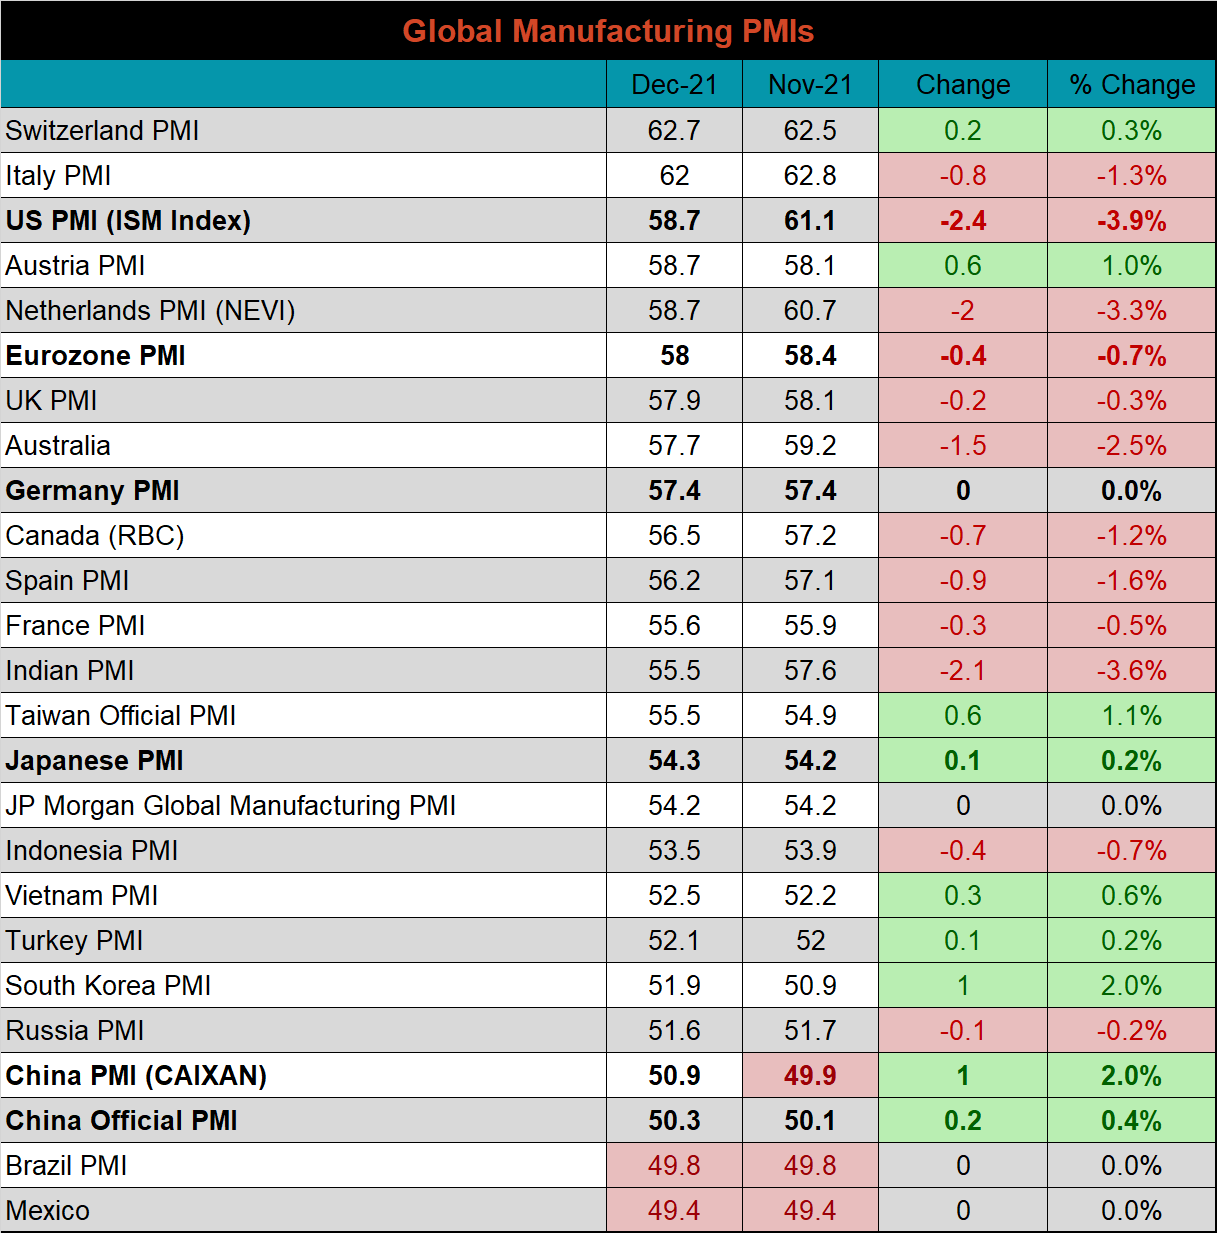
Global PMI
The December global PMI printings show a picture of slowing expansion. 14 of the 23 watched countries saw their respective manufacturing industries grow at a similar or slightly slower pace than in November. The five most significant countries (bold) expanded, with the Chinese (CAIXAN) PMI joining the rest in grow territory. Although some of this month’s readings dipped, only two of the watched countries saw a contraction in their manufacturing sector (Brazil and Mexico).
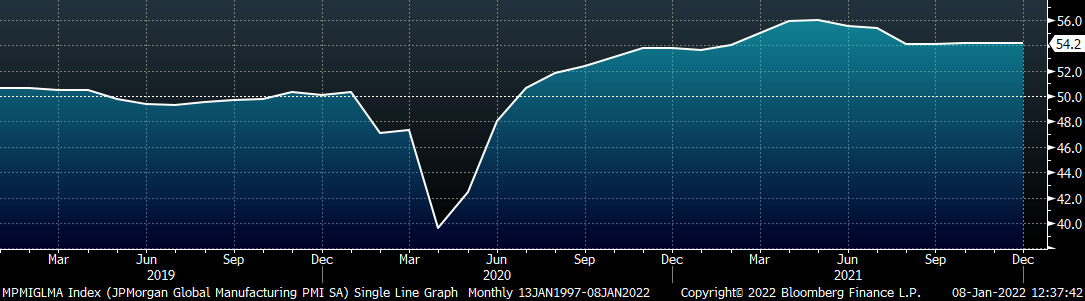
J.P. Morgan Global Manufacturing
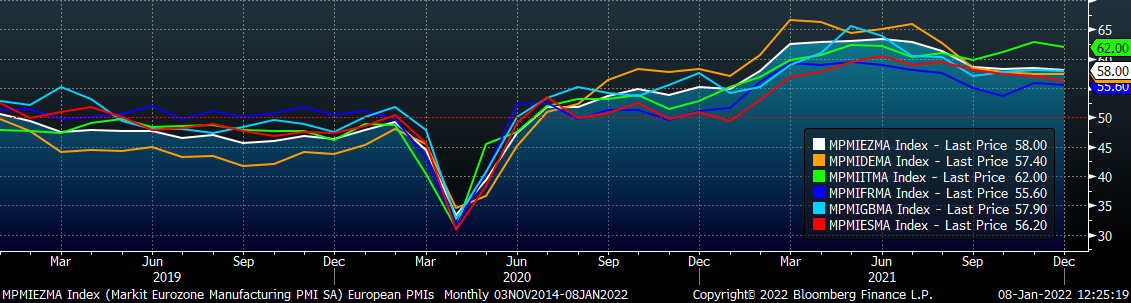
Eurozone (white), German (orange), Italian (green), Spanish (red), and French (blue), U.K. (teal) Manufacturing PMIs
US (white), Euro (blue), Chinese (red) and Japanese (green) Manufacturing PMIs
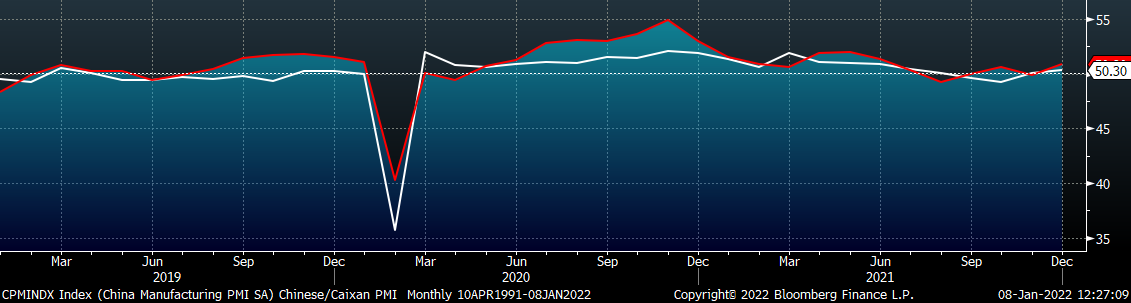
The Caixan PMI printed higher and now joins the Chinese official PMI in expansion territory.
China Official (white) and Caixan (red) Manufacturing PMIs
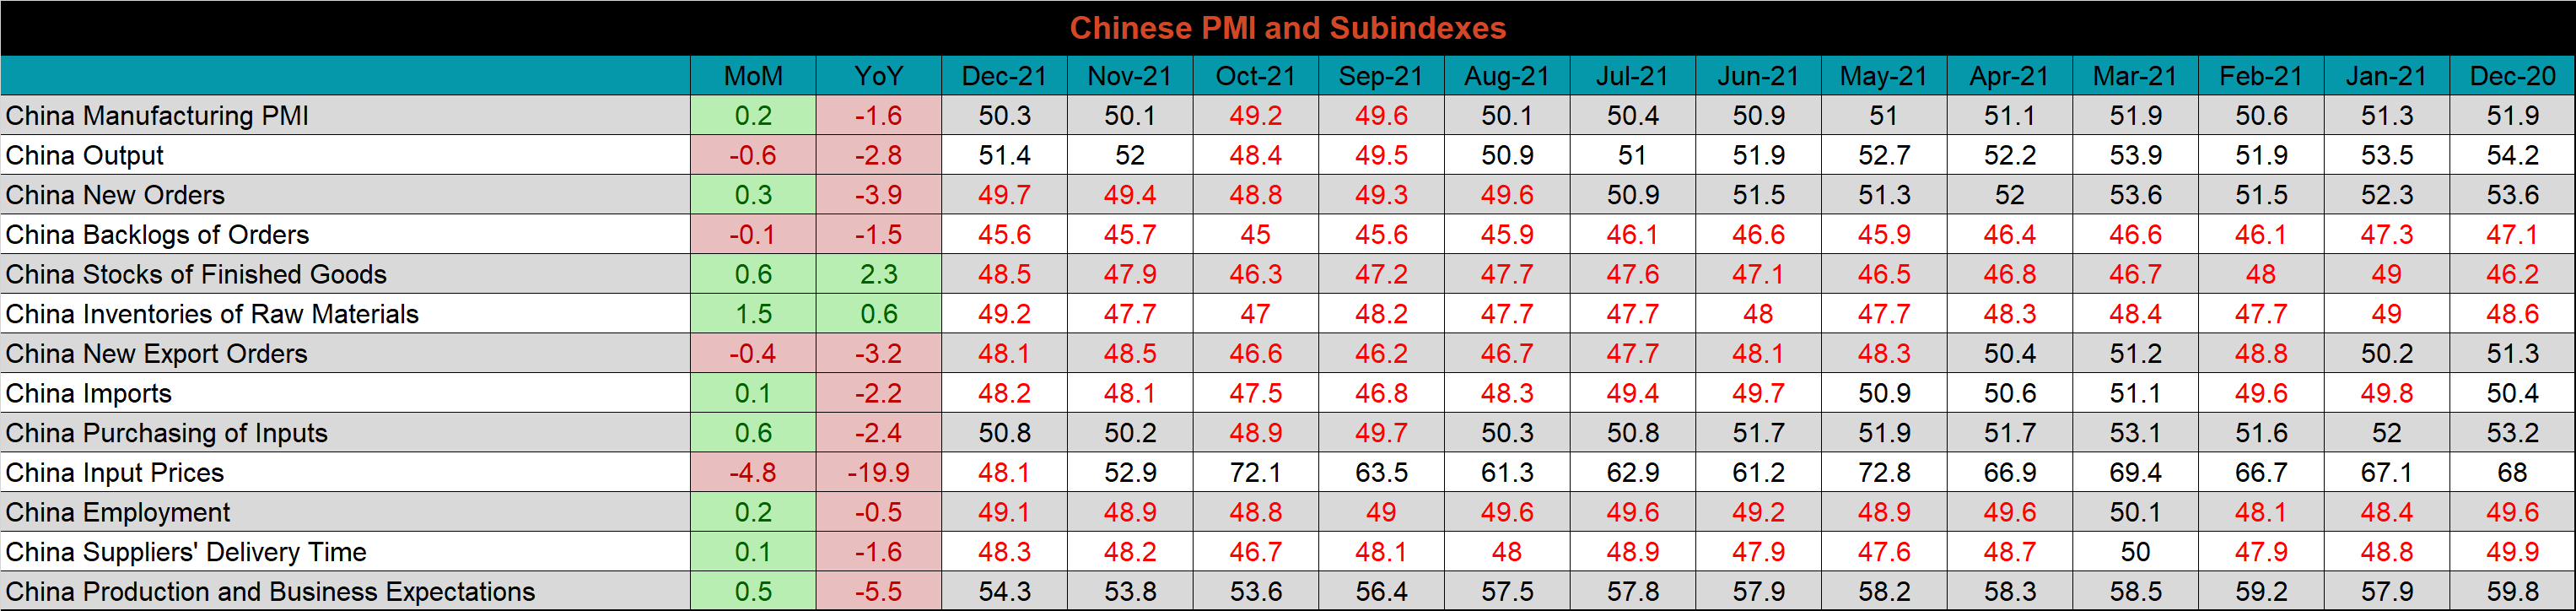
The table below breaks down China’s official manufacturing PMI subindexes. The biggest mover in the subindexes was input prices, which contracted slightly and is supportive of margins in the Chinese manufacturing sector.
Construction Spending
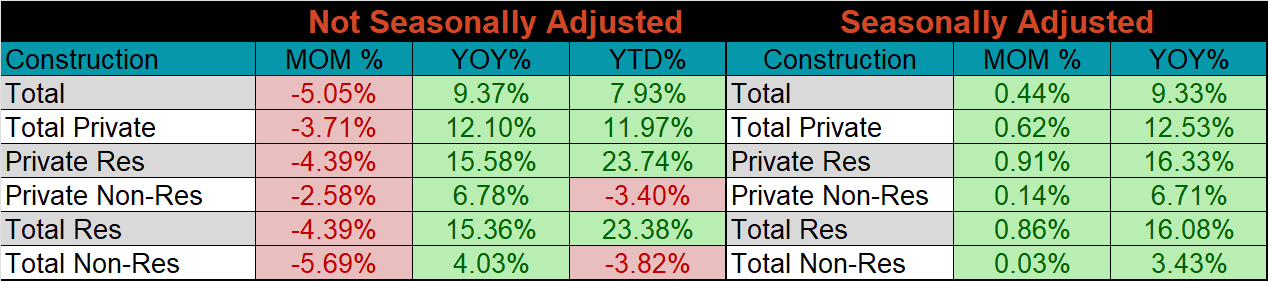
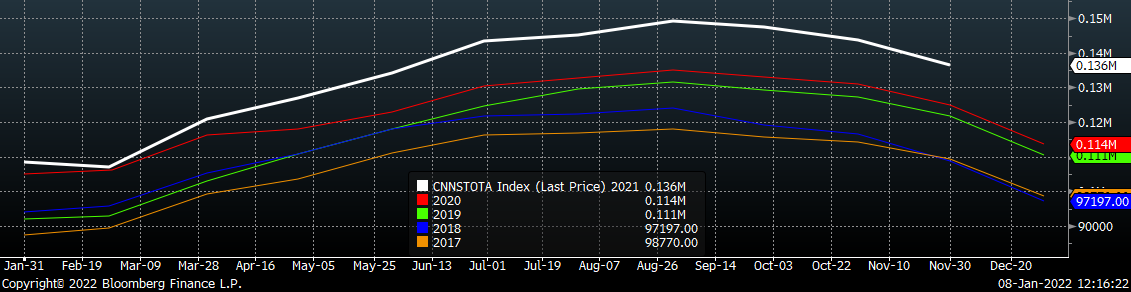
November seasonally adjusted U.S. construction spending was up 0.4% compared to October, and 9.3% higher than November 2020.
November U.S. Construction Spending
The white line in the chart below represents not seasonally adjusted construction spending in 2021 and compares it to the spending of the previous 4 years. Overall spending remains strong.
U.S. Construction Spending NSA
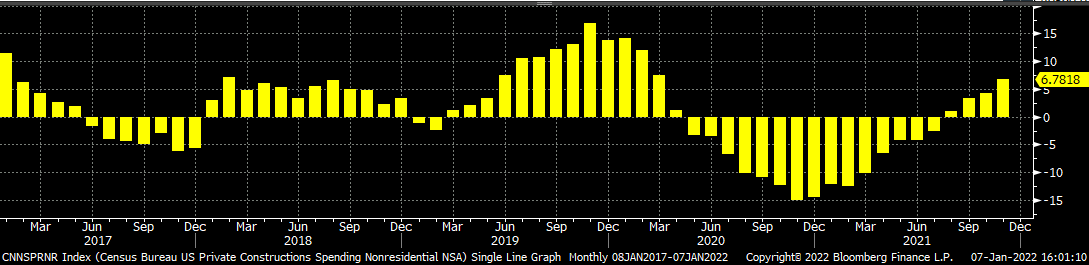
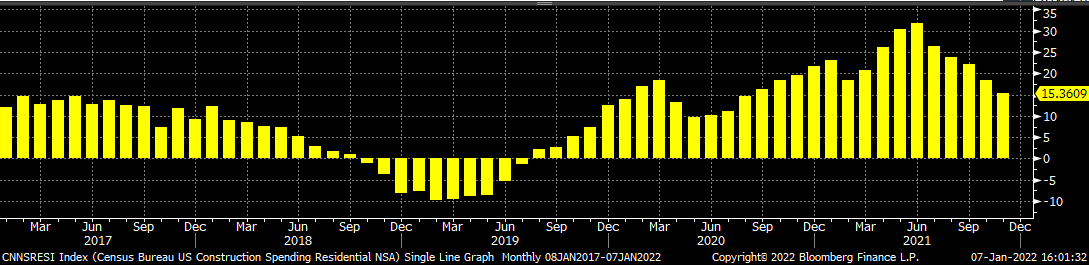
The two charts below show the YoY changes in construction spending, with YoY growth continuing for both spending categories. Non-residential spending has been trending higher since late 2020/early 2021, while the rate of growth for residential spending has slowed since June 2021.
U.S. Private Nonresidential Construction Spending NSA YoY % Change
U.S. Residential Construction Spending NSA YoY % Change
Auto Sales
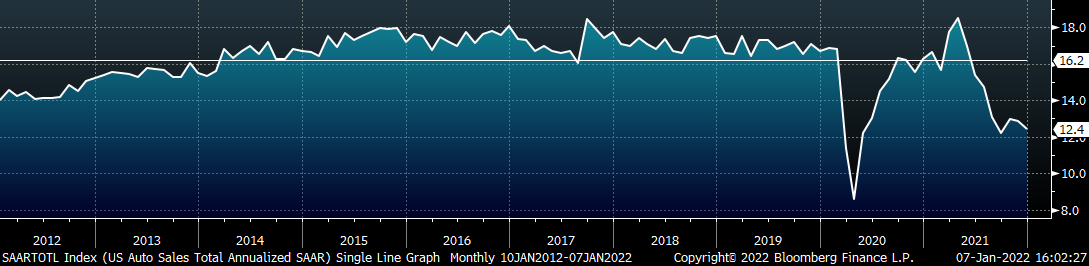
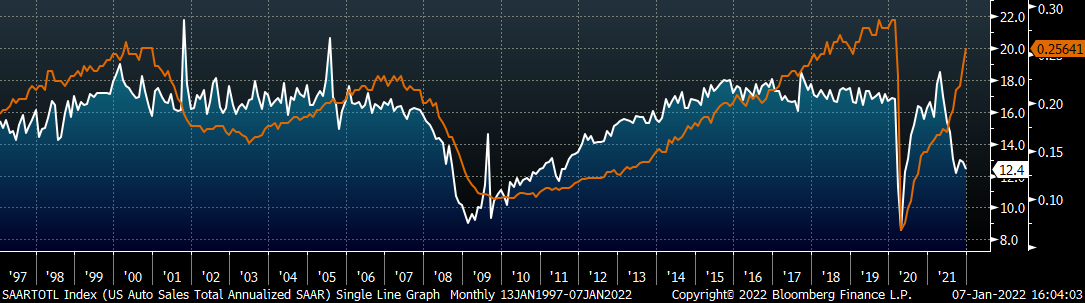
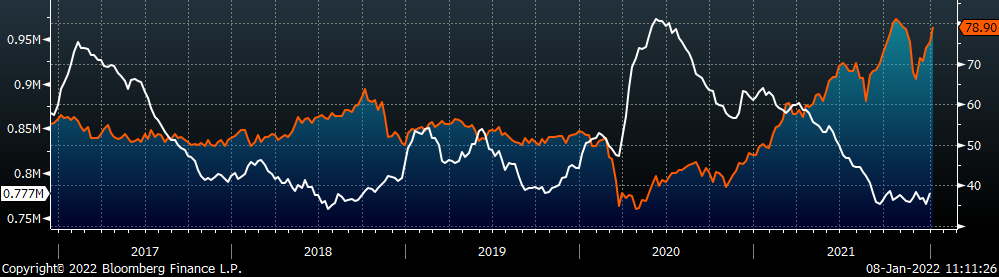
December U.S. light vehicle sales ticked slightly lower, to a 12.4m seasonally adjusted annualized rate (S.A.A.R). The second chart shows the relationship between the unemployment rate and auto sales. The unemployment rate is inverted to show that declining unemployment typically leads to increasing auto sales. The labor market recovery continued in December and supports the thesis of strong demand for cars once supply chain problems are sorted. We continue to view this as demand for steel that is pushed out, but not displaced.
December U.S. Auto Sales (S.A.A.R.)
December U.S. Auto Sales (orange) and the Inverted Unemployment Rate (white)
Risks
Below are the most pertinent upside and downside price risks:
Upside Risks:
- Inventory at end users and service centers below normal operational levels
- Higher share of discretionary income allocated to goods from steel intensive industries
- Changes in China’s policies regarding ferrous markets, including production cuts and exports
- Unplanned & extended planned outages, including operational issues leaving mills behind
- Energy & construction industry rebound
- Easing labor and supply chain constraints allowing increased manufacturing activity
- Mills extending outages/taking down capacity to keep prices elevated
- Global supply chains and logistics restraints causing regional shortages
Downside Risks:
- Increased domestic production capacity
- Elevated price differentials and hedging opportunities leading to sustained higher imports
- Steel consumers substitute to lower cost alternatives
- Steel buyers and consumers “double ordering” to more than cover steel needs
- Tightening credit markets, as elevated prices push total costs to credit caps
- Supply chain disruptions allowing producers to catch up on orders
- Limited desire to restock at elevated prices, causing a “Buyer’s Strike”
- Economic slowdown caused by the emergence of Coronavirus Variants
HRC Futures
All of the below data points are as of January 7, 2022.
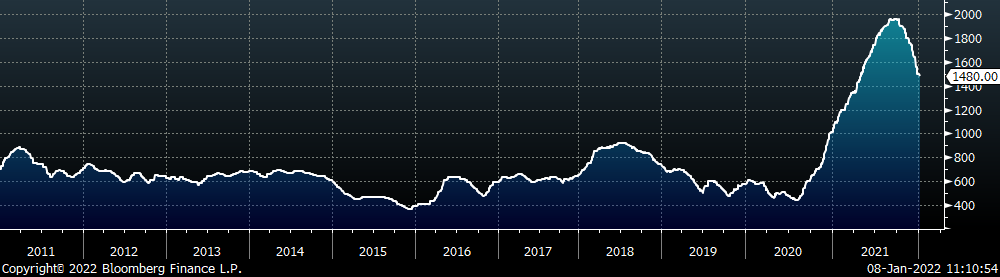
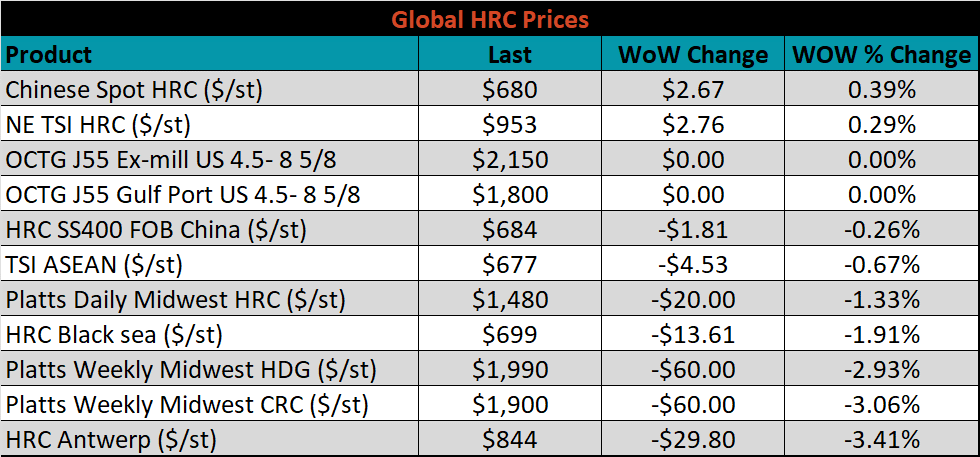
The Platts TSI Daily Midwest HRC Index decreased by another $20 to $1,480.
Platts TSI Daily Midwest HRC Index
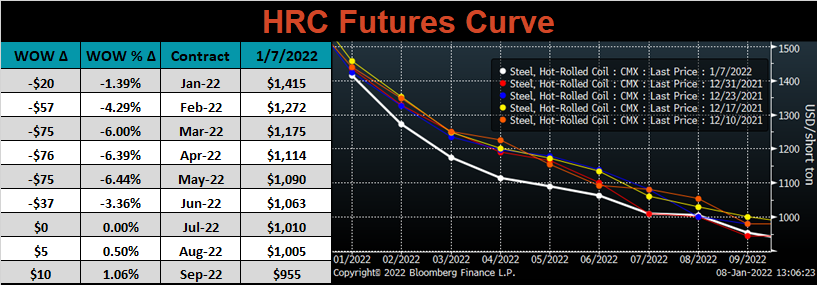
The CME Midwest HRC futures curve is below with last Friday’s settlements in white. Last week, the front of the curve was down sharply, while the back was mostly unchanged.
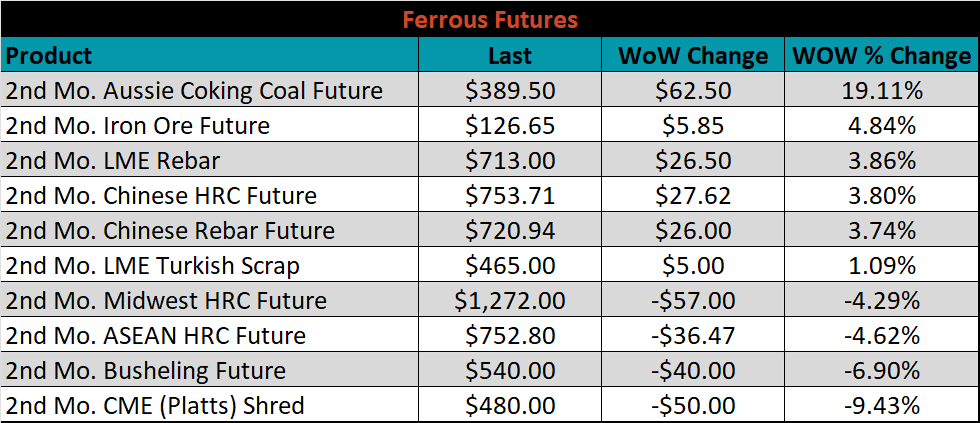
February ferrous futures were mixed. Aussie coking coal gained 19.1%, while shredded lost 9.4%.
Global flat rolled indexes were mostly lower again this week, led by Antwerp HRC, down 3.4%, while Chinese spot HRC was up 0.4%.
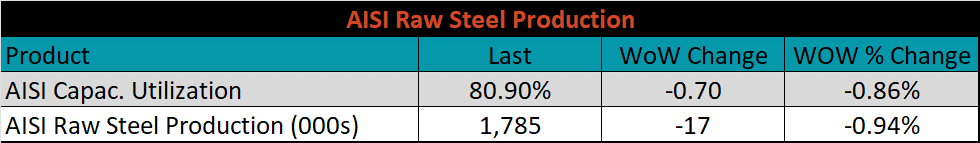
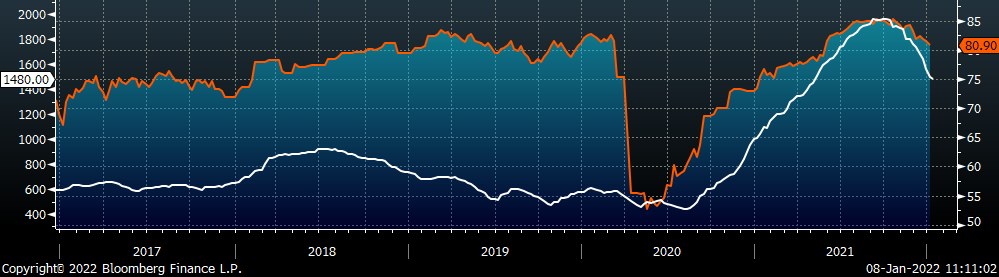
The AISI Capacity Utilization fell 0.7% to 80.9%. This also marks the first week that domestic mills produced below 1.8M tons of raw steel, since the end of May 2021.
AISI Steel Capacity Utilization Rate (orange) and Platts TSI Daily Midwest HRC Index (white)
Imports & Differentials
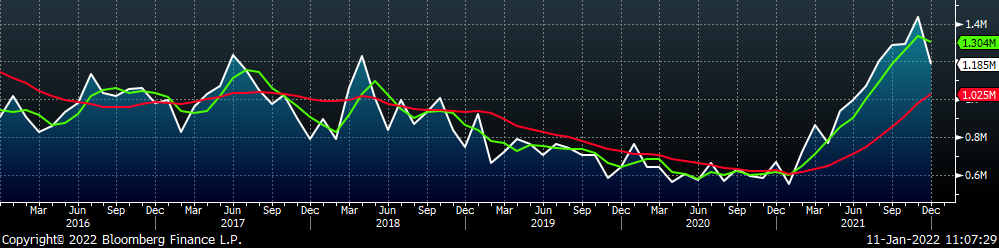
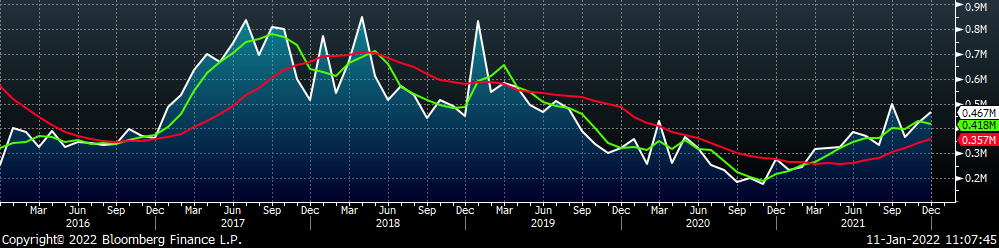
December flat rolled import license data is forecasting a decrease of 250k to 1.19M MoM.
All Sheet Imports (white) w/ 3-Mo. (green) & 12-Mo. Moving Average (red)
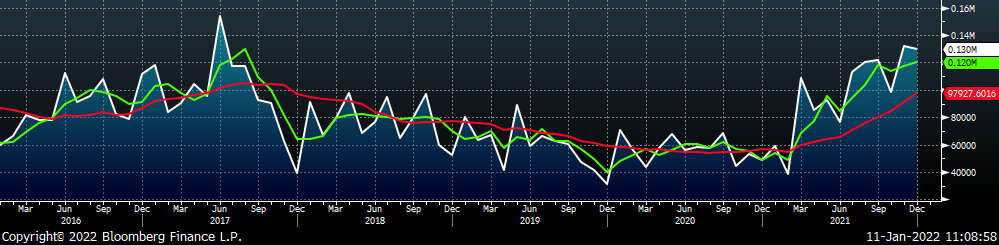
Tube imports license data is forecasting an increase of 47k to 467k in December.
All Tube Imports (white) w/ 3-Mo. (green) & 12-Mo. Moving Average (red)
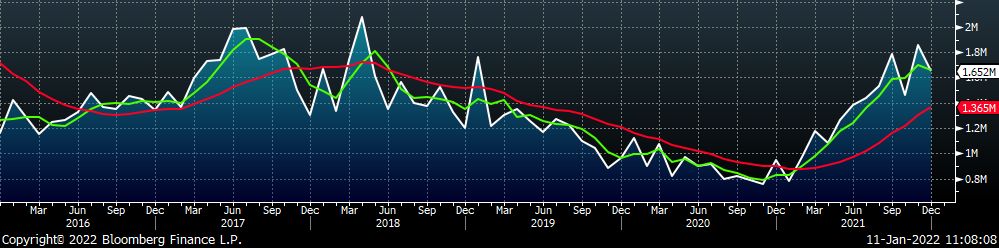
All Sheet plus Tube (white) w/ 3-Mo. (green) & 12-Mo. Moving Average (red)
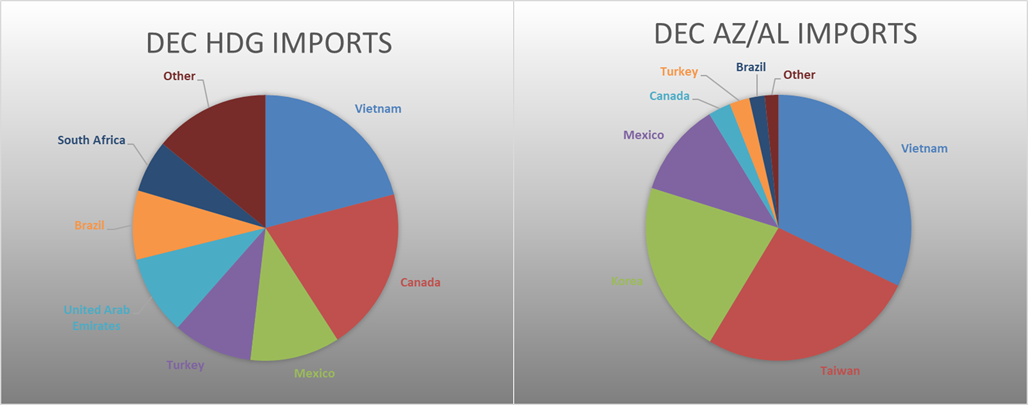
December AZ/AL import license data is forecasting a decrease of 2k to 130k.
Galvalume Imports (white) w/ 3 Mo. (green) & 12 Mo. Moving Average (red)
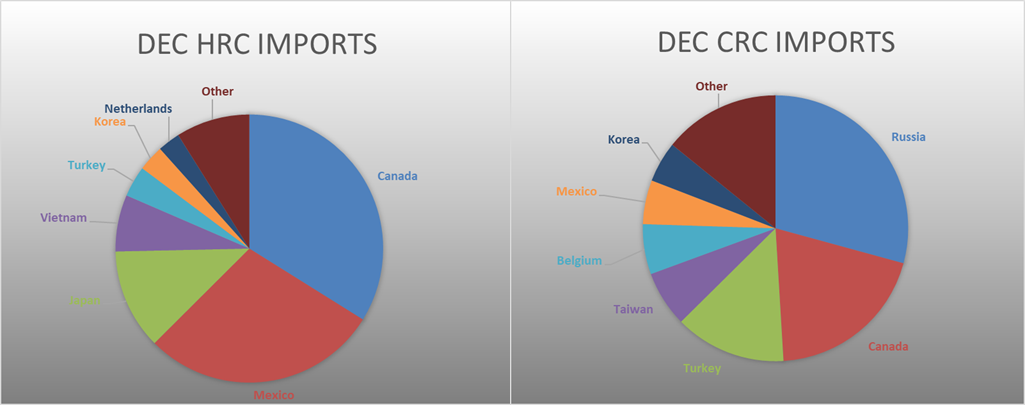
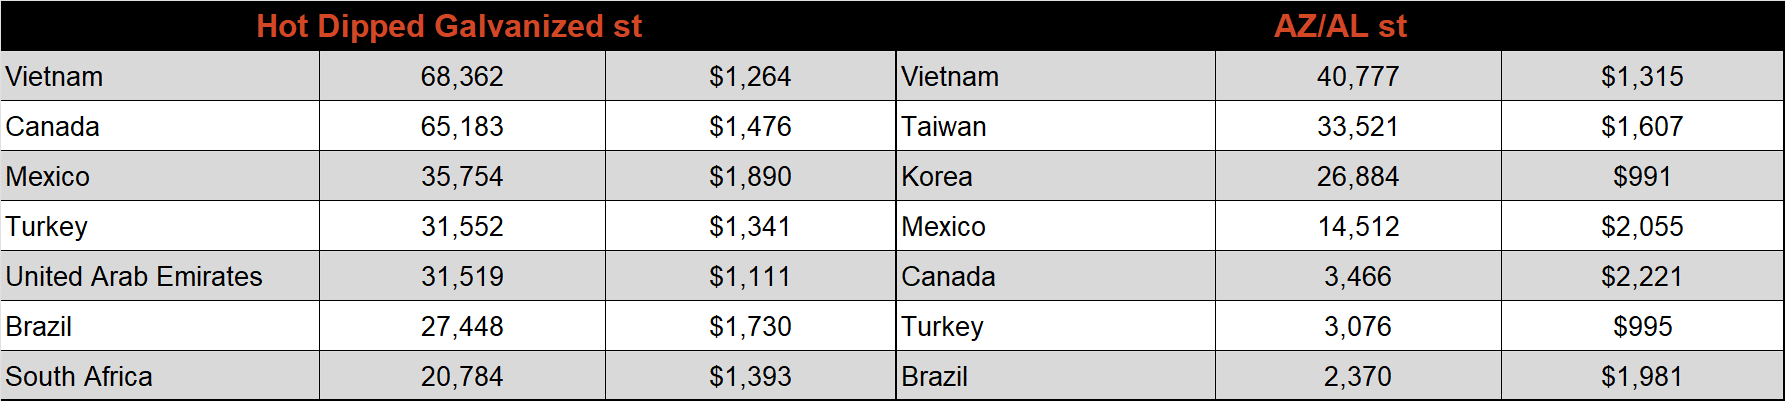
Below is December import license data through January 3rd, 2022.
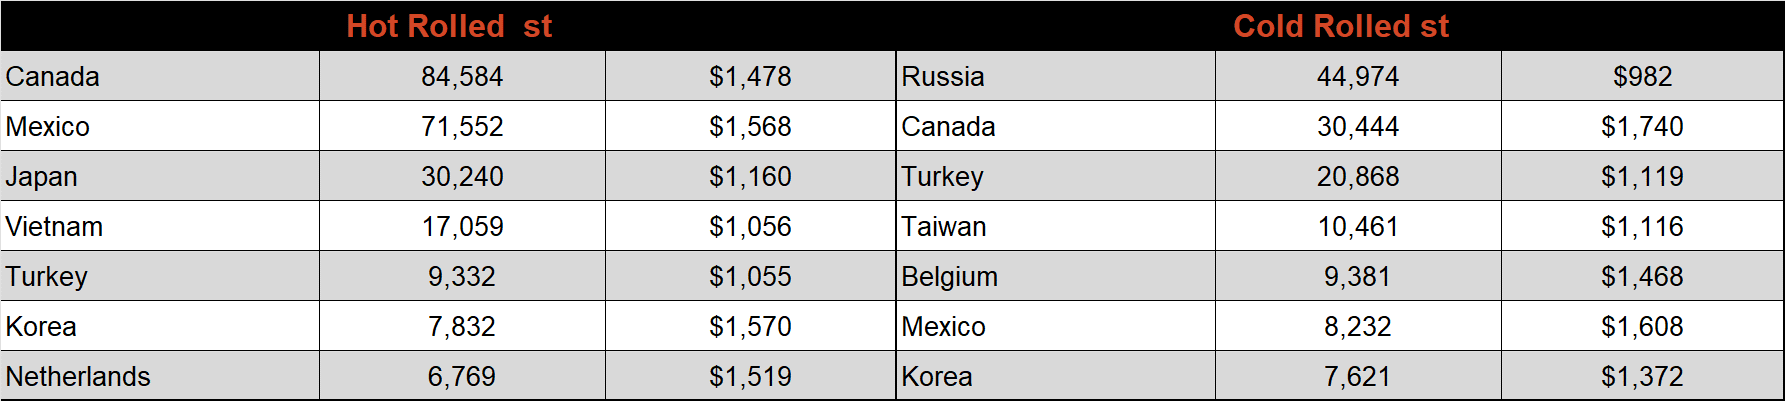
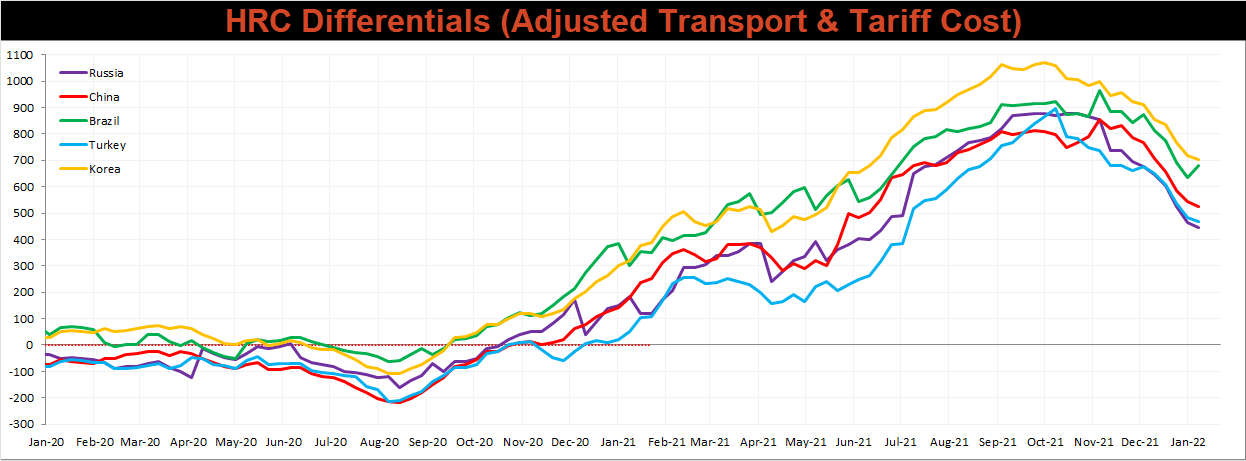
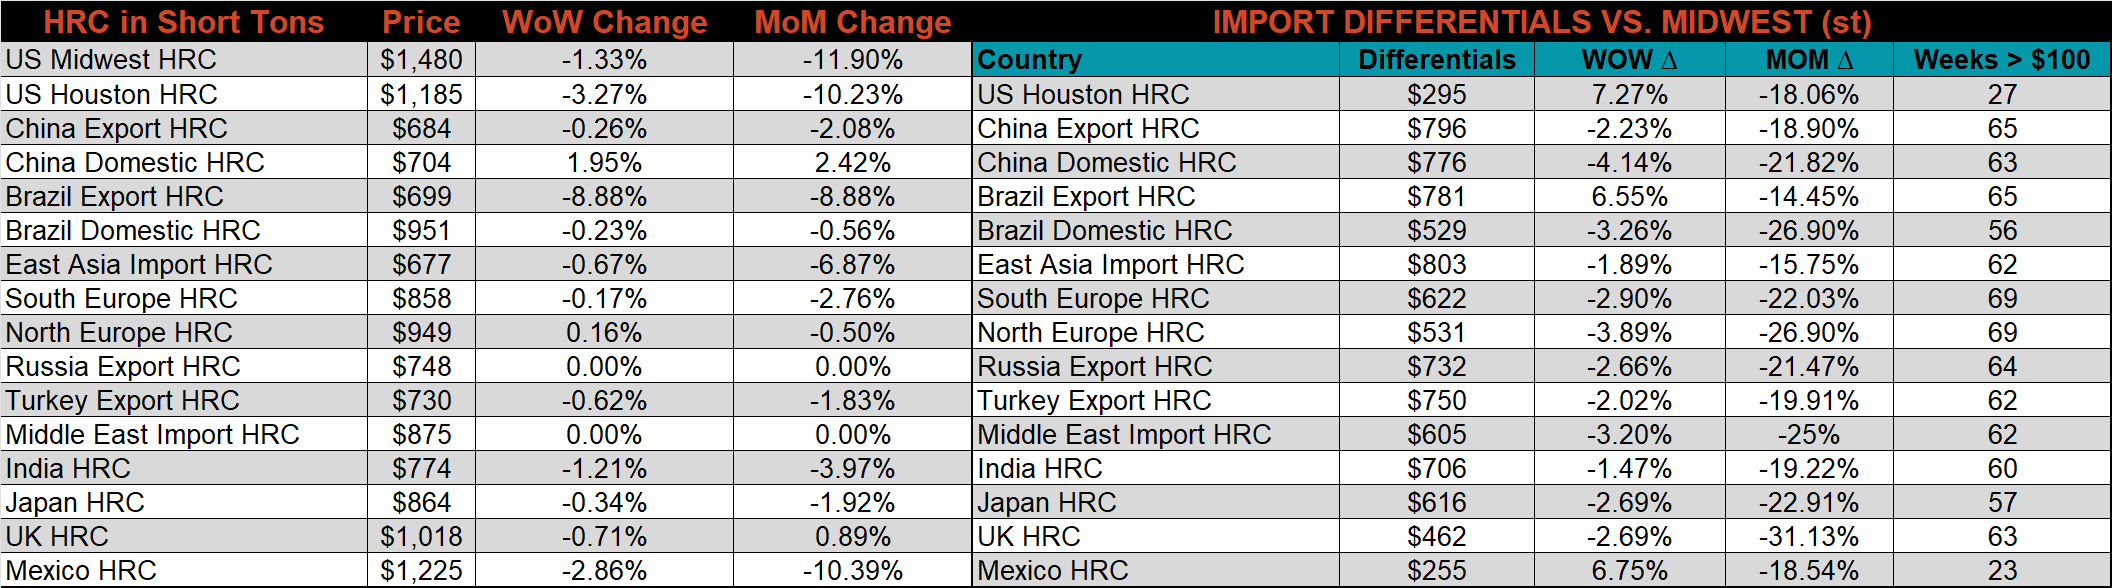
Below is the Midwest HRC price vs. each listed country’s export price using pricing from SBB Platts. We have adjusted each export price to include any tariff or transportation cost to get a comparable delivered price. All the watched countries differentials decreased for the 5th week in a row, except for Brazil, who had their export prices fall significantly lower.
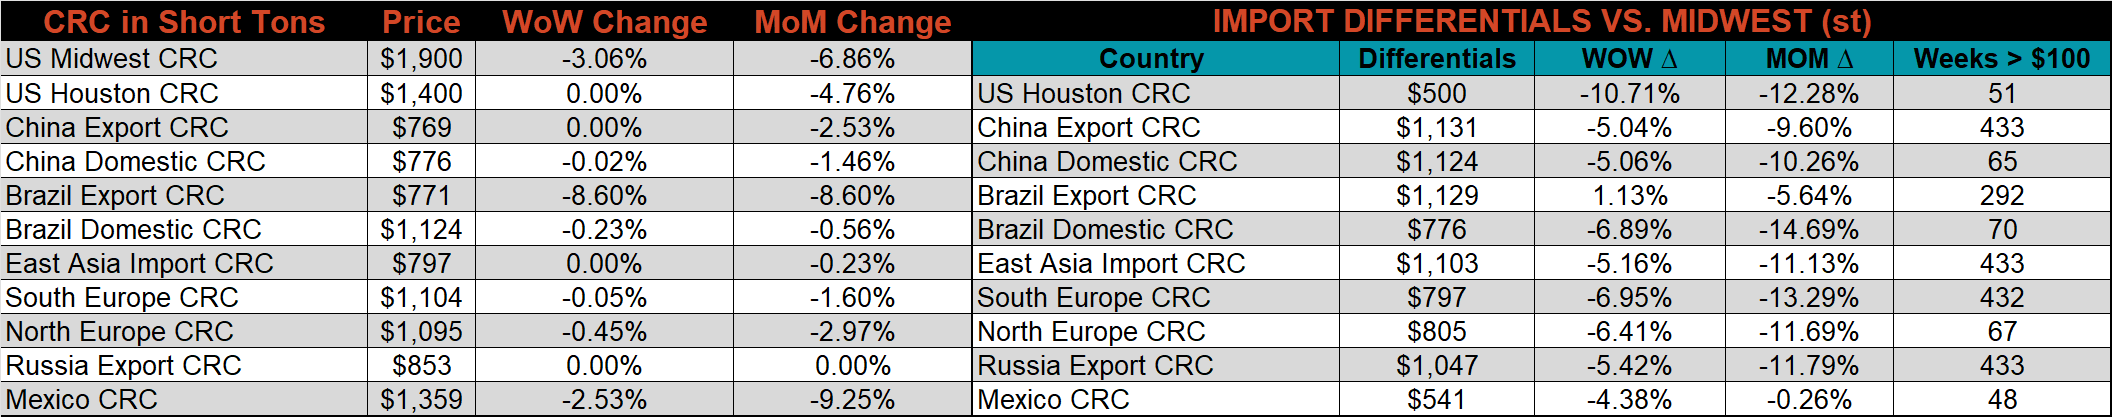
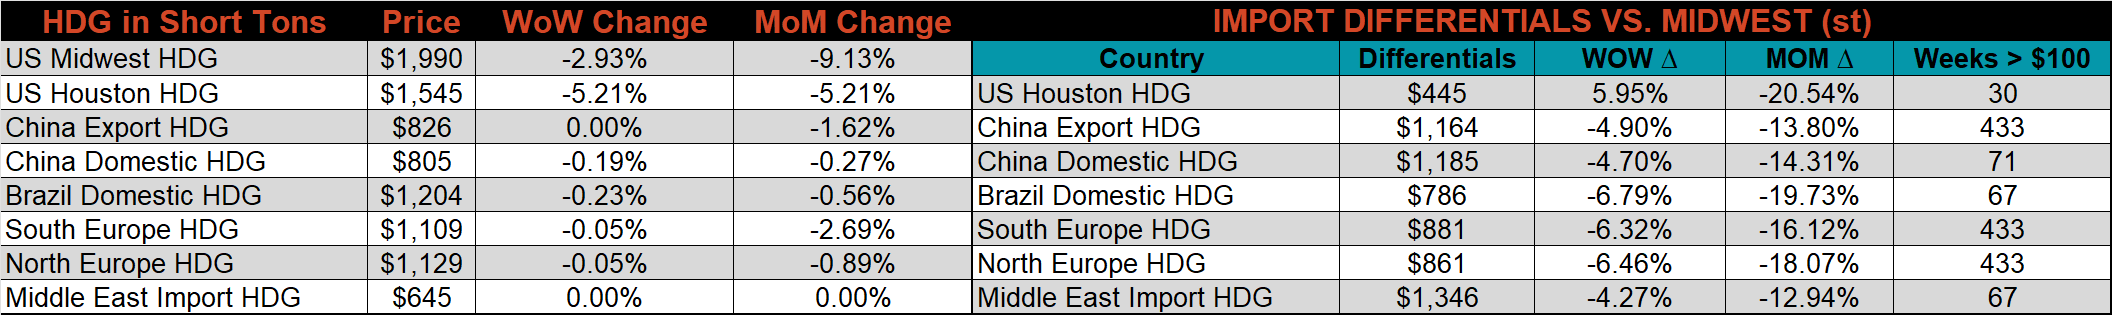
SBB Platt’s HRC, CRC and HDG pricing is below. The Midwest CRC, HDG & HRC prices were all lower this week, down 3.1%, 2.9% and 1.3%, respectively. Outside of the U.S., the Brazilian HRC export price was down 8.9%.
Raw Materials
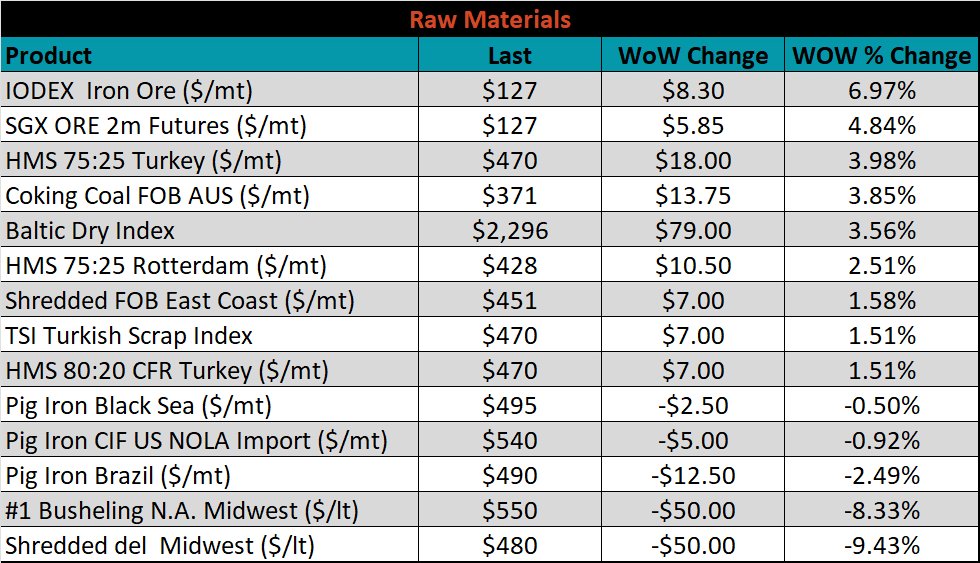
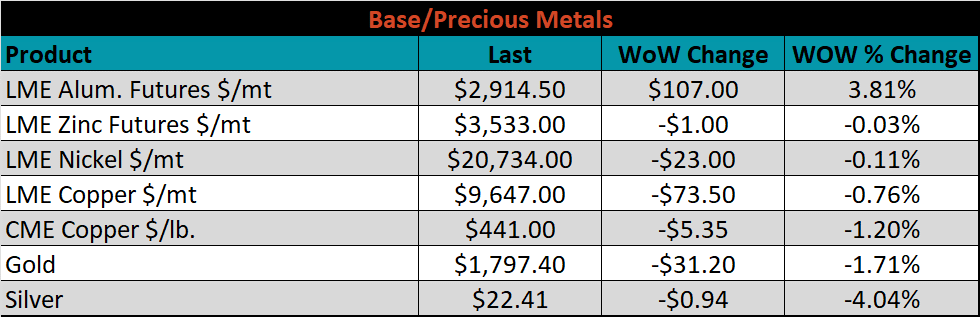
Raw material prices were mixed. Midwest shredded scrap lost 9.4%, while the IODEX iron ore index rose 7%.
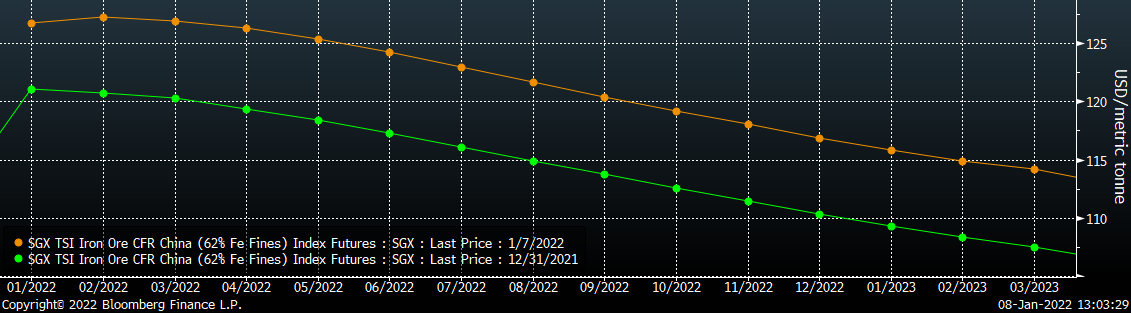
Below is the iron ore future curve with Friday’s settlements in green, and the prior week’s settlements in orange. Last week, the entire curve shifted higher, most significantly at the front expirations.
SGX Iron Ore Futures Curve
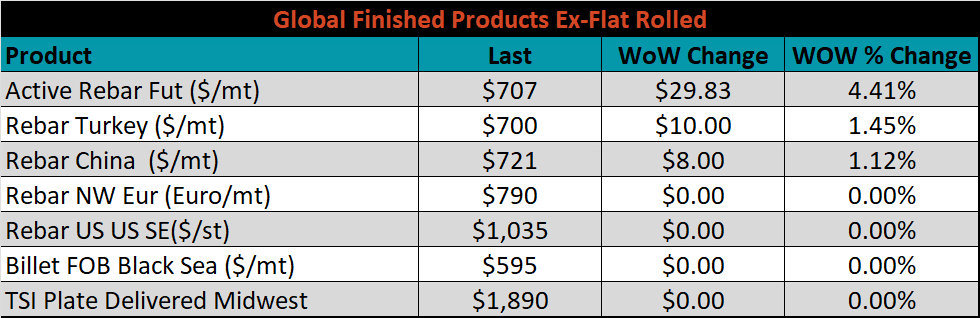
The ex-flat rolled prices are listed below.

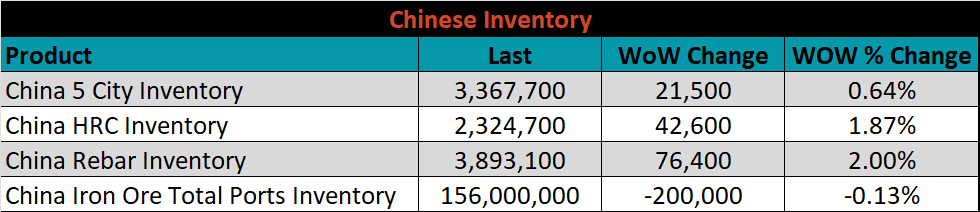
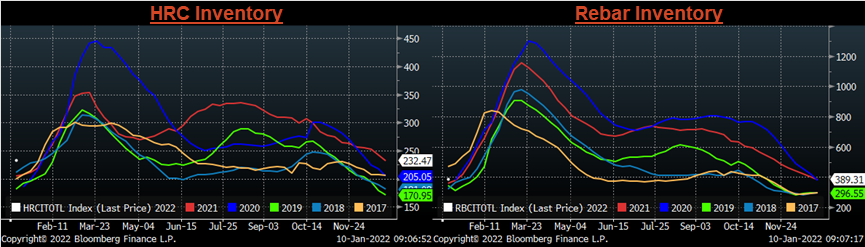
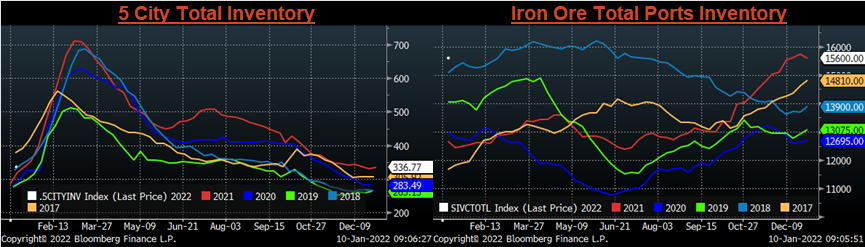
Chinese Inventory
Below are inventory levels for Chinese finished steel products and iron ore. The HRC, rebar, and 5-city Inventory levels rose this week, while iron ore inventories were slightly lower. Iron ore and HRC inventory levels are starting the year at historically high levels, compared to the last 5 years.
Energy
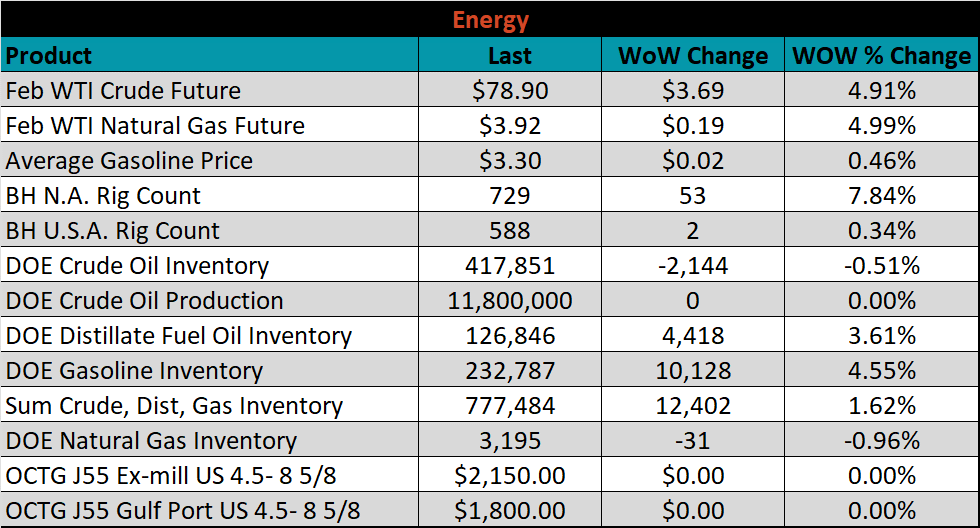
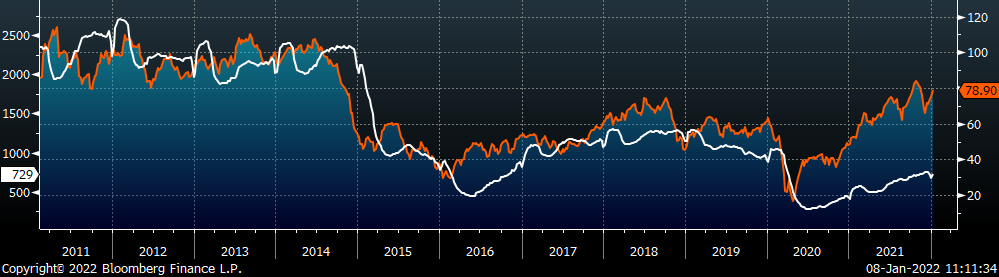
Last week, the February WTI crude oil future gained $3.96 or 4.9% to $78.90/bbl. The aggregate inventory level was up 1.6%, while crude oil production remains at 11.8m bbl/day. The Baker Hughes North American rig count rebounded with 53 rigs, while the U.S. rig count was up 2 rigs.
February WTI Crude Oil Futures (orange) vs. Aggregate Energy Inventory (white)
Front Month WTI Crude Oil Future (orange) and Baker Hughes N.A. Rig Count (white)
The list below details some upside and downside risks relevant to the steel industry. The bolded ones are occurring or highly likely.
Upside Risks:
- Inventory at end users and service centers below normal operational levels
- Higher share of discretionary income allocated to goods from steel intensive industries
- Changes in China’s policies regarding ferrous markets, including production cuts and exports
- Unplanned & extended planned outages, including operational issues leaving mills behind
- Energy & construction industry rebound
- Easing labor and supply chain constraints allowing increased manufacturing activity
- Mills extending outages/taking down capacity to keep prices elevated
- Global supply chains and logistics restraints causing regional shortages
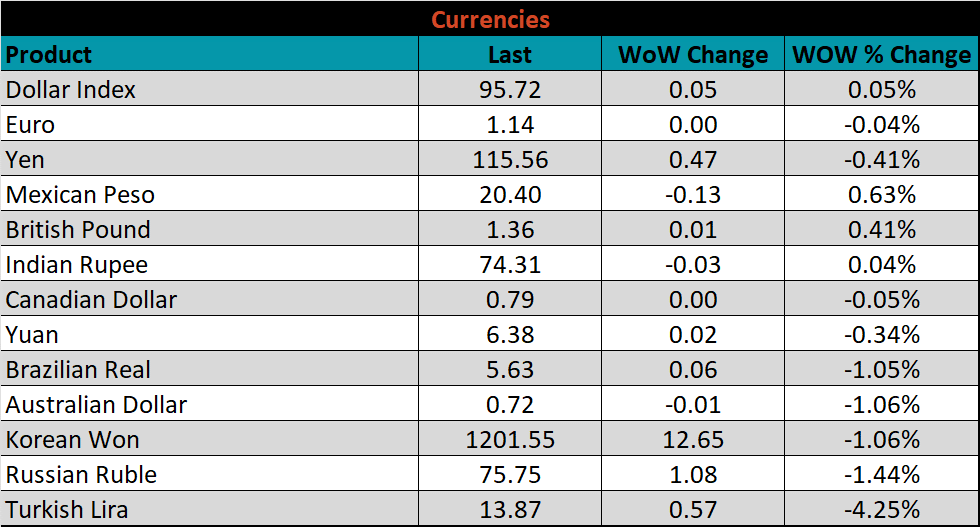
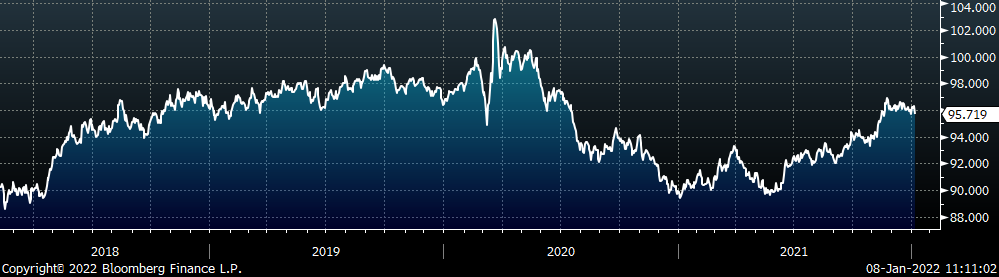
- A weakening US Dollar
- Fiscal policy measures including a new stimulus and/or infrastructure package
- Fluctuating auto production, pushing steel demand out into the future
- Low interest rates
- Threat of further protectionist trade policies muting imports
- Unexpected and sustained inflation
Downside Risks:
- Increased domestic production capacity
- Elevated price differentials and hedging opportunities leading to sustained higher imports
- Steel consumers substitute to lower cost alternatives
- Steel buyers and consumers “double ordering” to more than cover steel needs
- Tightening credit markets, as elevated prices push total costs to credit caps
- Supply chain disruptions allowing producers to catch up on orders
- Limited desire to restock at elevated prices, causing a “Buyer’s Strike”
- Economic slowdown caused by the emergence of Coronavirus Variants
- Reduction and/or removal of domestic trade barriers
- Political & geopolitical uncertainty
- Chinese restrictions in property market
- Unexpected sharp China RMB devaluation