Content
-
Weekly Highlights
- Market Commentary
- Risks


The spot HRC market remains in rally mode this week, with prices pushing up towards $1,100/st and mills eyeing even more increases in the weeks ahead. Due to strength in their contract orders and the apparent willingness from select end users to buy spot material at any price, mills have been able to maintain extended lead times and fill February order books without opening any spot tons. The strength in lead times indicates that it is unlikely for prices to move lower in the short term. If mills start seeing weakness in demand and shrinking backlogs, they will elect to let lead times fall before offering tons at lower prices. In short, at a cycle peak, lead times fall first, with prices lagging the move downward. This leads to the question we will discuss this week – How much control do mills have on the price?
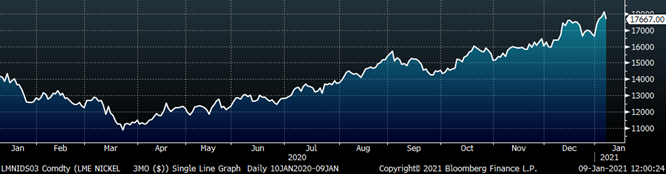
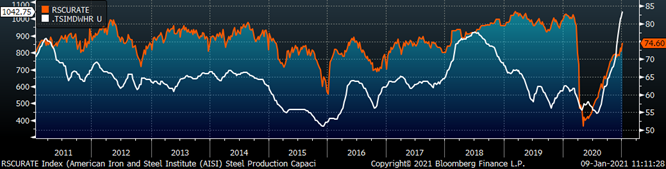
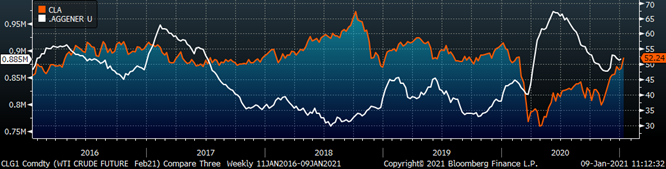
We consistently hear complaints during rising price cycles about the mills unjustifiably raising prices, and harming steel consumers. Domestic producers have significant influence over the total supply in the market, especially after recent consolidation, which they adjust based on market conditions to maximize their profits. The two main drivers of profitability are selling prices and quantity of tons sold. Despite the price strength over the past 5 months, production levels remain well below last year’s levels. If increasing production would increase mill profitability, why have mills refrained from doing so? Some think that increasing production would halt the extraordinary price rally that benefits the mill. But another possible explanation is their production is constrained because they are struggling to secure the raw materials necessary to produce more. The below chart shows the rolling 2nd month future for HRC (orange) and busheling (white).
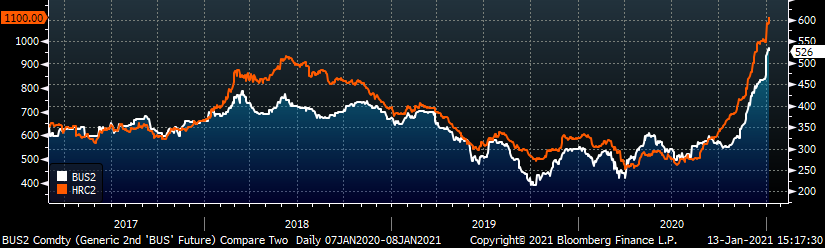
Mills have been reluctant to open order books into the future over the past few months, partly because they were unsure how much scrap they would be able to buy. As the January scrap market became clearer at the beginning of the year, scrap prices accelerated higher, closing the spread that was growing with HRC prices. This jump in prices reflects tightness in the scrap market, and while we won’t know how much scrap mills were able to secure, we do know that this tightness will act as a constraint on the mills’ production levels and pricing power.
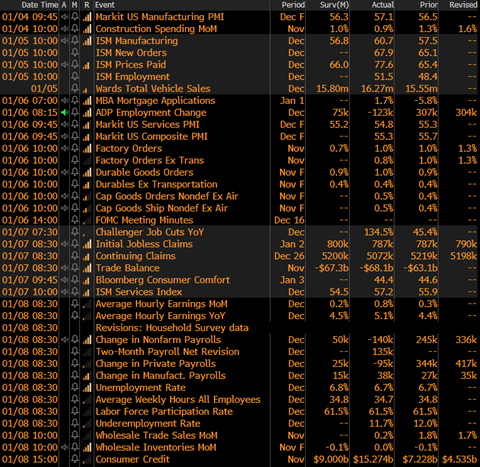
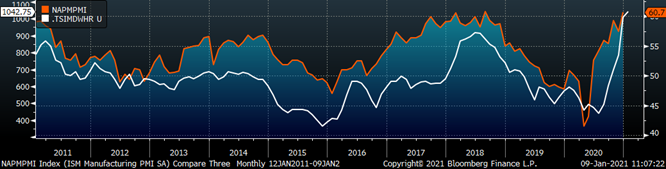
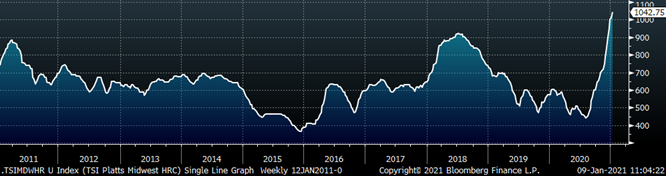
While the above shows the limits of the mills’ price control based on their influence on supply, the more important factor for pricing is demand. The below report contains many important economic data points that were released last week, but here’s a brief summary: The economic recovery continues to push market prices (stocks, oil, interest rates) higher, with an especially strong manufacturing sector. The first chart below shows the ISM PMI Index compared the Midwest HRC price, reflecting the importance of manufacturing demand on steel pricing. The strength in the December report is supportive of prices going forward, and the strength in the historical relationship shows that demand is a more significant driver of HRC pricing compared to the will of the mills.
The chart below shows the relationship between the Platts Midwest HRC index and the ISM Manufacturing PMI over the past 10 years.
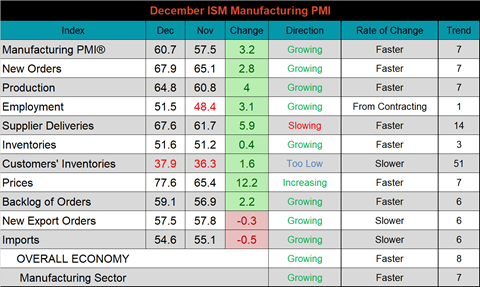
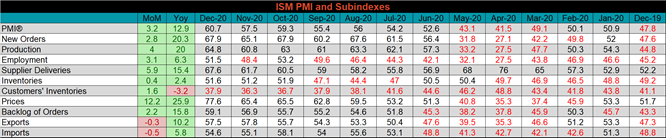
The December ISM Manufacturing PMI and subindexes are below. The topline PMI number was up 3.2 points to 60.7 and pushed higher into expansion territory.
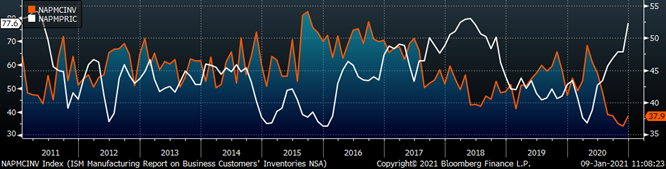
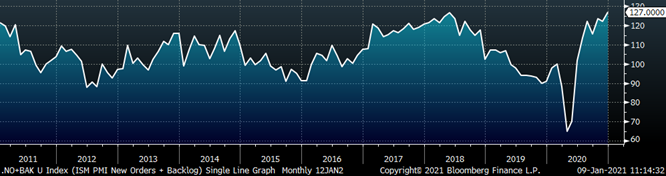
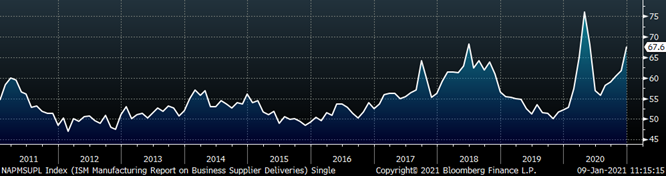
The most interesting subindex in the report is likely the prices subindex. The chart below compares the ISM prices subindex with the ISM customer inventories subindex. After the two appeared prime to converge, prices jumped 12.2 points MoM to their highest level since the 2018. The customer inventories subindex finally moved higher, after printing the past 4 months at the lowest levels of the decade. Even after the increase, these inventory levels are unsustainable and will likely drive prices higher, if current demand remains. The second chart shows the strength in both the new orders plus backlog subindexes. This reading is the highest over the last 10 years, and much like the previous high in 2018, it comes in an increasing price environment. The final chart shows the supplier delivery subindex increasing further. This current supply chain tightness is likely driven by a combination of the dynamics that occurred during the manufacturing strength of 2018 and the mandated shutdowns last spring.
PMI subindexes were mostly higher MoM, and significantly higher than last year’s levels. Employment moved into expansion after falling back into contraction territory last month. Exports and Imports remain strong, but dipped slightly compared to last month.
December global PMI printings were strong, with every watched country, excluding Russian and Mexico, in expansion (above 50) territory. Brazil, the U.S., Taiwan and Germany were the strongest of the group.
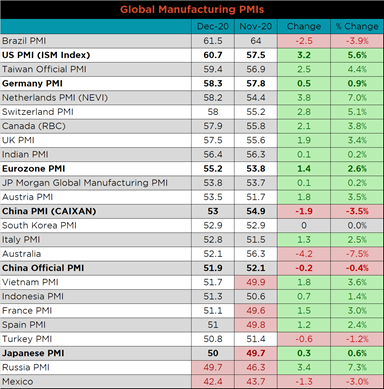
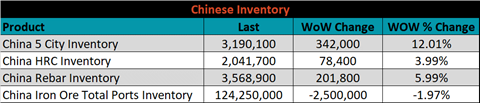
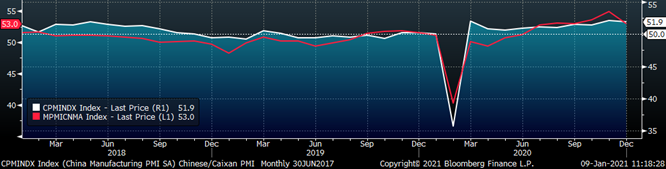
Both China’s official manufacturing PMI and the Caixan PMI decreased but remain in expansion.
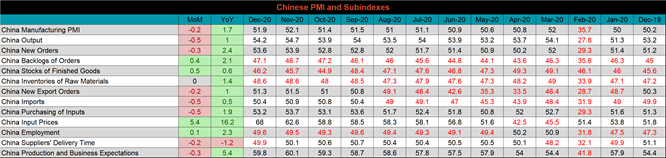
The table below breaks down China’s official manufacturing PMI subindexes, which was mixed MoM, but strong compared to December 2019. Input prices jumped dramatically, which could constraint a primarily exporting economy like China’s.
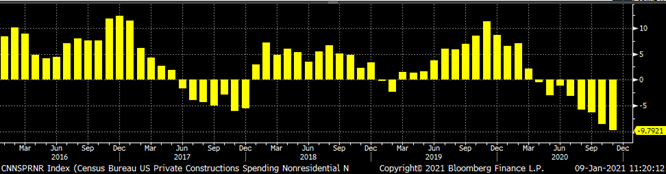
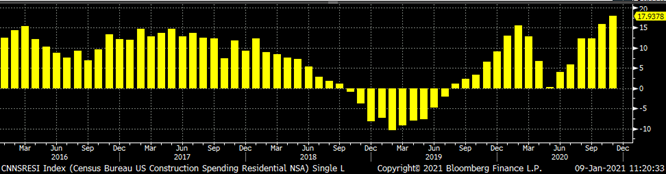
November seasonally adjusted U.S. construction spending was up 0.9% compared to October, and 3.8% higher than a year ago.
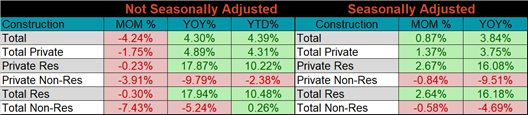
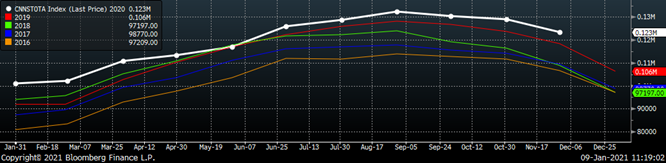
The white line in the chart below represents not seasonally adjusted construction spending in 2020 and compares it to the spending of the previous 4 years. Spending in November was down compared to October but remains above last year’s levels. The last two charts show the YoY changes in construction spending. Private non-residential spending decreased further in November, the eighth month in a row, while residential spending continues to show remarkable strength.
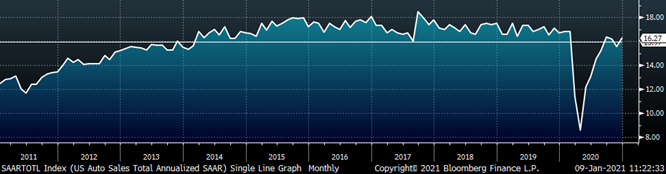
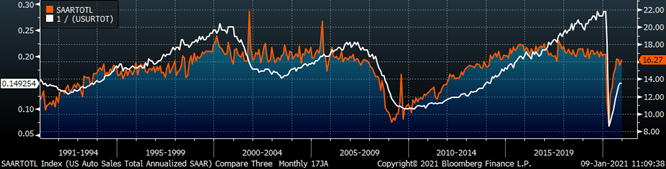
December U.S. light vehicle sales increased to a 16.3m seasonally adjusted annualized rate (S.A.A.R) and moved back above the 10yr average. The second chart shows the relationship between the unemployment rate and auto sales. The unemployment rate is inverted to show that declining unemployment typically leads to increasing auto sales. Both have lost momentum after an incredible initial recovery.
Below are the most pertinent upside and downside price risks:
Upside Risks:
Downside Risks:
The Platts TSI Daily Midwest HRC Index increased by $33.50 to $1042.75.
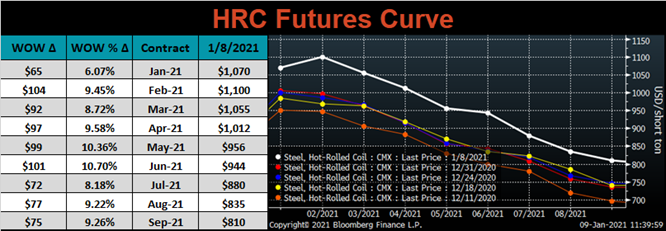
The CME Midwest HRC futures curve is below with last Friday’s settlements in white. Last week, the curve jumped dramatically across all expirations. It cannot be overstated how significant the increases were after two weeks of a slower “holiday market”.
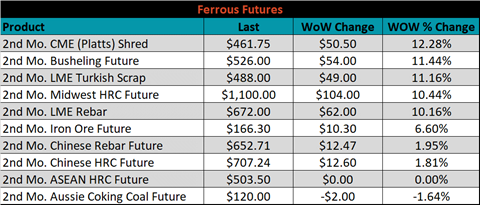
February ferrous futures were mostly higher, led by Platts shred, busheling and Turkish scrap, up 12.3%, 11.4% and 11.2%, respectively. Aussie coking coal was down 1.6%.
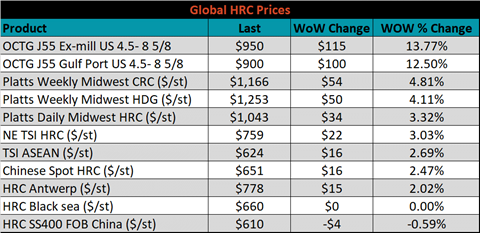
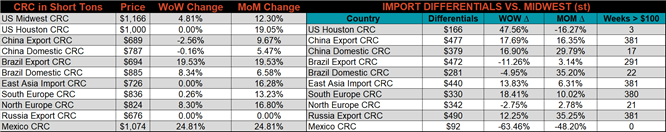
Global flat rolled indexes were mostly higher, led by Midwest CRC, up 4.8%, while the Chinese export price was down 0.6%. The monthly updated prices for tube came in significantly higher; ex-mill and Gulf port each up 13.8% and 12.5%, respectively.
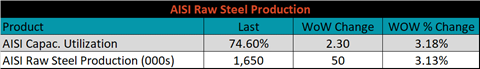
The AISI Capacity Utilization rate decreased 2.3% to 74.6%.
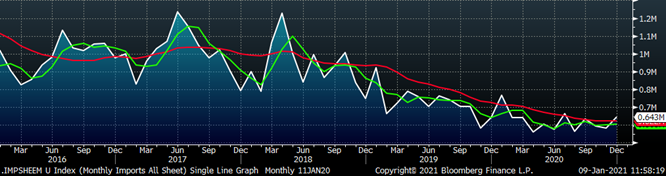
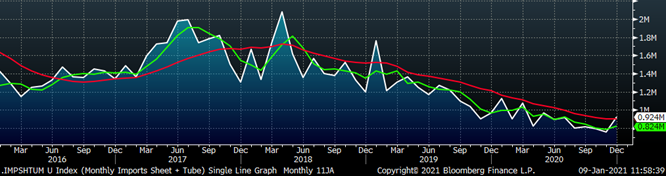
December flat rolled import license data is forecasting an increase of 62k to 634k MoM.
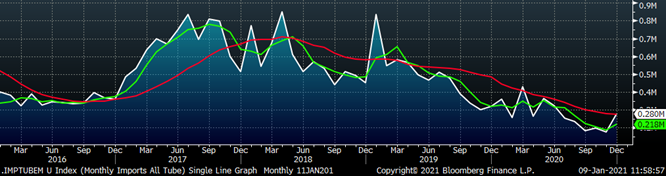
Tube imports license data is forecasting an increase of 105k to 280k in December.
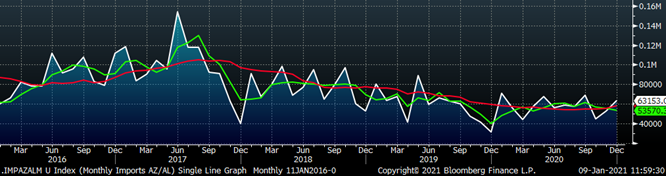
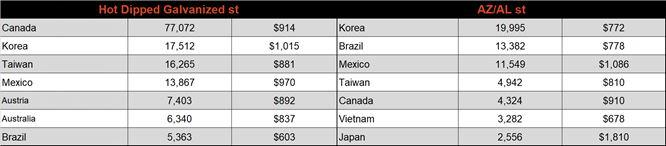
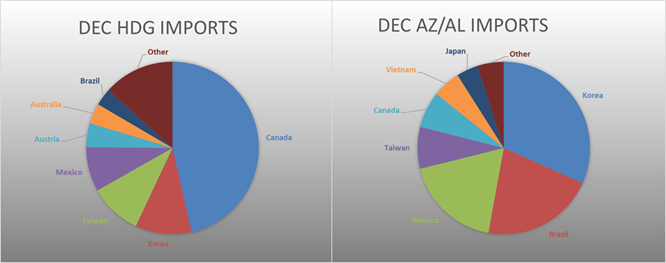
December AZ/AL import license data is forecasting a 10k increase to 63k.
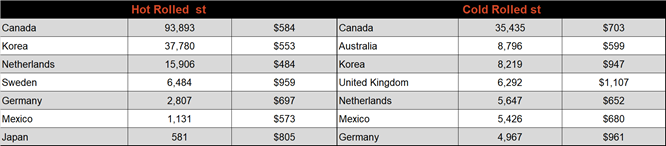
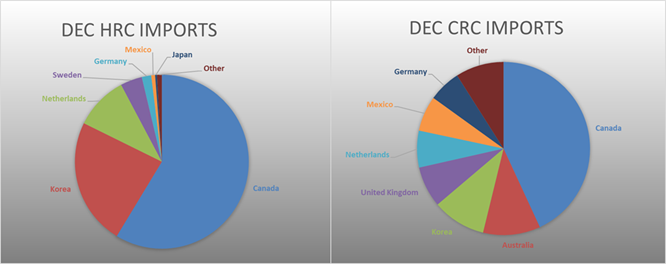
Below is December import license data through January 5, 2021.
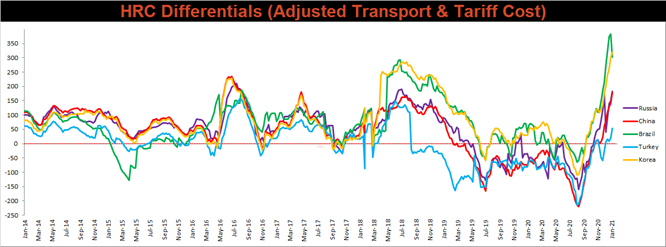
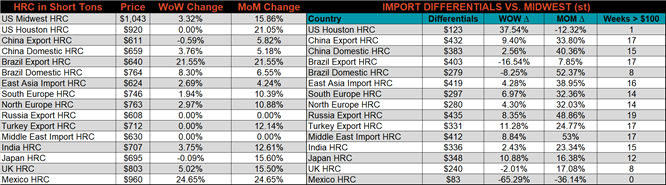
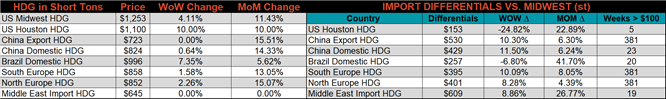
Below is the Midwest HRC price vs. each listed country’s export price using pricing from SBB Platts. We have adjusted each export price to include any tariff or transportation cost to get a comparable delivered price. All the watched differentials moved higher, with the exception of the Brazilian differential, which moved significantly lower.
SBB Platt’s HRC, CRC and HDG pricing is below. The Midwest CRC, HDG and HRC prices were up 4.8%, 4.1% and 3.3%, respectively. Globally, the Mexican domestic and Brazilian export HRC prices were up 24.7% and 21.6% respectively.
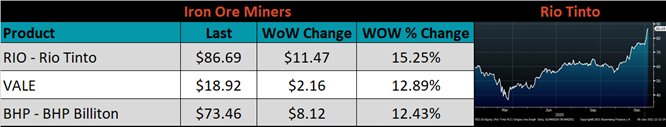
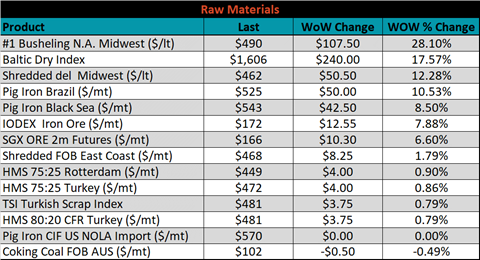
Raw material prices were mostly higher, led by Midwest busheling was up 28.1%, while Aussie coking goal was down 0.5%.
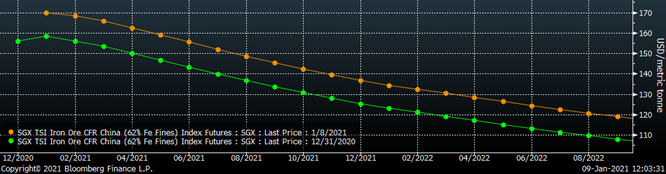
Below is the iron ore future curve with Friday’s settlements in orange, and the prior week’s settlements in green. Last week, the curve shifted higherer across all expirations.
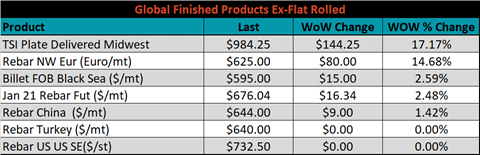
The ex-flat rolled prices are listed below.

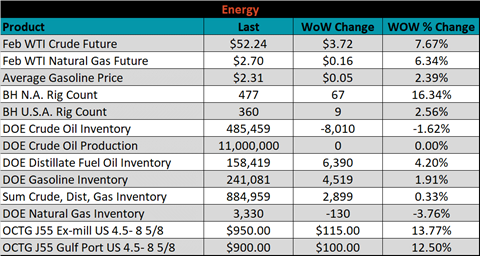
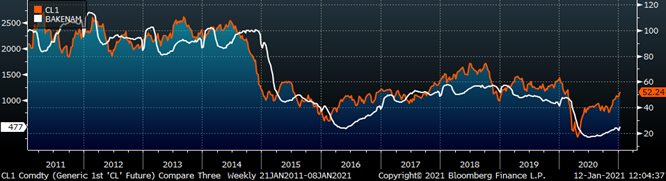
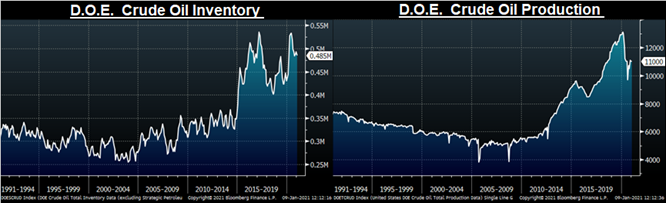
Last week, the February WTI crude oil future gained another $3.72 or 7.7% to $52.24/bbl, based primarily on announced production cuts by Saudi Arabia. The aggregate inventory level was up 0.3% and crude oil production remains at 11m bbl/day. The Baker Hughes North American rig count jumped by 67 rigs, and the U.S. rig count was up 9 rigs.
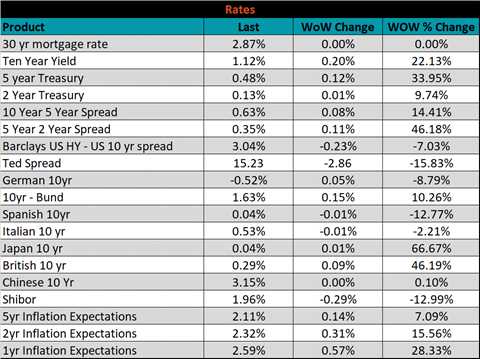
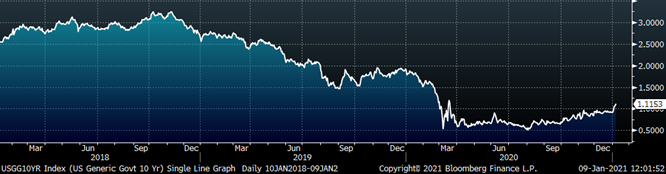
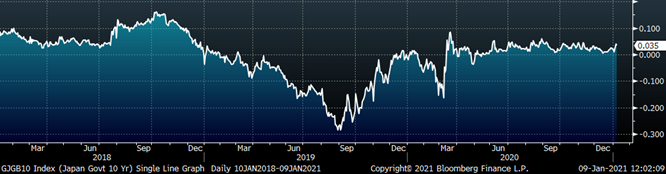
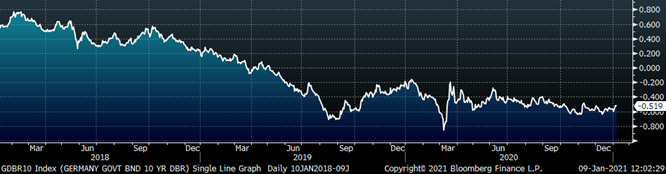
The U.S. 10-year yield was up 20 bps, closing the week at 1.12%, and over the 1% level for the first time since March 2020. At historically low levels, increasing rates is an encouraging barometer for economic growth as capital moves away from the safe haven government bonds. It is also an indication of likely increases government spending, possibly on infrastructure, which is beneficial to steel demand. The German 10-year yield was up 5 bps to minus 0.52% and the Japanese 10-year yield was up 1bps to 0.04%.
The list below details some upside and downside risks relevant to the steel industry. The orange ones are occurring or look to be highly likely. The upside risks look to be in control.
Upside Risks:
Downside Risks: