Content
-
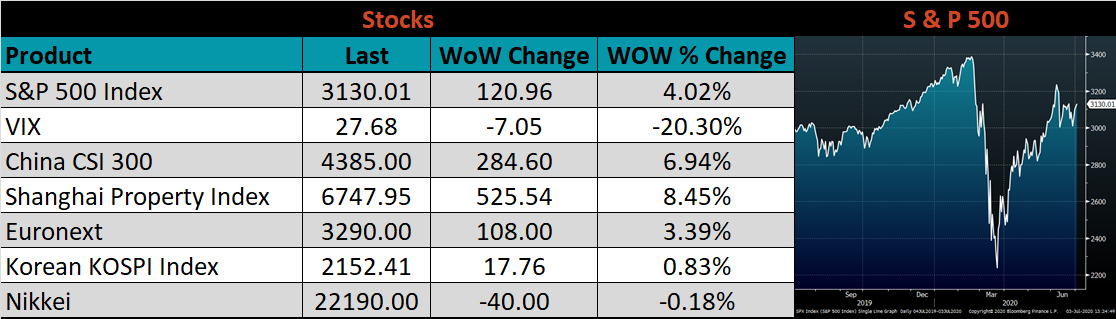
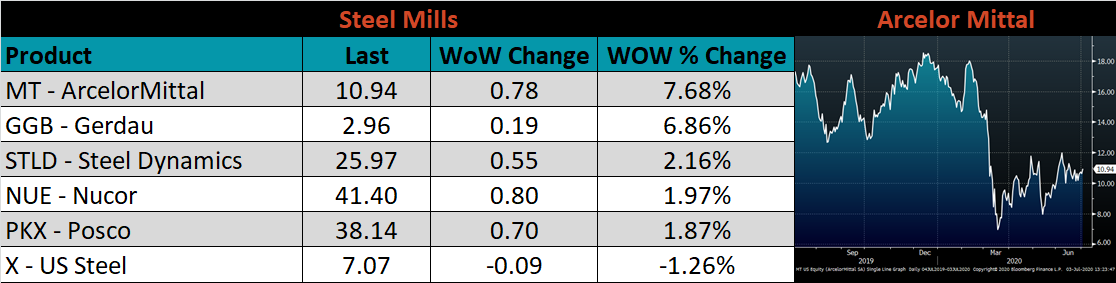
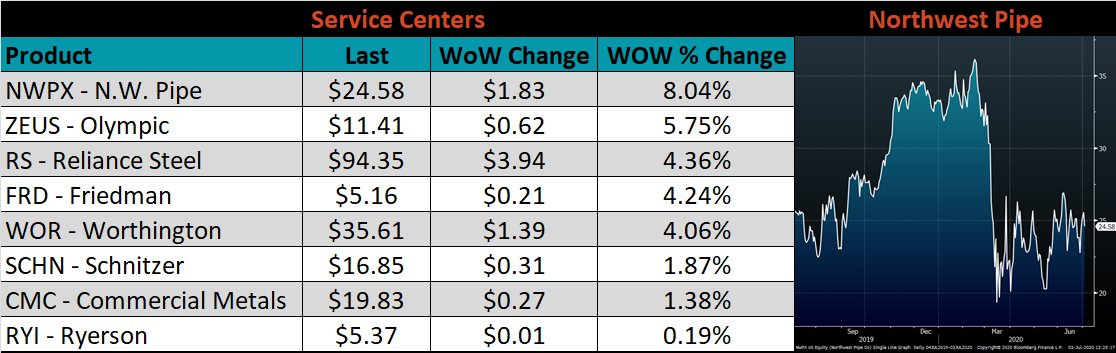
Weekly Highlights
- Market Commentary
- ISM PMI
- Global PMI
- Construction Spending
- Auto Sales
- Risks


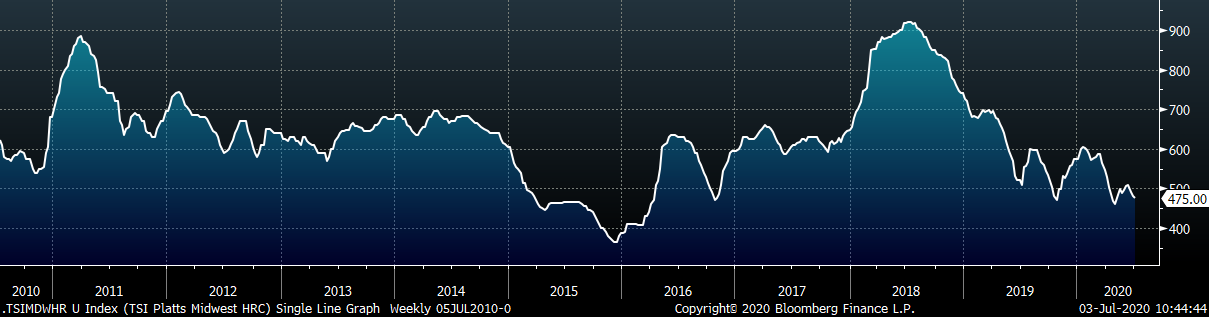
Over the past two weeks, HRC spot price indexes continued to drift lower, falling about $10/st each week, to $475. Lead times remain depressed, and looking into July, the market consensus is for prices to continue to drift lower. The scrap market, which tends to be a leading indicator for the direction of finished product pricing, is expected to fall significantly from its June high. While the initial expectation was for #1 busheling to fall $20-$30, the mills’ scrap buys this week are pointing to a larger decline. Currently, EAF profitability on the marginal ton produced is tight, and in the face of declining HRC prices, significantly lower scrap prices are needed to make additional production viable.
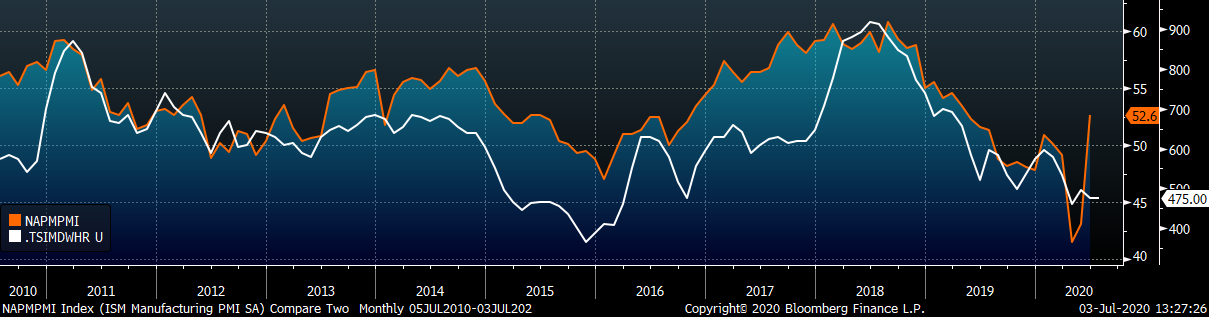
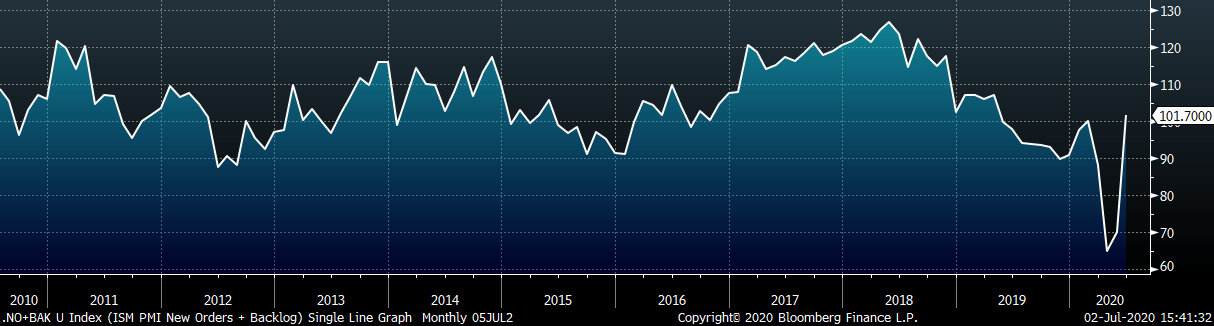
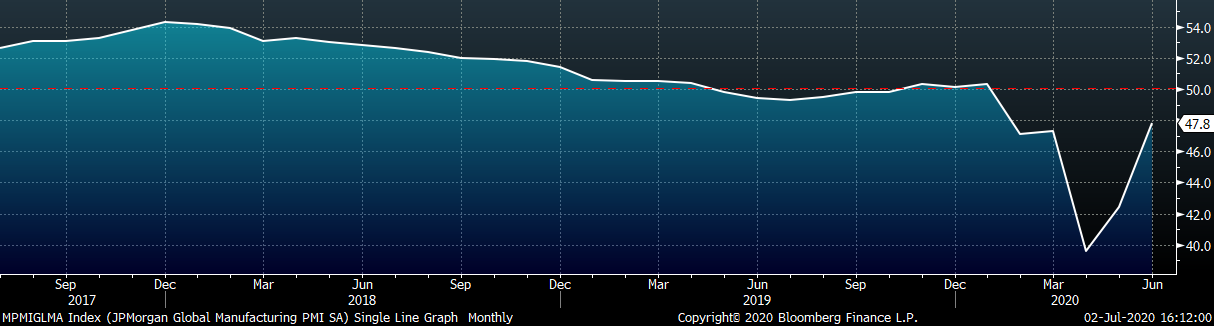
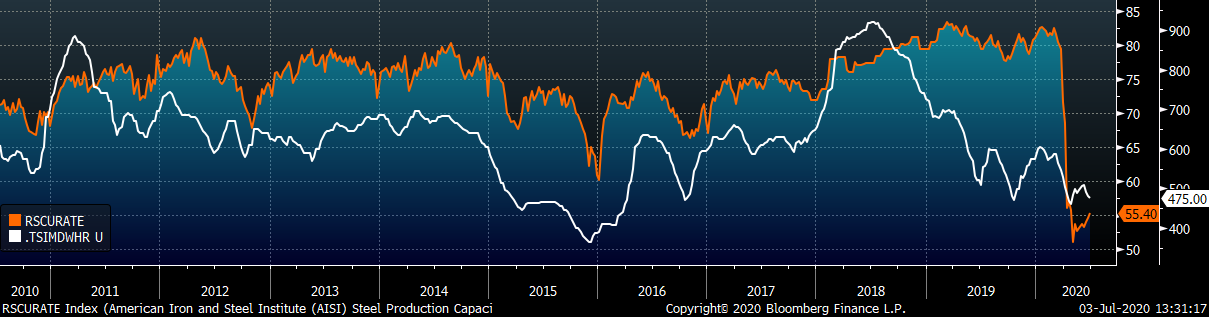
Despite this gloomy ferrous pricing outlook, recently there have been several positive economic indicators. Many are discussed in detail throughout this week’s report, but here is a summary of the headlines: Strong June auto sales, 4.8 million jobs added in June, positive revisions to historical construction spending, increasing global PMIs and the US ISM Manufacturing PMI moving up into expansion in June. Regarding PMI readings, the index is a measure of current sentiment and future expectations compared to the previous month, so significant growth in these readings was expected as the economy opened up in June. Historically, spot HRC prices track closely to the ISM Manufacturing PMI, so the recent increase is encouraging for the immediate price outlook. The below chart shows this relationship back to 2010.
With all of these positive developments coming out of the economy, how is it that spot HRC prices have drifted lower and are expected to decline further? At the end of the day, the price is determined by market specific supply and demand. Demand in the steel sector, as well as the economy at large, remains below pre-crisis levels. Many businesses have scrapped or delayed capital expenditures for long-term projects due to the continued uncertainty. As long as health threats from the coronavirus persist, the economic recovery will be at risk. Automotive factories have restarted in a limited capacity, but their steel demand has lagged as supply chains were forced to hold high inventory levels during the shutdown. While oil prices have recovered significantly from their spring lows, they are still only hovering near $40, which has yet to spur a recovery in rig counts or steel intensive projects. On top of this depressed demand picture, mills are planning to add supply to the market over the next several months. US Steel is planning to restart their Gary #6 blast furnace in early July, and there are rumors that several more restarts are likely later in the month. If the current demand levels persist, this will lead to an oversupplied market and drive the price even lower.
While we believe there is further downside risk to the price, and that the forward curve is overvalued, we continue to monitor indicators for prices to reverse. Specifically, we are closely watching mill lead times, service center inventory levels, and future scrap prices. Generally, prices rise much faster than they fall, and there should be good opportunities for steel buyers to lock in spot material or futures at historically low prices.
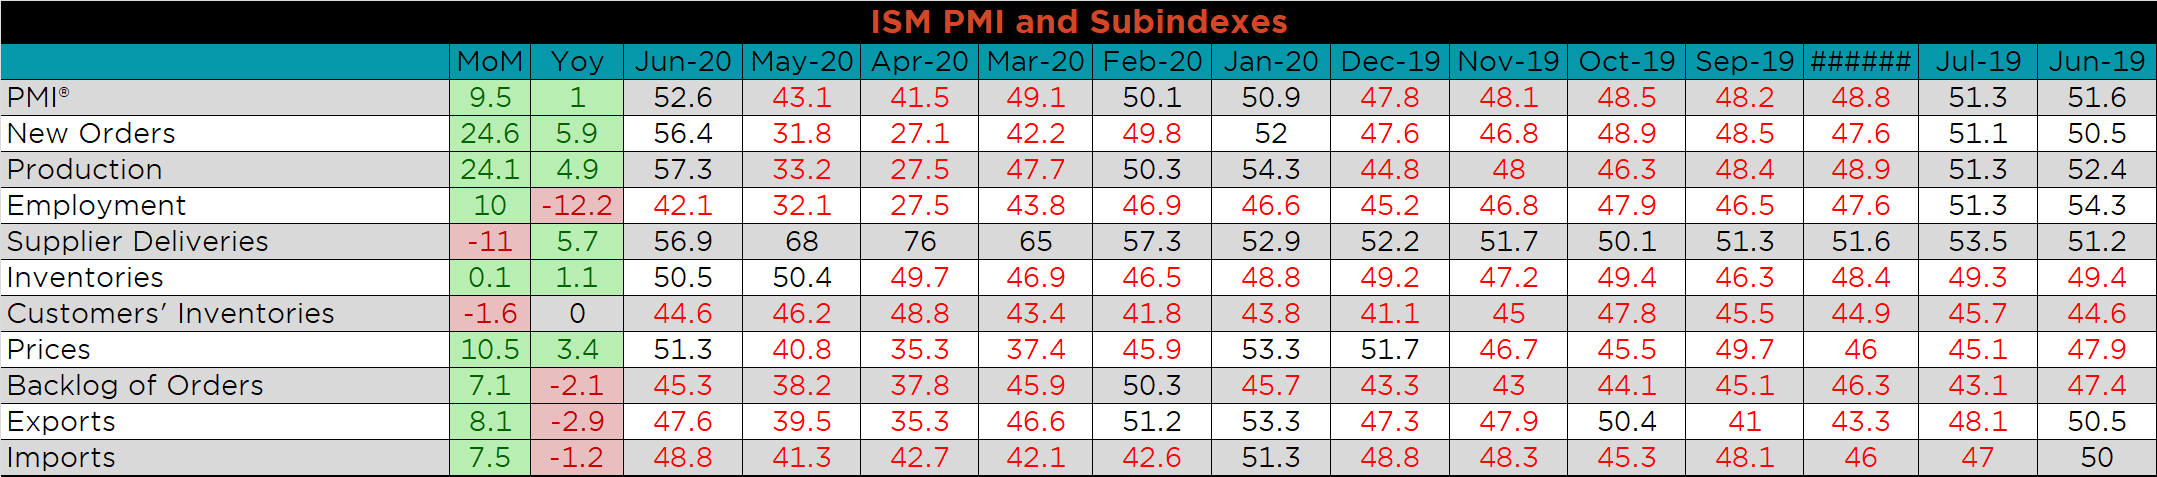
The June ISM Manufacturing PMI and subindexes are below. The topline PMI number surprisingly jumped 9.5 points to 52.6, well into expansion.
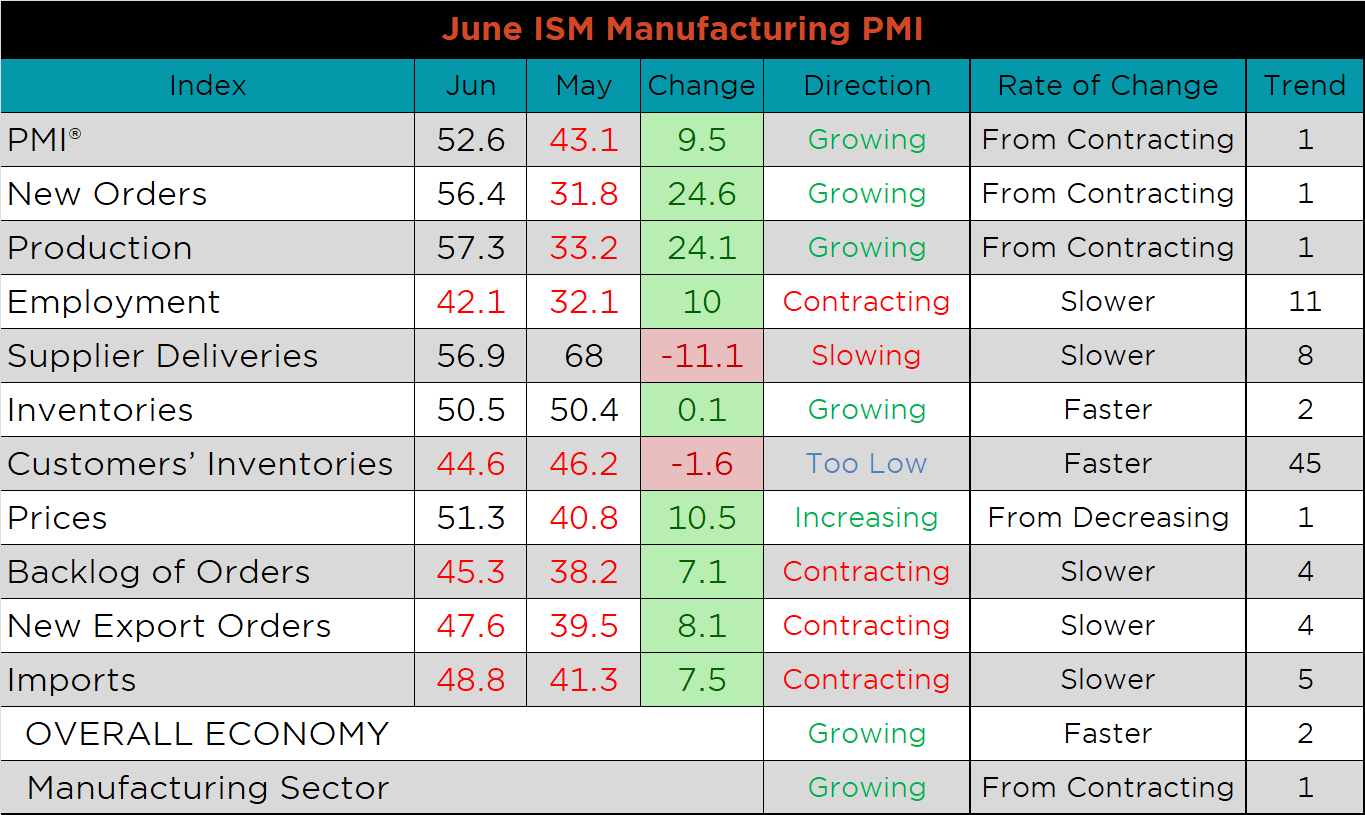
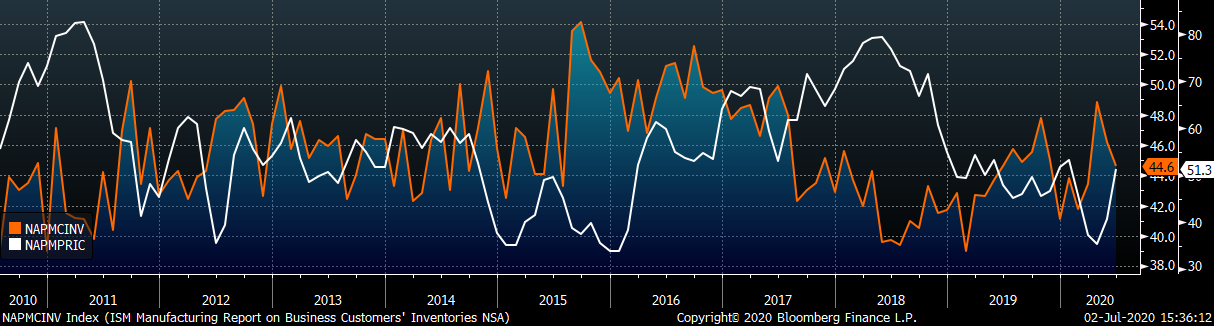
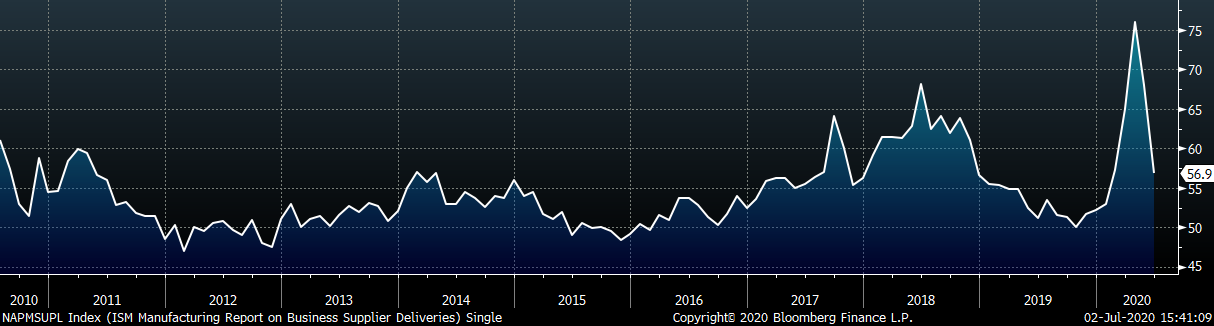
As the U.S. economy continued to open up, the PMI report indicated the manufacturing sector starting to recover. The chart below compares the ISM prices subindex with the ISM customer inventories subindex. The two subindexes converged this month, suggesting enough demand to sell through some of the stockpile and support higher prices. The second chart shows the new orders plus backlog sub-indexes jumping significantly higher – primarily driven by the 24.6-point increase in new orders. While the backlog subindex increased 7.1 points, it remains in contraction. The backlog subindex moving into expansion will be a sign that longer-term confidence has returned. The last chart shows the supplier deliveries subindex falling, indicating shipping availability is more in line with the historical average.
This month, most subindexes were higher MoM, with the exception of supplier deliveries, and customer inventories. New orders and production, which were among the lowest readings of the last two months, increased the most, 24.6 and 24.1-points, respectively. Even after a promising increase, the employment subindex is the lowest subindex this month, and 12.2 points below June of 2019.
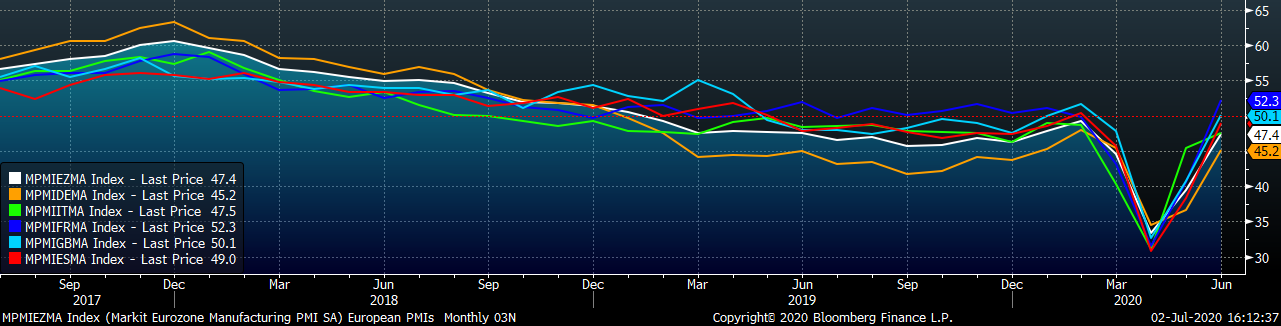
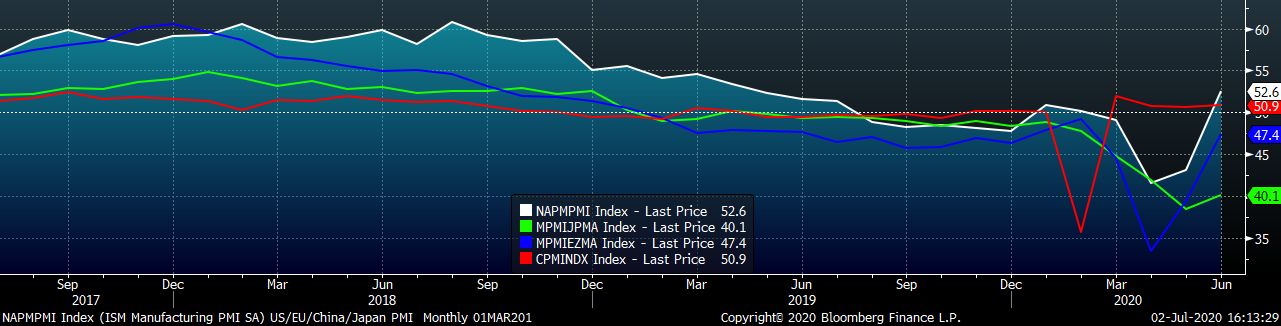
June’s global PMI printings show increases MoM for every country except Switzerland, which was down 0.2 points. The U.S. moved firmly into expansion, while Japan, Germany and the Eurozone all remain in contraction.
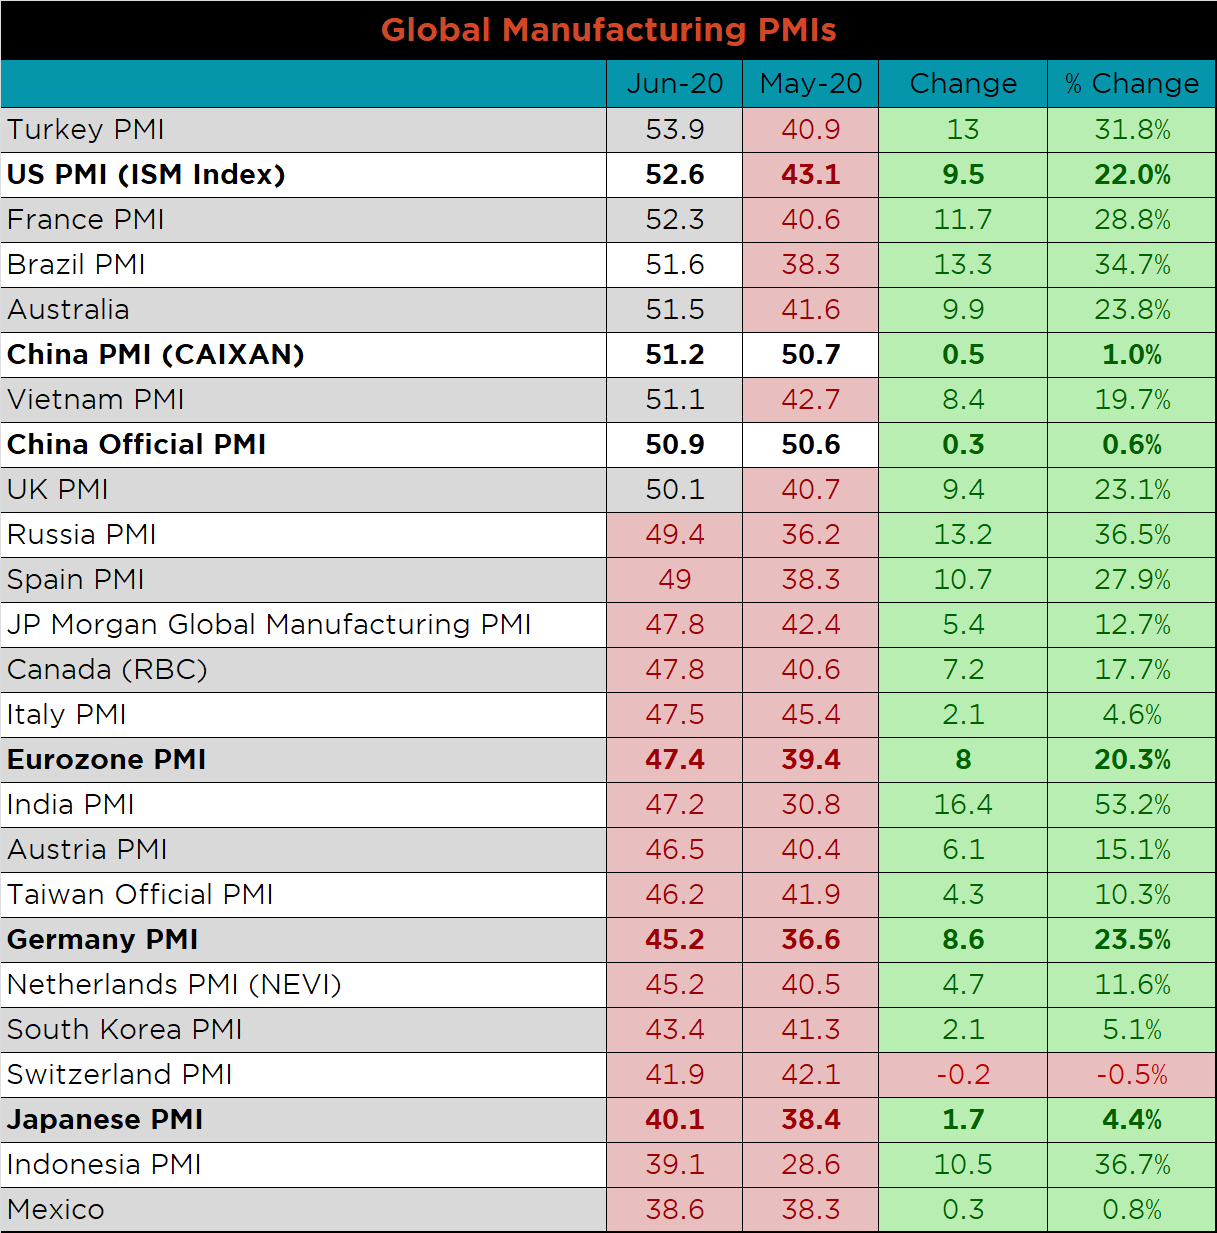
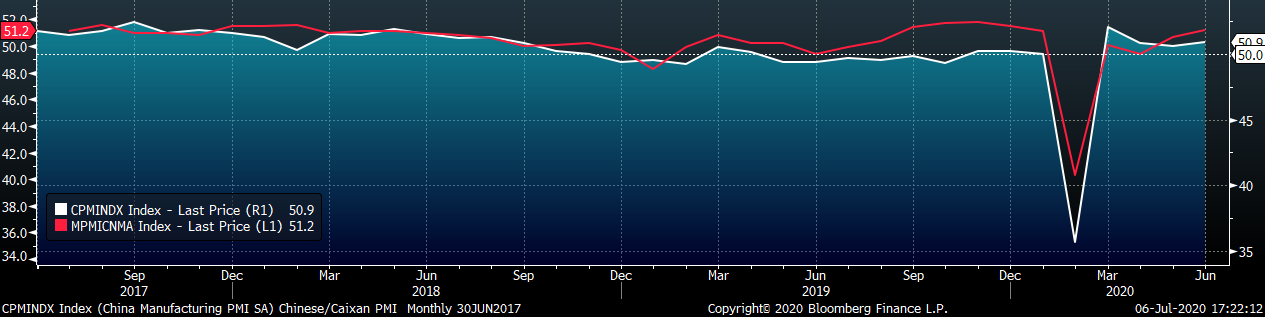
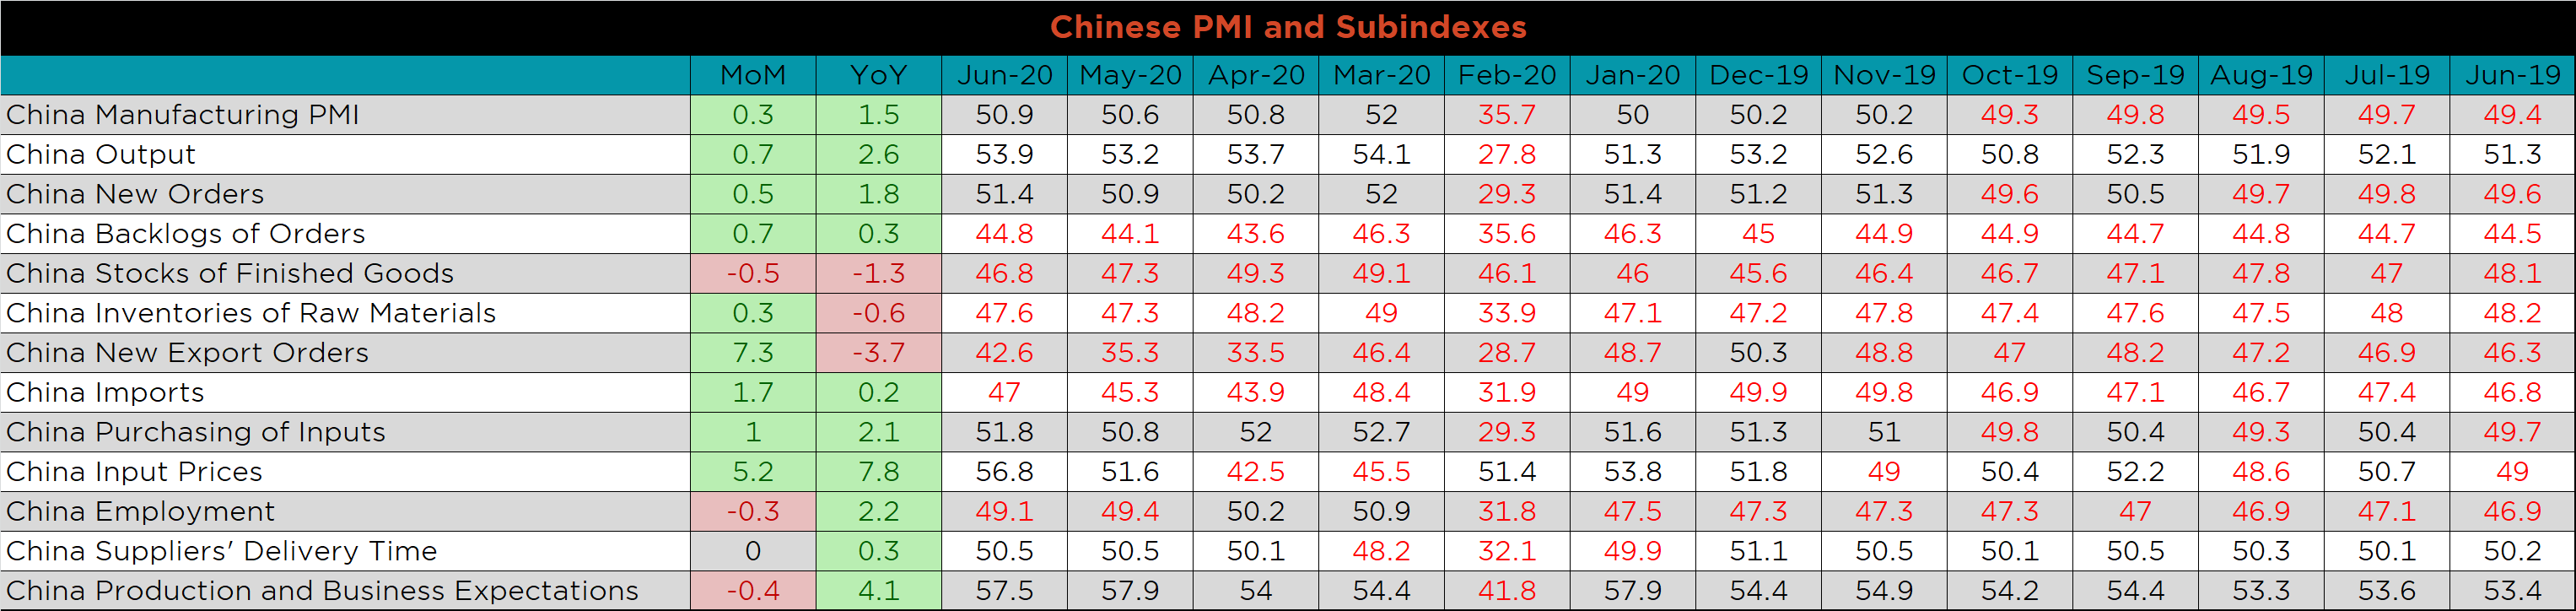
Both China’s official and the Caixan Manufacturing PMI printed higher and further into expansion.
The table below breaks down China’s official manufacturing PMI subindexes. Compared to last month, export orders are up the most, but remain below levels from June of last year.
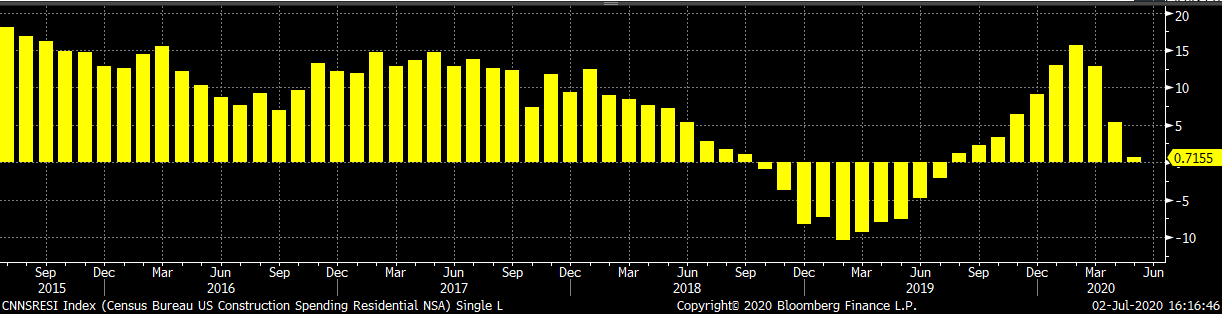
May seasonally adjusted U.S. construction spending was down another 2.1% compared to April, while 0.3% higher than last May. Interestingly, after two months of lackluster spending growth, not-seasonally adjusted YTD figures remain positive.
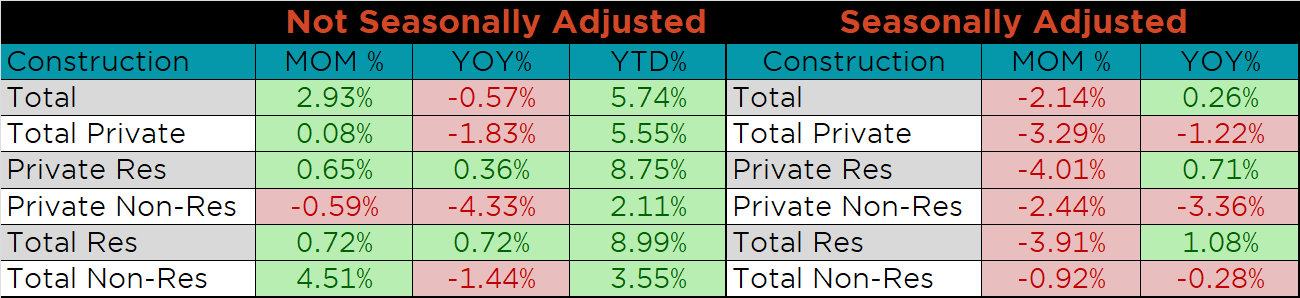
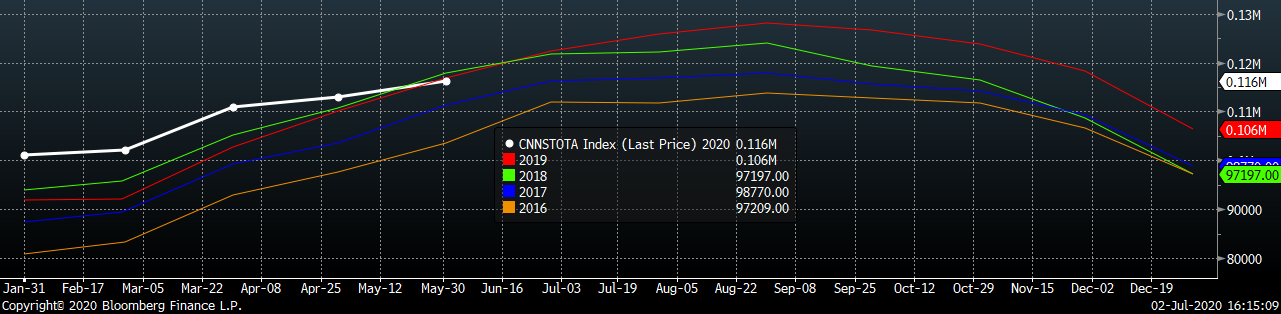
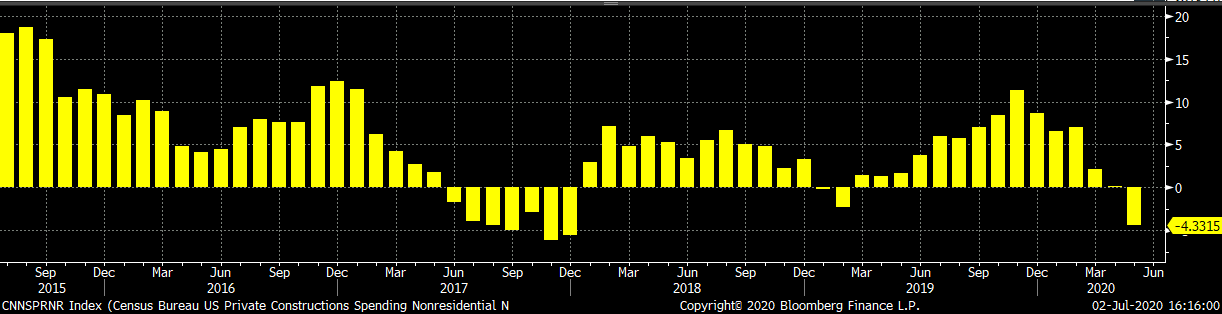
The white line in the chart below represents construction spending in 2020 and compares it to the spending of the previous 4 years. Overall spending levels in May moved just below last year’s level for the first time after 11 months of YoY spending growth. The last two charts show the YoY changes in construction spending. After a significant revision higher in previous years, May’s private non-residential spending decreased for the first time since February of last year. Residential spending continues to increase on a YoY basis, but at a much slower rate than recent months.
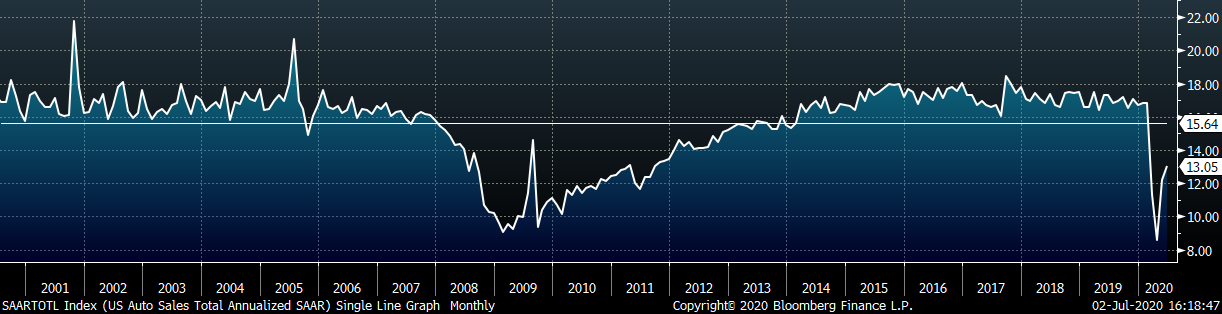
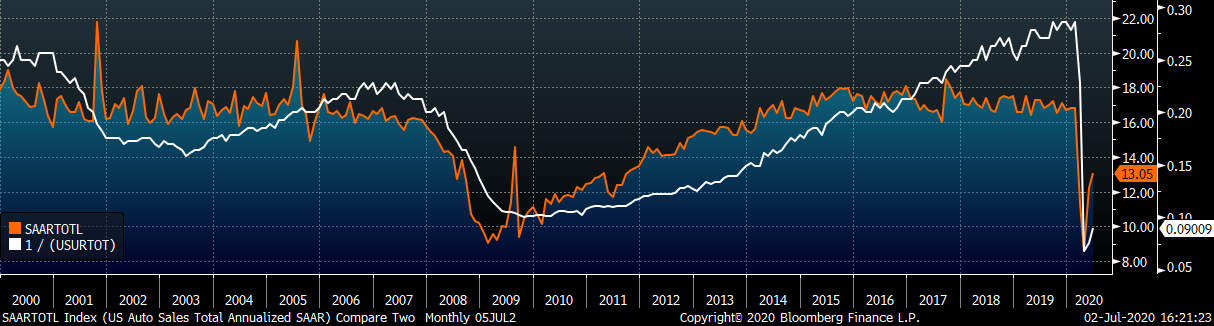
June U.S. light vehicle sales increased further to a 13.1m seasonally adjusted annualized rate (S.A.A.R), but remain below their 20-year average. The second chart shows the relationship between the unemployment rate and auto sales. The unemployment rate is inverted to show that declining unemployment typically leads to increasing auto sales. Auto sales continue to increase and the unemployment rate decreased further in June.
Below are the most pertinent upside and downside price risks:
Upside Risks:
Downside Risks:
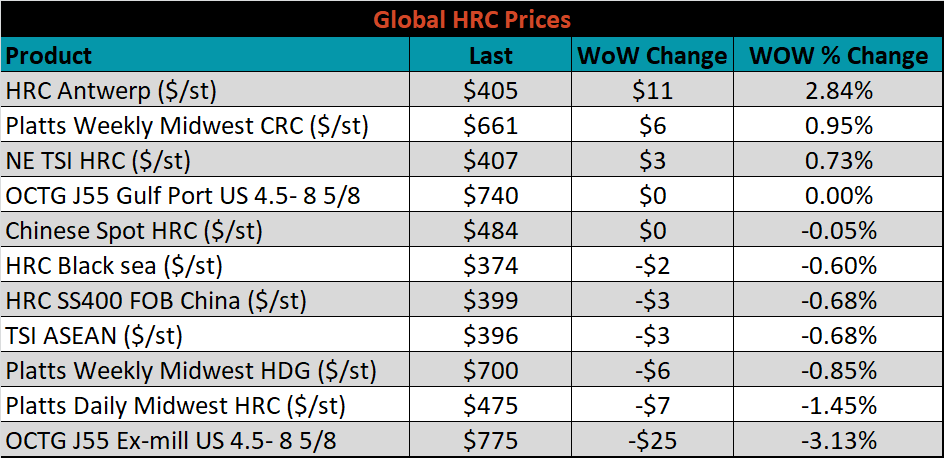
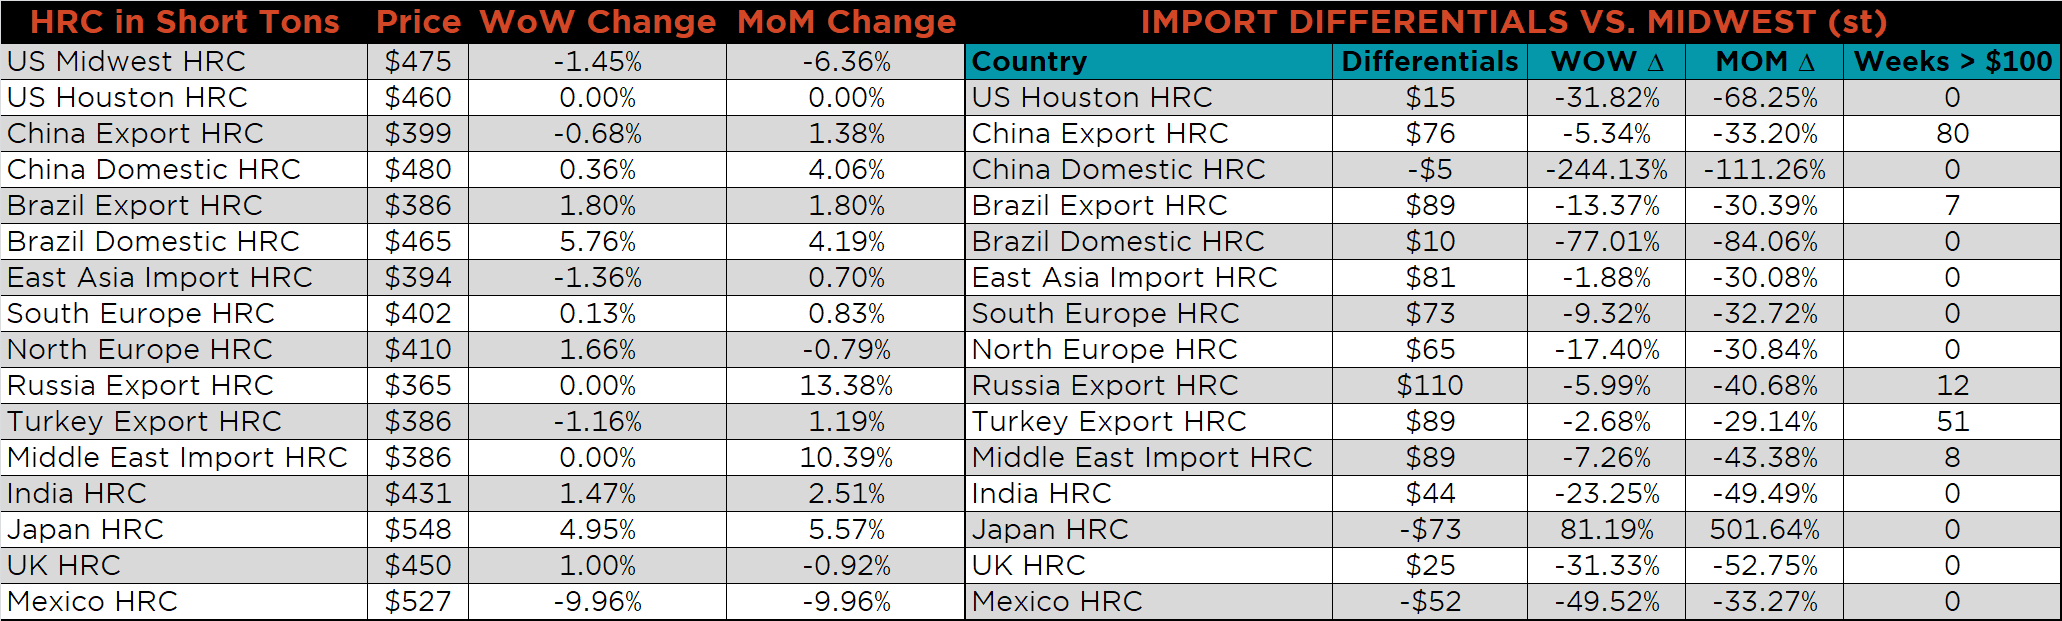
The Platts TSI Daily Midwest HRC Index was down $7 to $475.
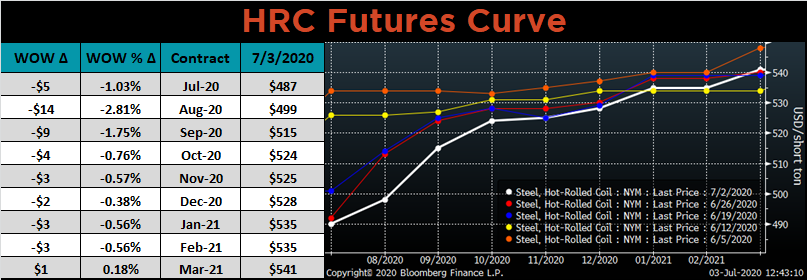
The CME Midwest HRC futures curve is below with last Friday’s settlements in white. Last week the front of the curve moved lower, while the rest of the curve showed very little change.
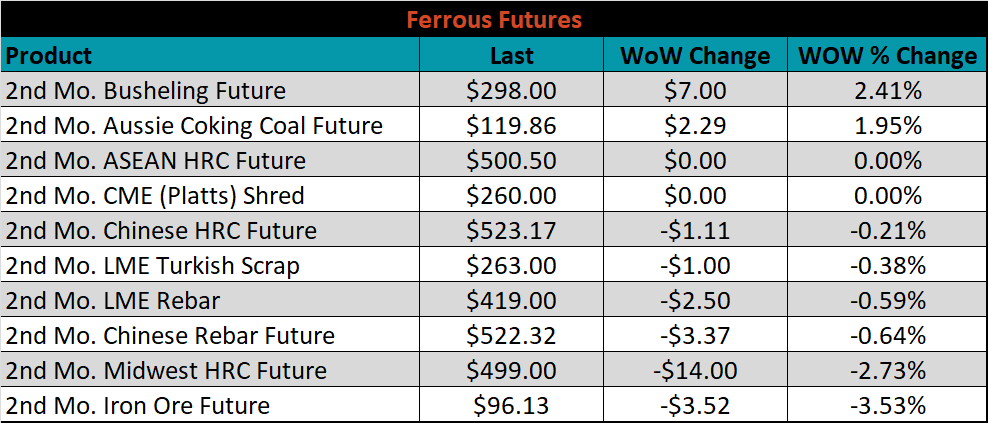
August ferrous futures were mixed. The busheling future gained 2.4%, while the iron ore future lost another 3.5%.
The global flat rolled indexes were mixed. Antwerp HRC was up another 2.8%, while TSI Platts Midwest HRC was down another 1.5%. Additionally, the OCTG J55 (steel tubing) price, which updates monthly, was down 3.1%.
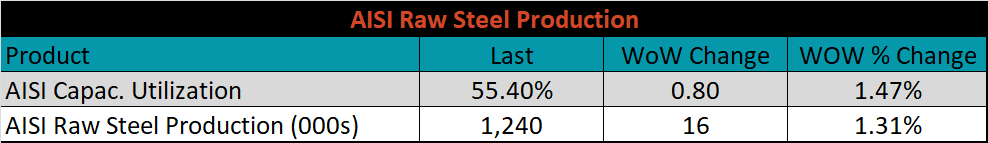
The AISI Capacity Utilization Rate was up another 0.8% to 55.4%.
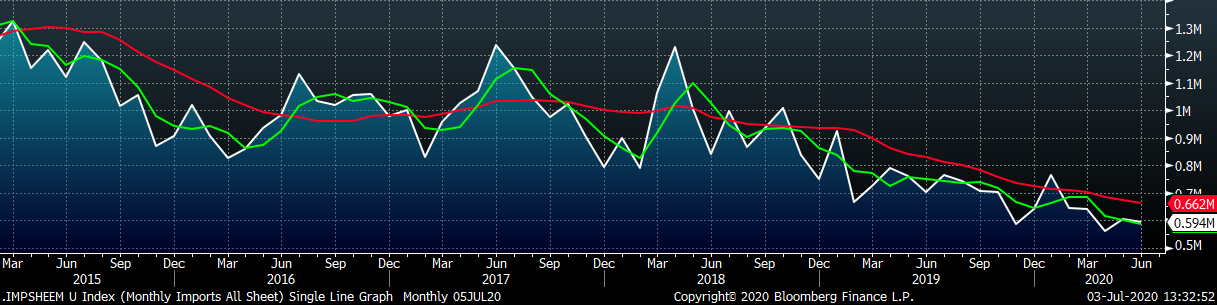
June flat rolled import license data is forecasting a decrease of 10k to 594k MoM.
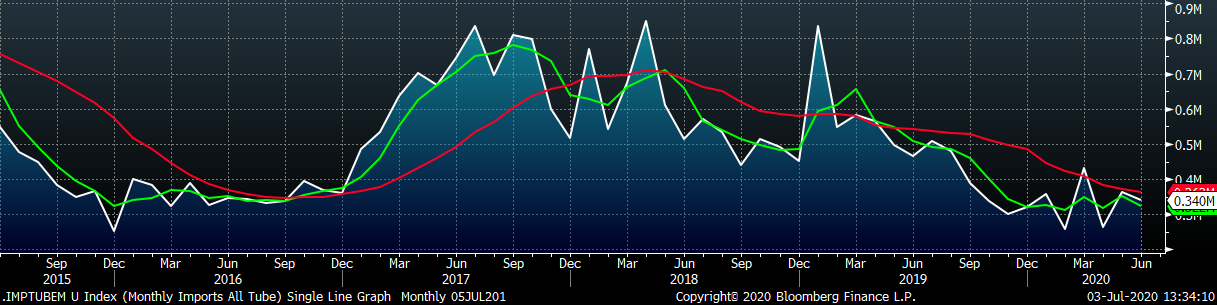
Tube imports license data is forecasting a MoM decrease of 24k to 340k tons in June.
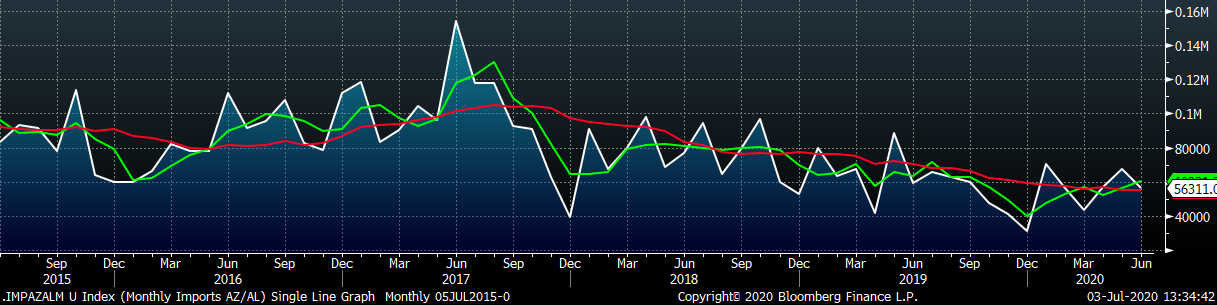
AZ/AL import license data is forecasting a decrease of 11k to 56k MoM.
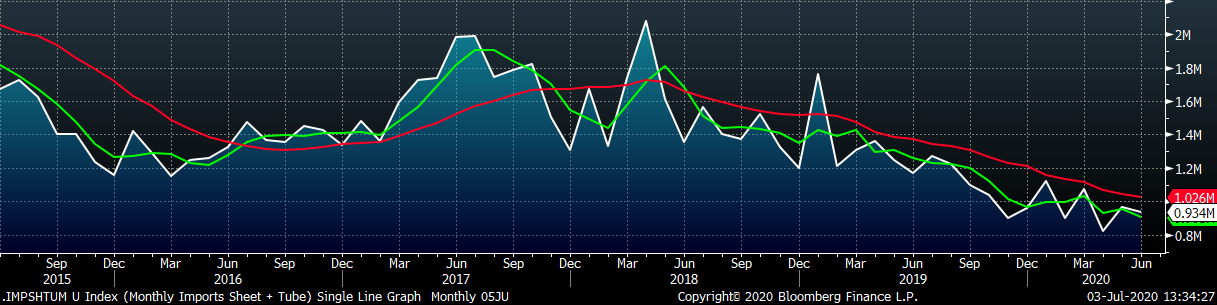
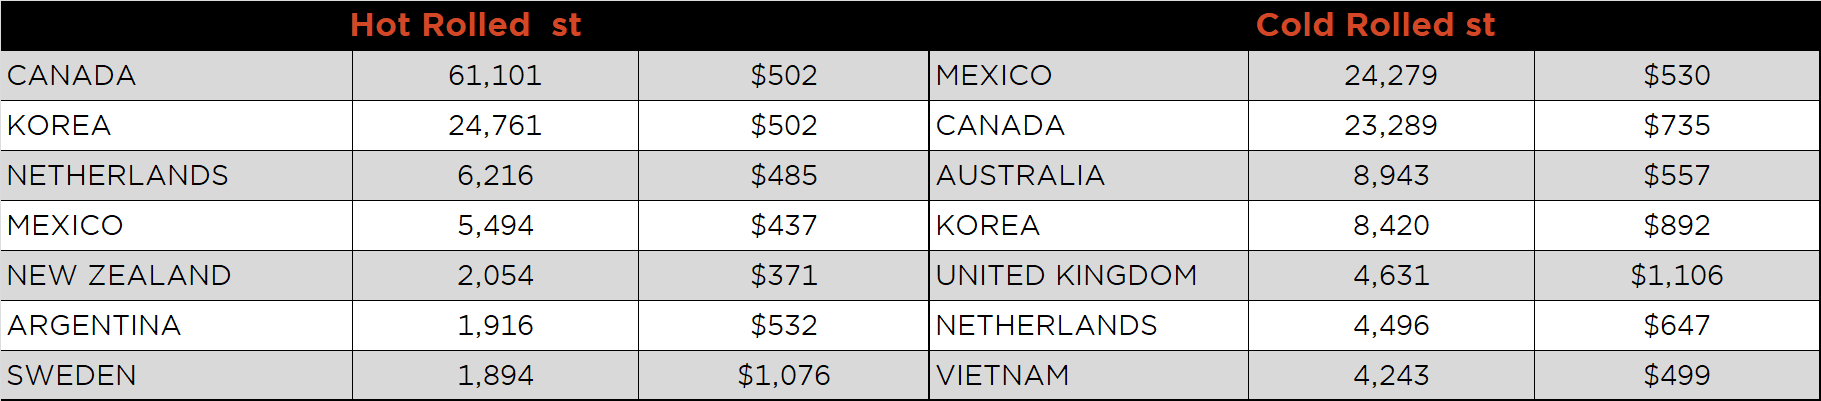
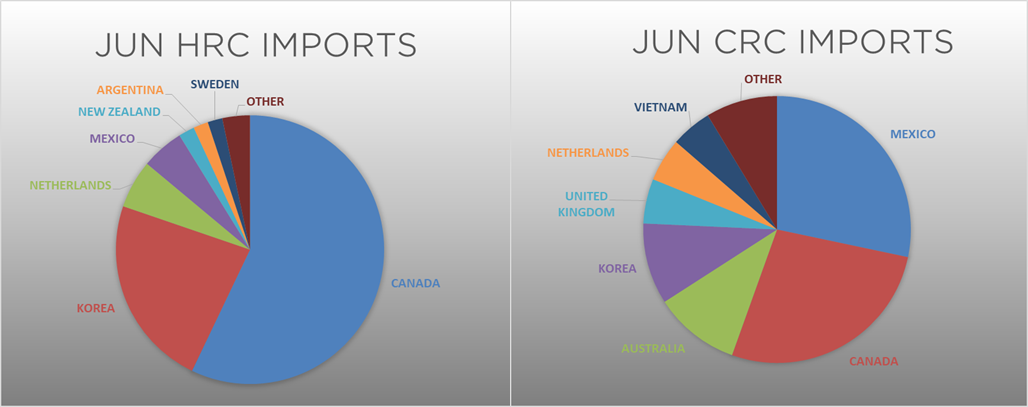
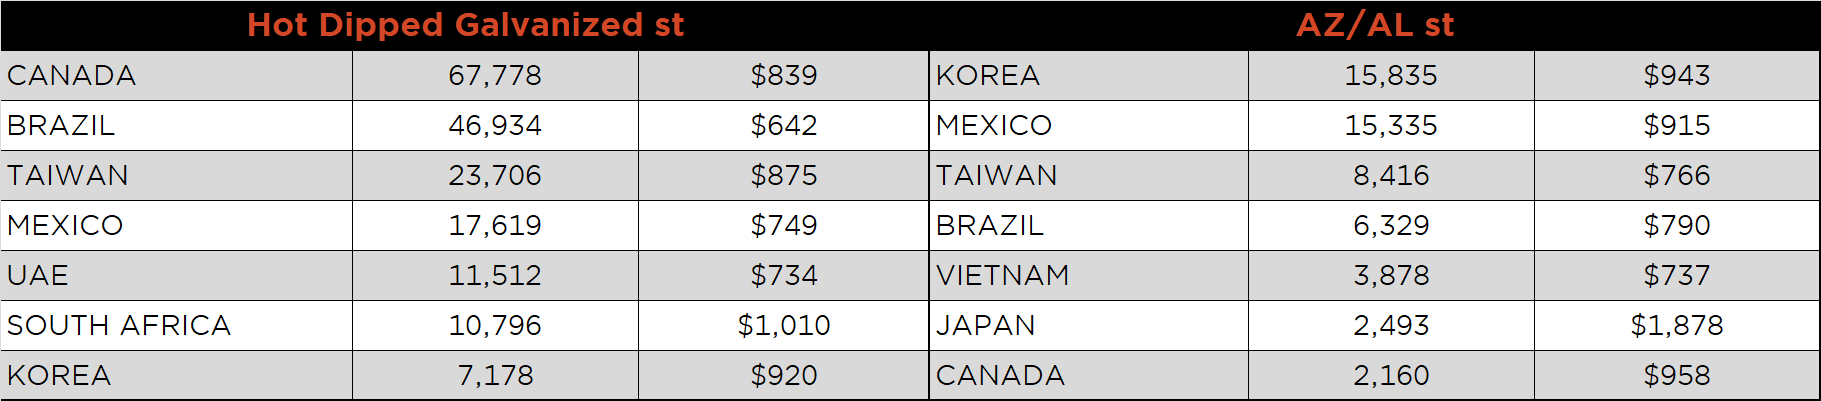
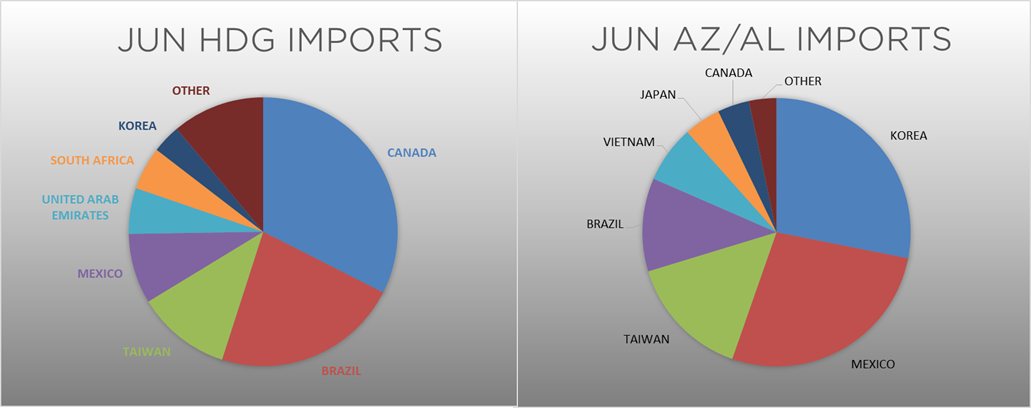
Below is May import license data through June 30, 2020.
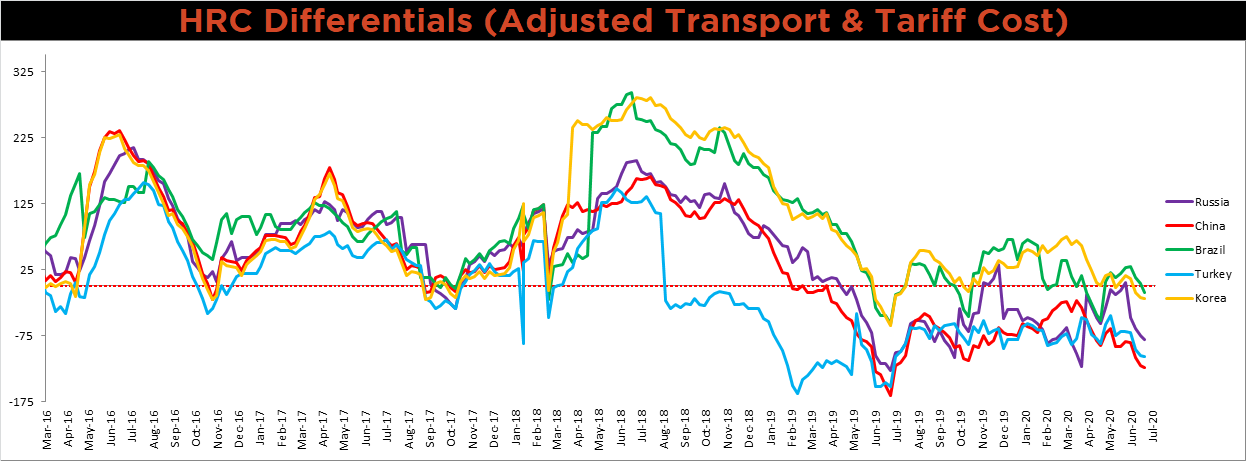
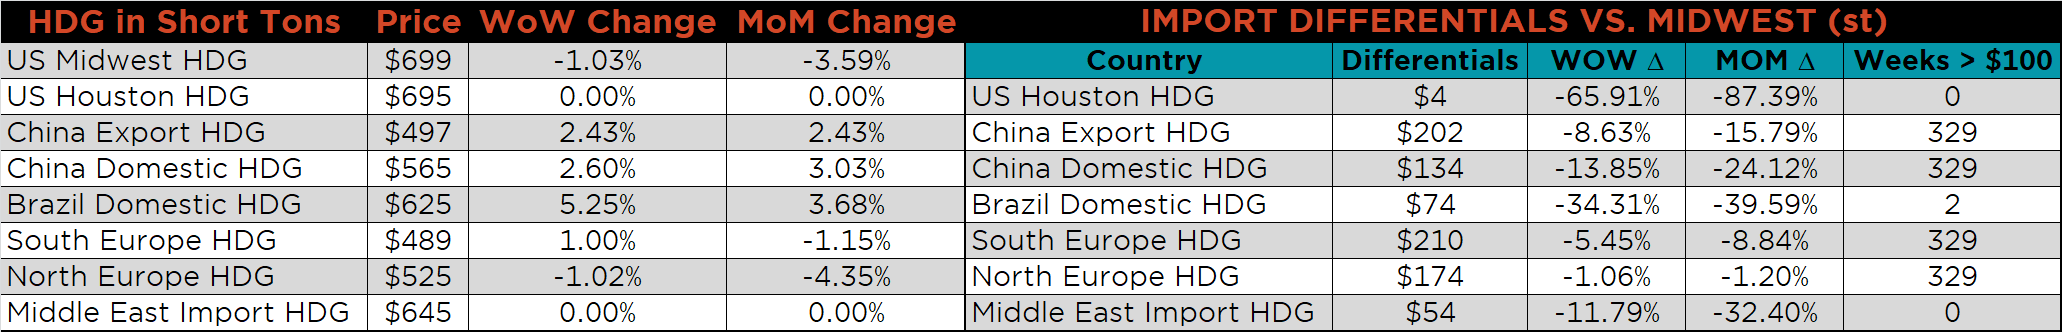
Below is the Midwest HRC price vs. each listed country’s export price using pricing from SBB Platts. We have adjusted each export price to include any tariff or transportation cost to get a comparable delivered price. All the global differentials decreased, as the U.S. price continues to fall more than the five watched countries.
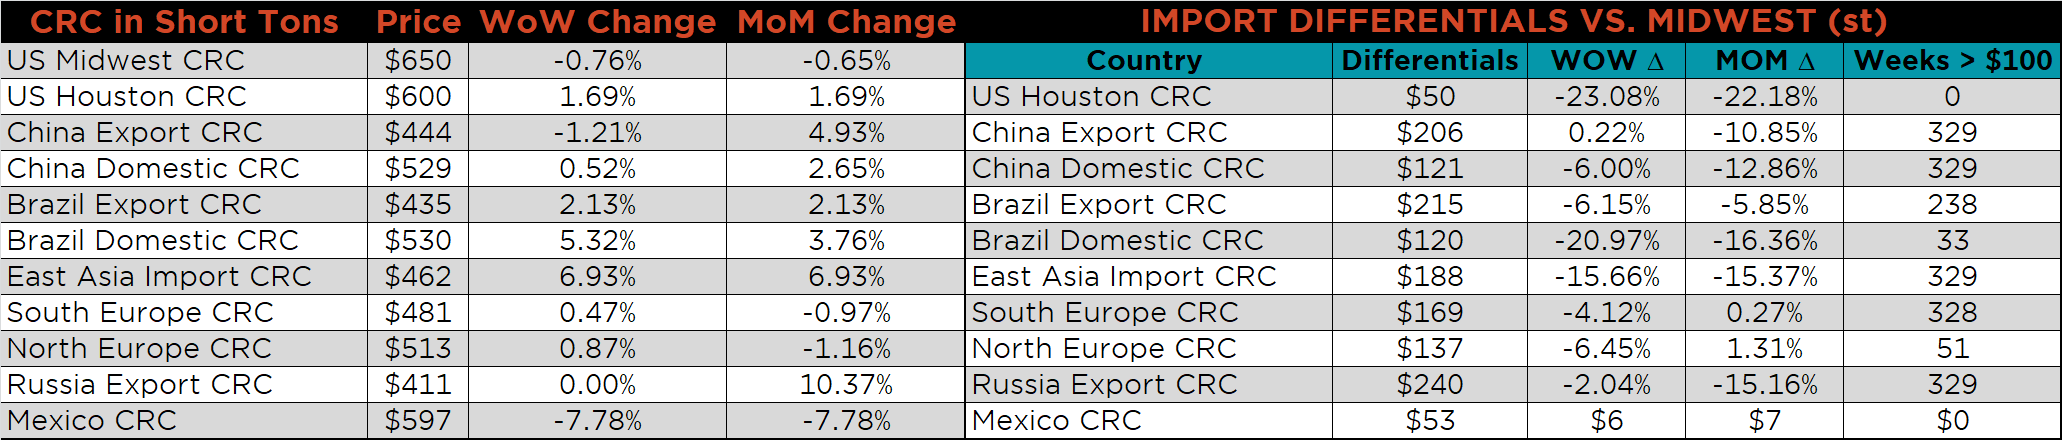
SBB Platt’s HRC, CRC and HDG pricing is below. The Midwest HRC, HDG and CRC prices were down 1.45%, 1% and 0.8%, respectively. Globally, the Turkish export HRC was down, 1.2%.
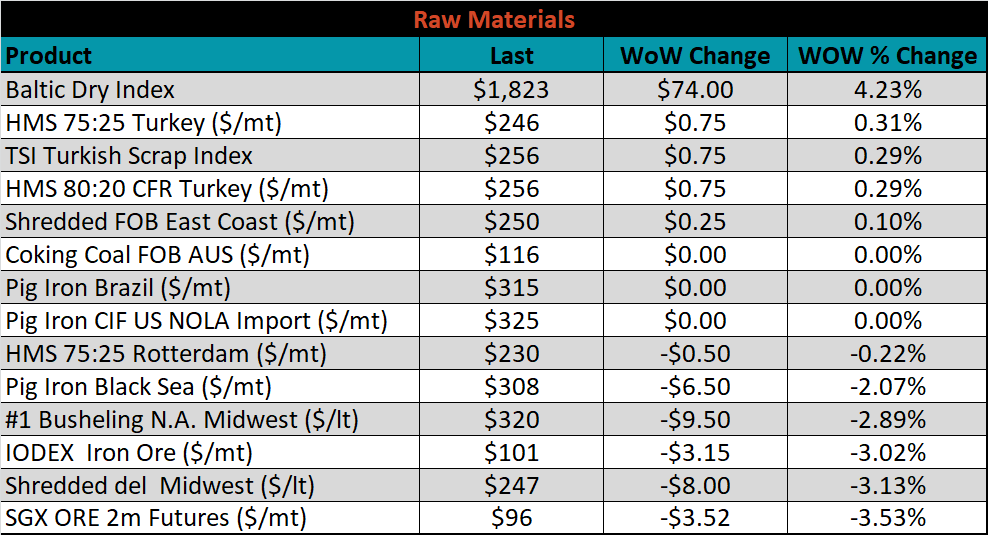
Raw material prices were flat to mixed. The iron ore futures and Midwest shredded were down 3.5% and 3.1%, respectively, while Turkey HMS 75:25 was up 0.3%.
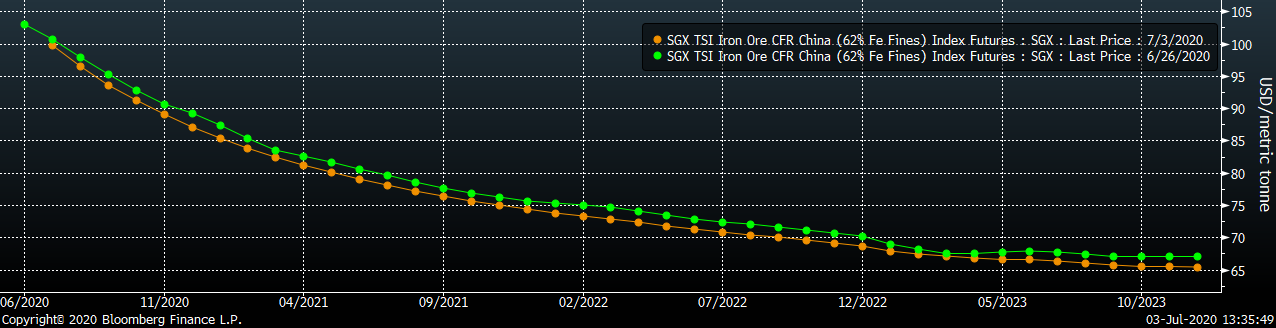
Below is the iron ore future curve with Friday’s settlements in orange, and the prior week’s settlements in green. The entire curve moved slightly lower over all expirations.
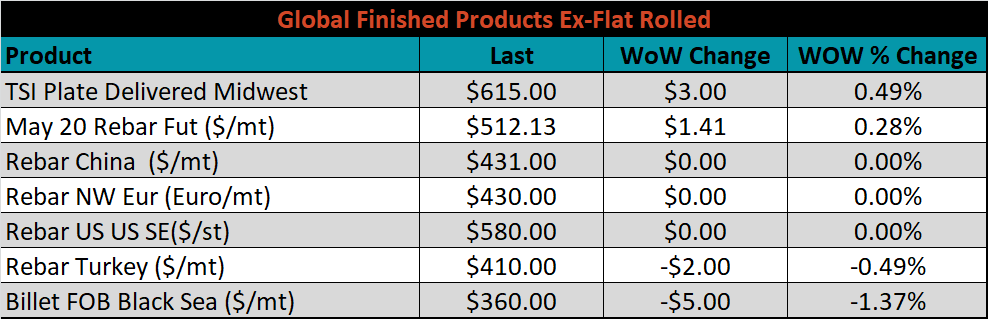
The ex-flat rolled prices are listed below.

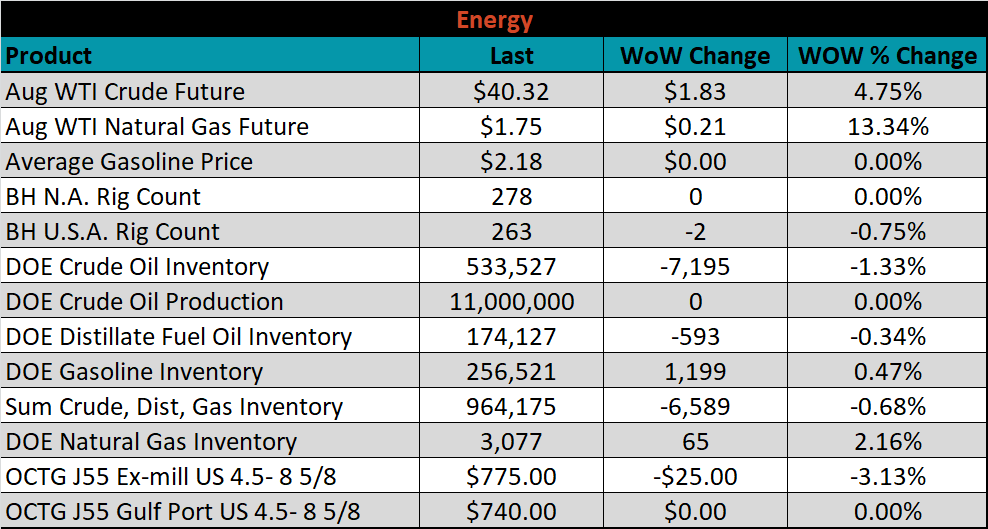
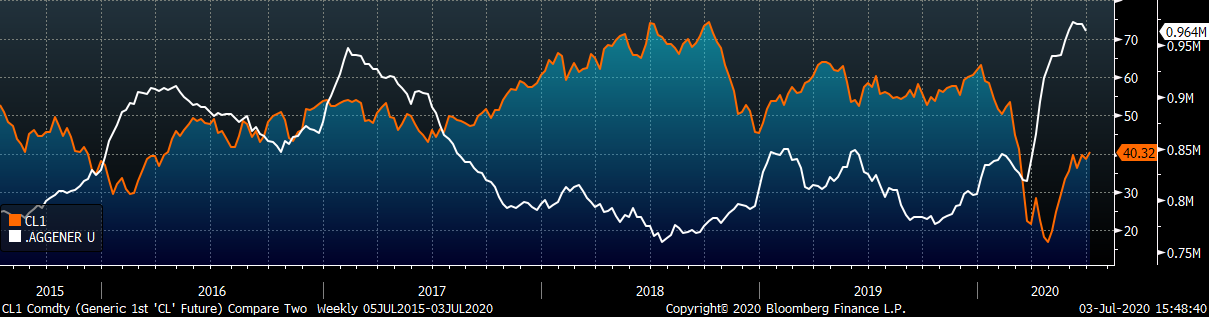
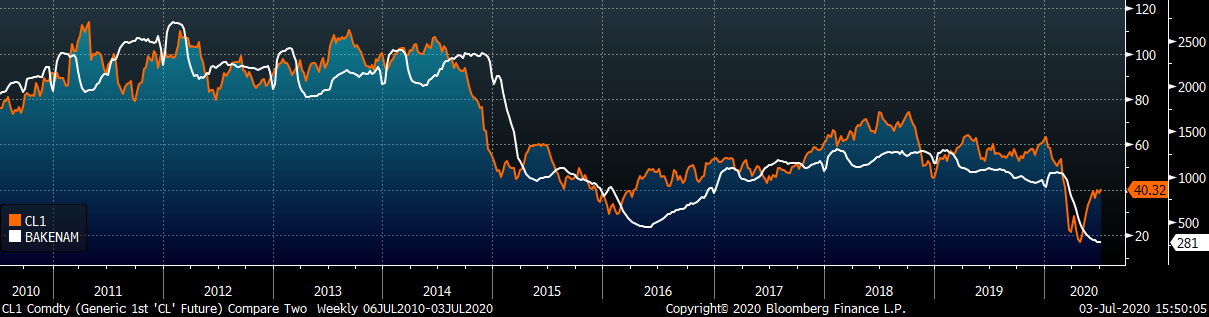
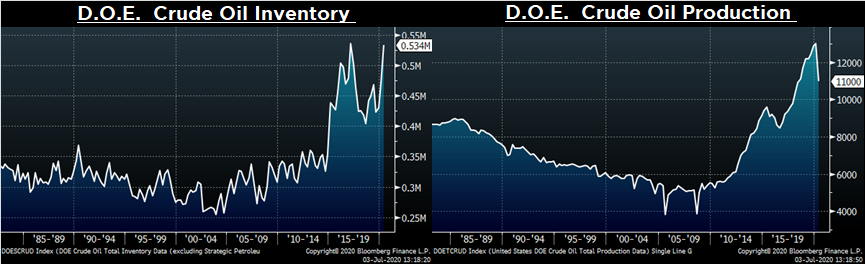
Last week, the August WTI crude oil future gained $1.83 or 4.8% to $40.32/bbl. The aggregate inventory level was down 0.7%, while crude oil production flat at 11.1m bbl/day. The Baker Hughes North American rig count was unchanged, while the U.S. rig count was down 2 rigs.
The list below details some upside and downside risks relevant to the steel industry. The orange ones are occurring or look to be highly likely. The upside risks look to be in control.
Upside Risks:
Downside Risks: