

July 1, 2022

Market Commentary
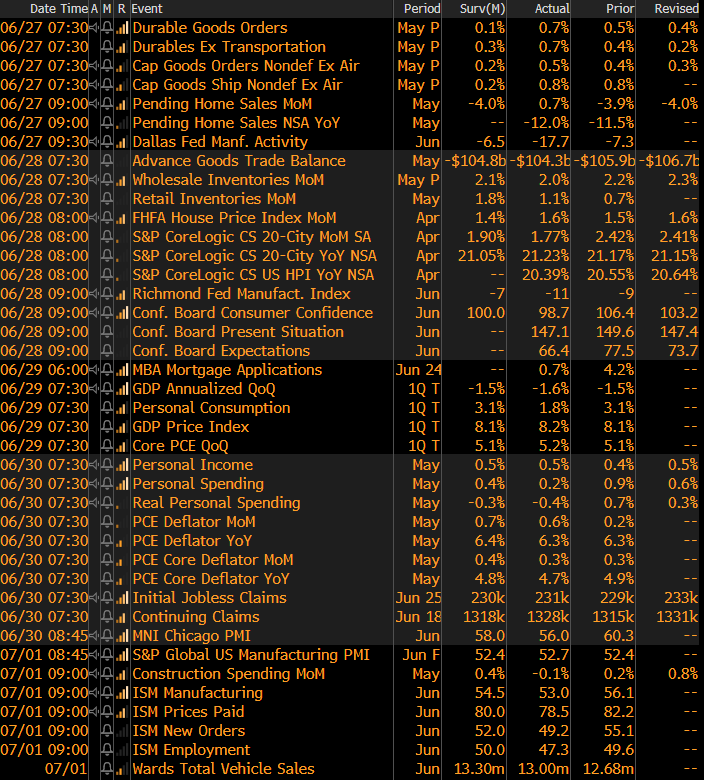
On Friday, July 1st, there was a large release of economic data from the U.S. and Global Manufacturing PMIs as well as construction spending. The data was mostly below expectations and is representative of the recent slowing in the broader economy. With that in mind, the HRC spot price clearly has room to move lower, however, the forward curve is approaching FGM’s estimated cost floor for both imports and domestic producers. History tells us that the opportunity to lock in discounts on the curve has usually disappeared by the time the spot price reaches that level. The point is, if you are only focused on buying the bottom of the spot market, you can easily miss out on an opportunity to secure a better price for the next 12 months.
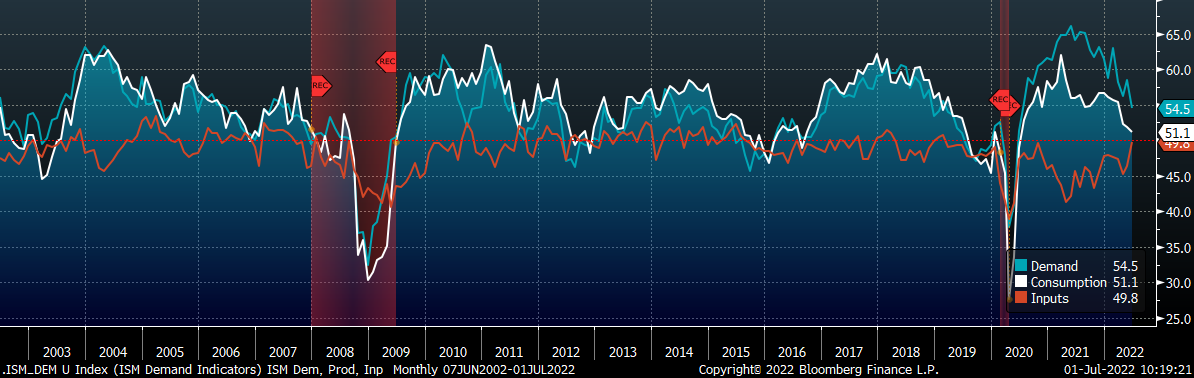
The key takeaway from the ISM Manufacturing PMI is that demand subindexes remain under pressure.
- The new orders subindex slipped into contraction territory for the first time in 25 months.
- Backlog and new orders also printed lower but remain in expansionary territory.
- Easing supply-chain issues helped the Input subindex ease further toward expansion territory and the Supplier Deliveries subindex fall to the lowest level since July 2020.
- A deepening contraction in the Employment subindex put additional pressure on consumption, lower again in June toward contraction territory at 51.1.
ISM Manufacturing PMI: Demand (blue), Consumption (white), & Inputs (orange)
ISM PMI
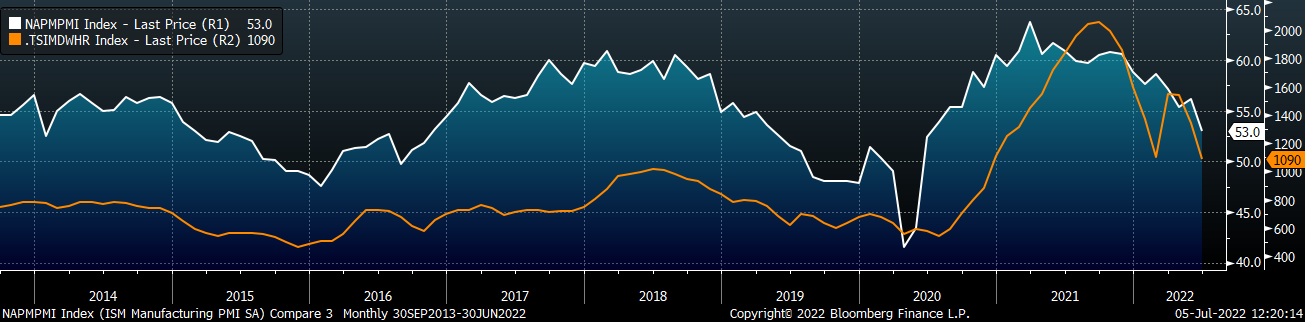
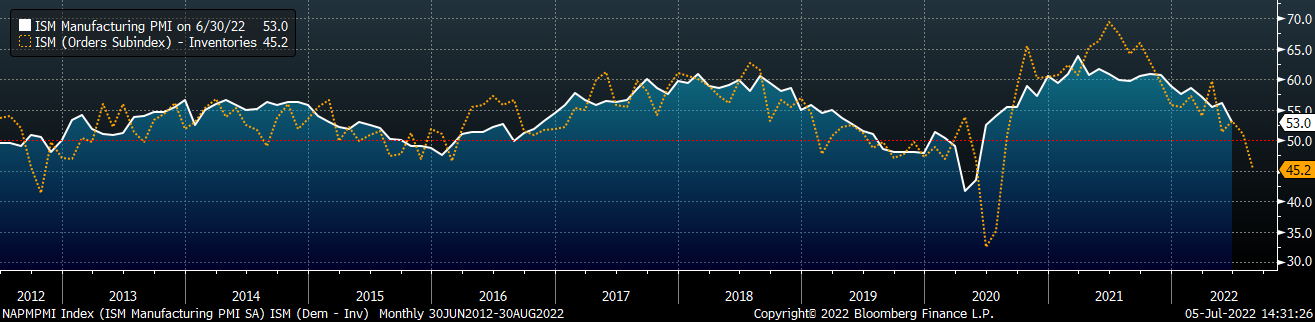
The chart below is the Platts Midwest HRC index (orange) and the ISM Manufacturing PMI (white). The topline ISM Manufacturing PMI index beat expectations and moved higher into expansion territory, while the Midwest HRC price fell in May.
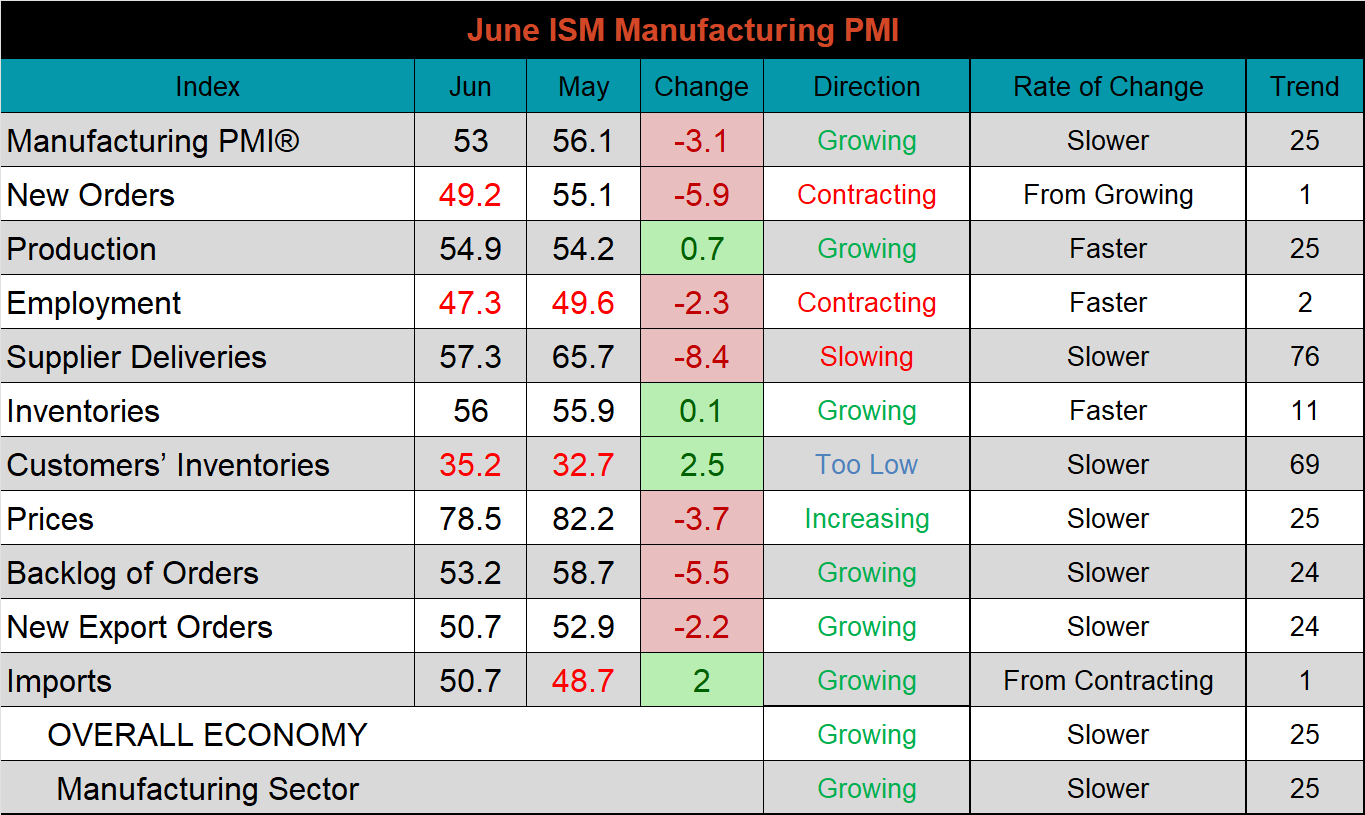
The June ISM Manufacturing PMI and subindexes are below.
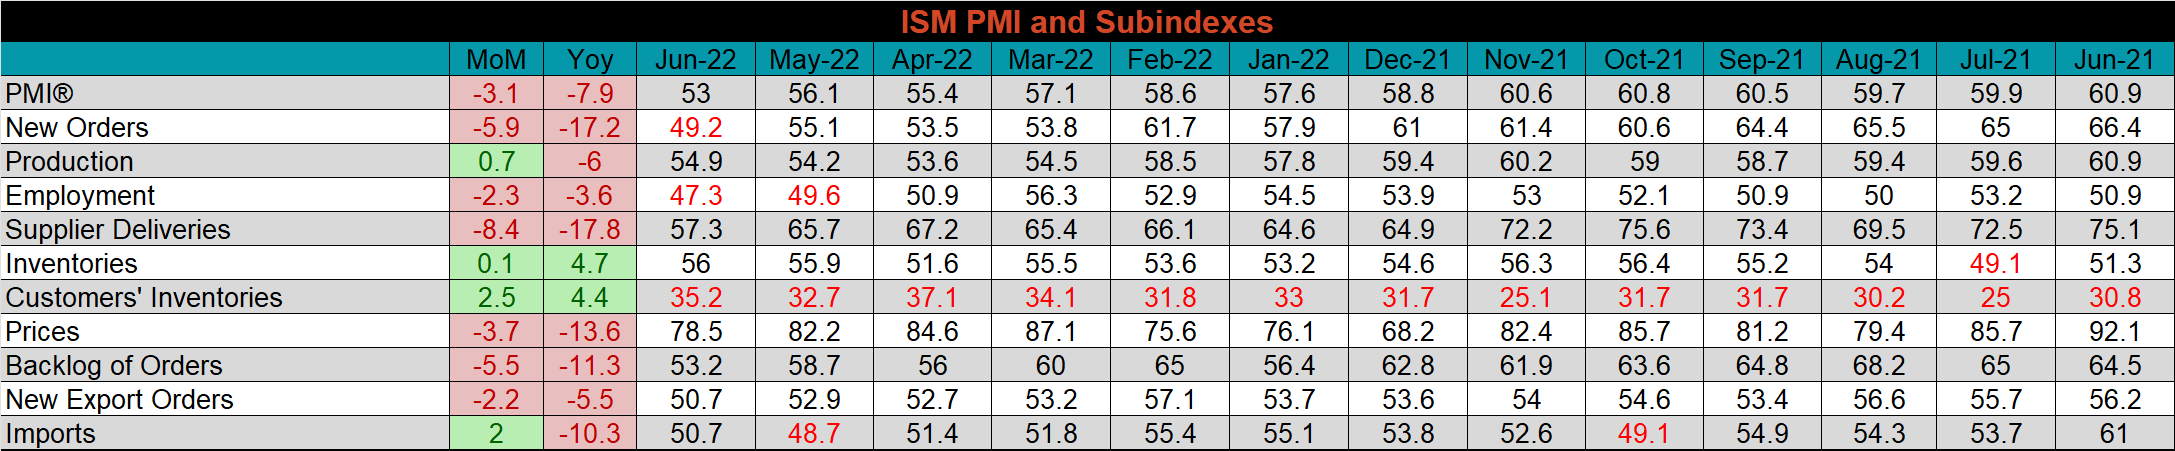
The table below shows the historical values of each subindex over the last twelve months. It’s clear that the manufacturing sector is not growing at the same rate it was last year. Only the inventories and customers’ inventories subindexes are higher than last year’s level, while supplier deliveries and new orders have contracted the most YoY, down 17.8, and 17.2, respectively.
Looking to the future, the chart below shows the orders subindex (new orders & backlog) minus inventories. This equation has led the topline ISM Manufacturing PMI number with reasonable certainty and suggests the manufacturing sector will likely be under pressure in the coming months.
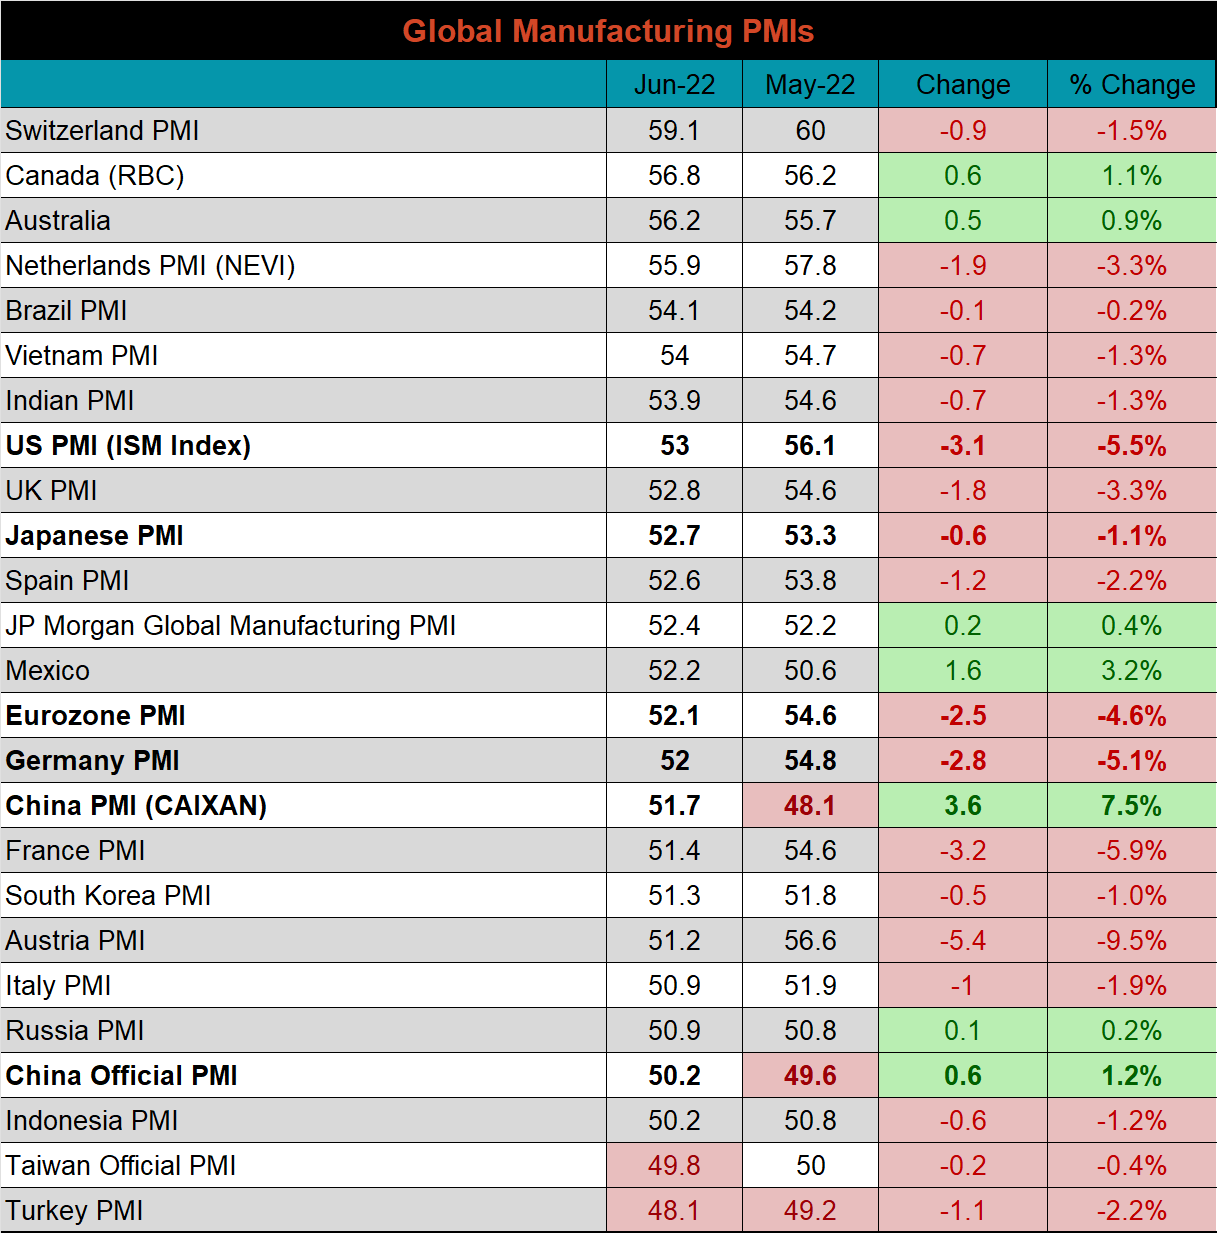
Global PMI
Global PMI data released in June showed ongoing strength in the global manufacturing sector, however, the rate of expansion slowed in 18 out of the 23 watched countries. Taiwan joined Turkey as the two countries with contracting manufacturing sectors during the month.
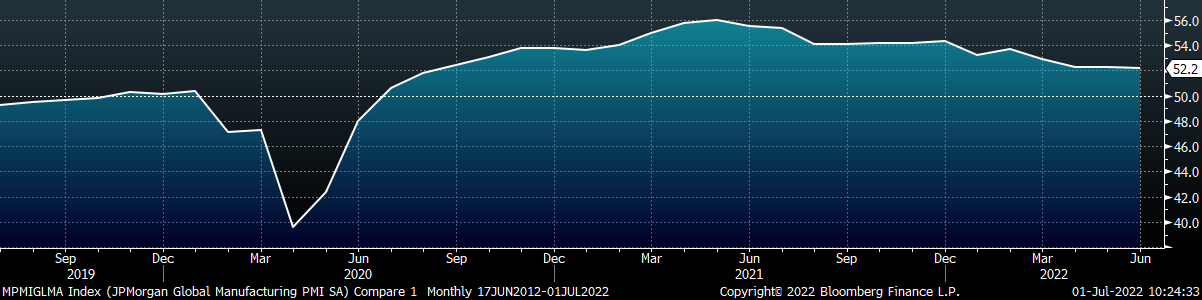
J.P. Morgan Global Manufacturing
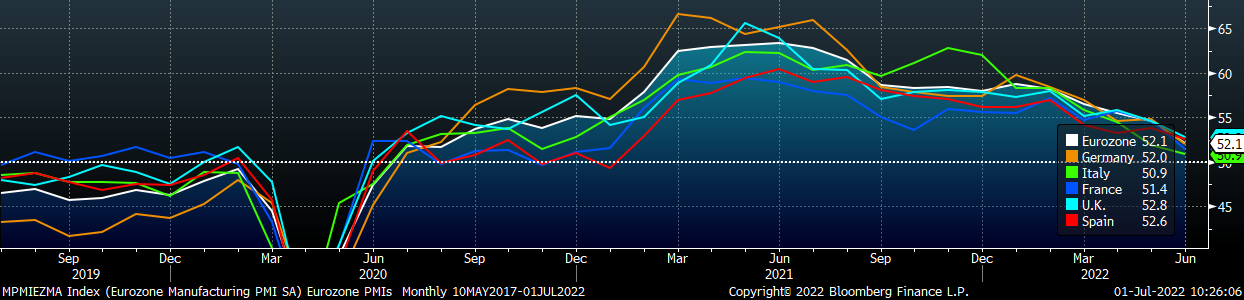
Eurozone (white), German (orange), Italian (green), Spanish (red), and French (blue), U.K. (teal) Manufacturing PMIs
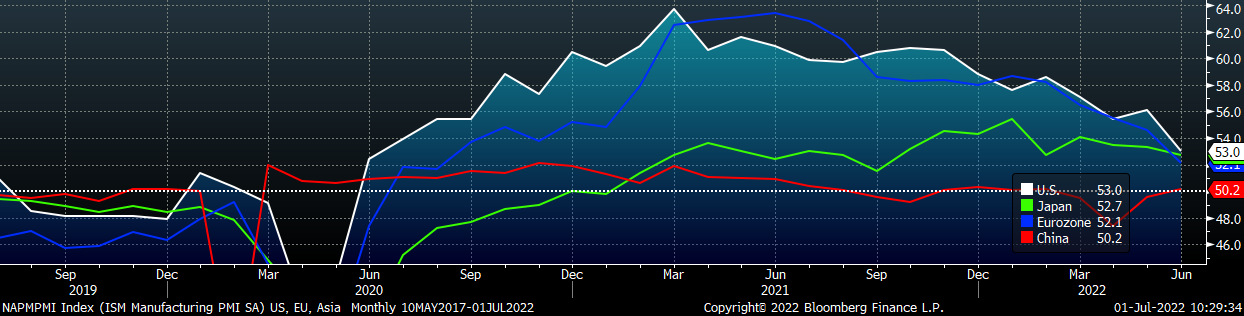
US (white), Euro (blue), Chinese (red) and Japanese (green) Manufacturing PMIs
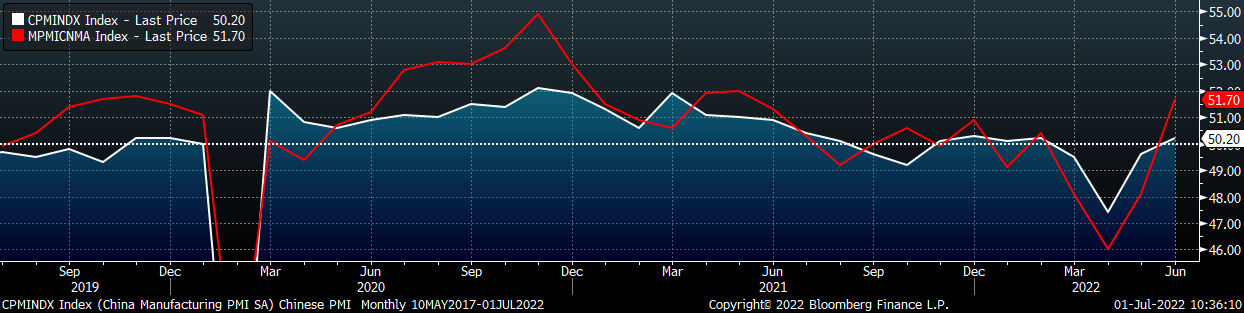
The Caixan and Chinese official PMI indexes both printed higher and pushed into expansion territory.
China Official (white) and Caixan (red) Manufacturing PMIs
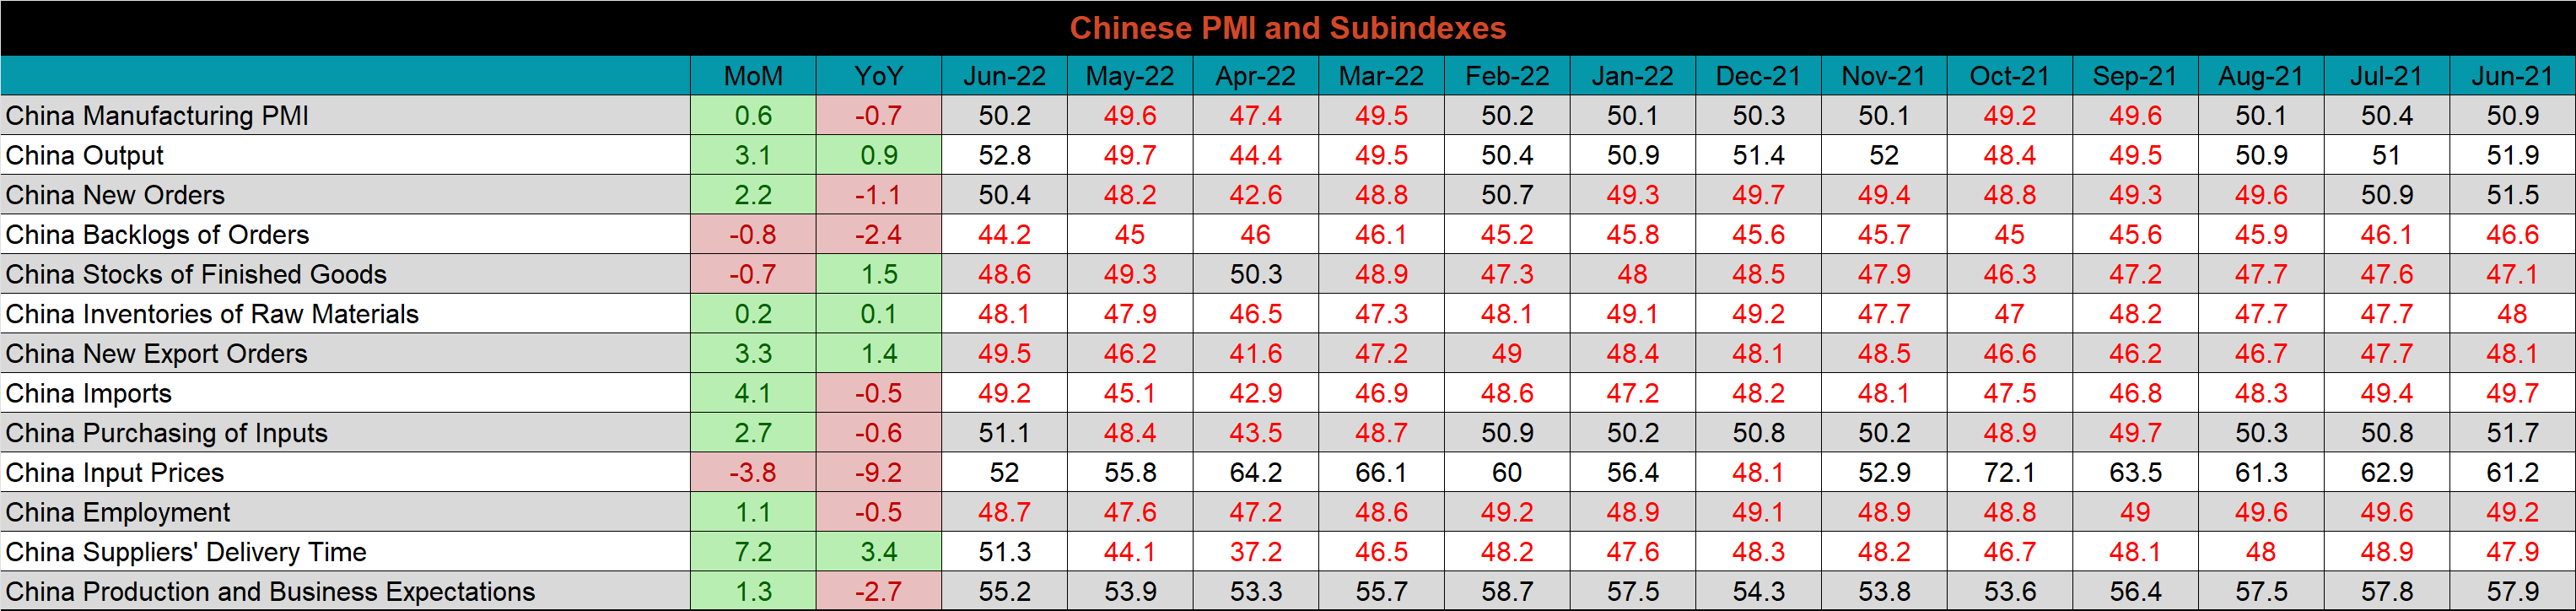
The table below breaks down China’s official manufacturing PMI subindexes. Input prices were down the most MoM and YoY for the second month in a row. New orders and output, and purchasing of inputs all moved into expansion territory, a welcome sign for the global market which has been constrained by China’s absence from the market due to strict Covid lockdown policies.
Construction Spending
May seasonally adjusted U.S. construction spending was down 0.1% MoM, but was 9.7% higher than May 2021.
May U.S. Construction Spending
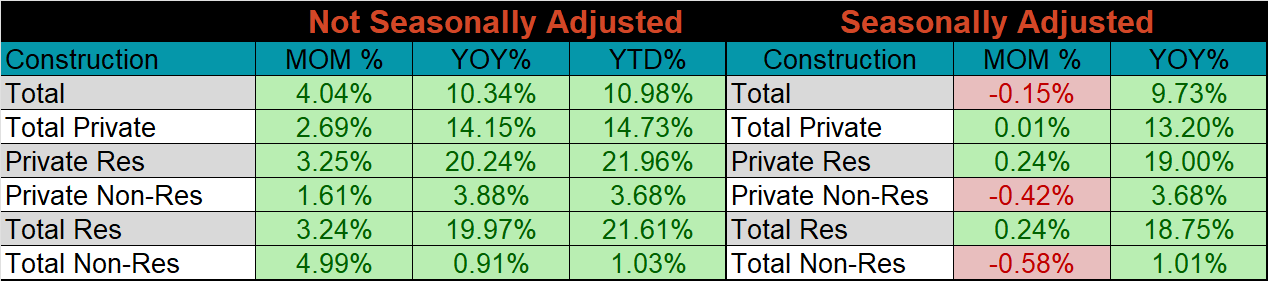
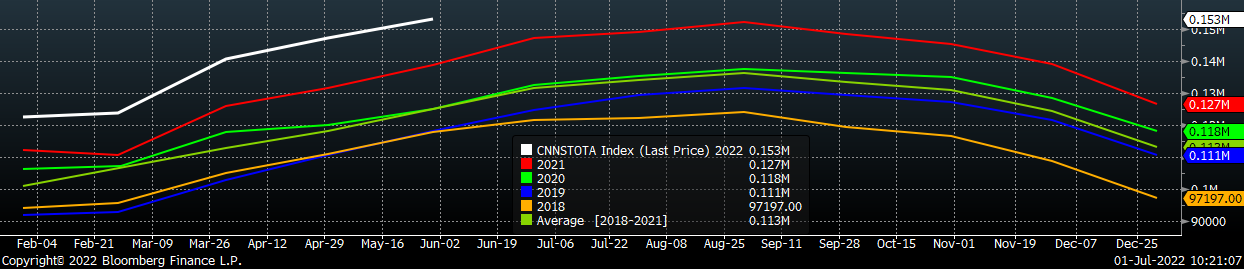
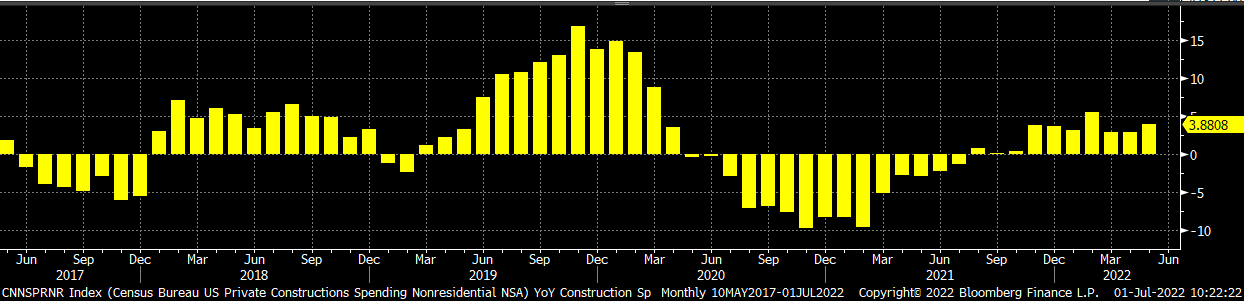
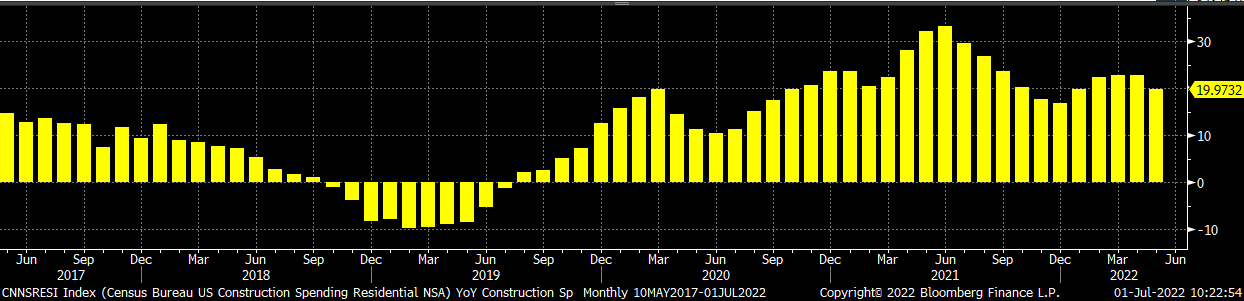
The white line in the chart below shows the continued growth in this year’s not seasonally adjusted construction spending in 2022, compared to the spending of the previous 4 years. The two bottom charts below show the YoY changes in construction spending. Both residential and non-residential spending continue to grow, however, the rate of growth for nonresidential decreased significantly due to the annual revision of prior year spending, which increased the 2021 levels.
U.S. Construction Spending NSA
U.S. Private Nonresidential Construction Spending NSA YoY % Change
U.S. Residential Construction Spending NSA YoY % Change
Risks
Below are the most pertinent upside and downside price risks:
Upside Risks:
- China reopening its economy with further stimulus measures
- Unplanned & extended planned outages, including operational issues leaving mills behind
- Seasonal pick-up in demand leading to regional shortages
- Easing supply chain restraints and labor shortages causing an increase in manufacturing activity
- Reluctance in placing import orders, leading to a dramatic reduction in arrivals later this year
Downside Risks:
- Decreasing input costs allowing mills to aggressively sell lower while remaining profitable
- Elevated price differentials and hedging opportunities leading to sustained higher imports
- Steel consumers substitute to lower-cost alternatives
- Limited desire to restock at elevated prices and persistently short lead times causing a “Buyer’s Strike”
- Economic slowdown caused by increasing interest rates
HRC Futures
All of the below data points are as of July 1, 2022.
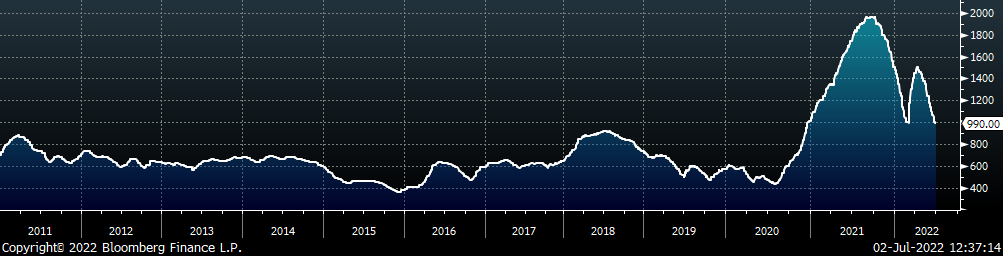
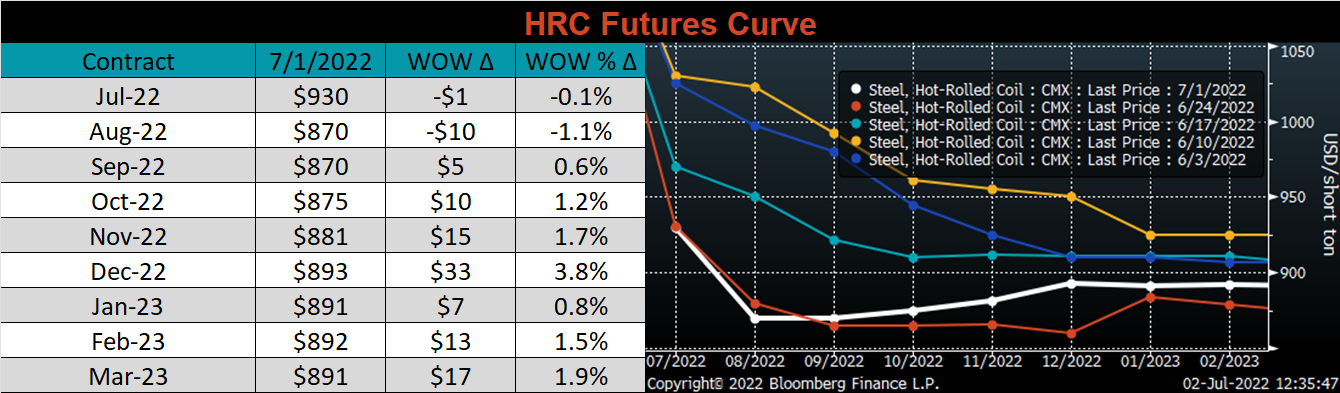
The Platts TSI Daily Midwest HRC Index was down $60 to $990.
Platts TSI Daily Midwest HRC Index
The CME Midwest HRC futures curve is below with last Friday’s settlements in white. The front of the curve was slightly lower while expirations Sep-22 and beyond all increased. This represents the first time that the curve traded in contango (where the front of the curve is priced lower than the back of the curve) since it happened briefly in February, just before the Russian invasion into Ukraine occurred.
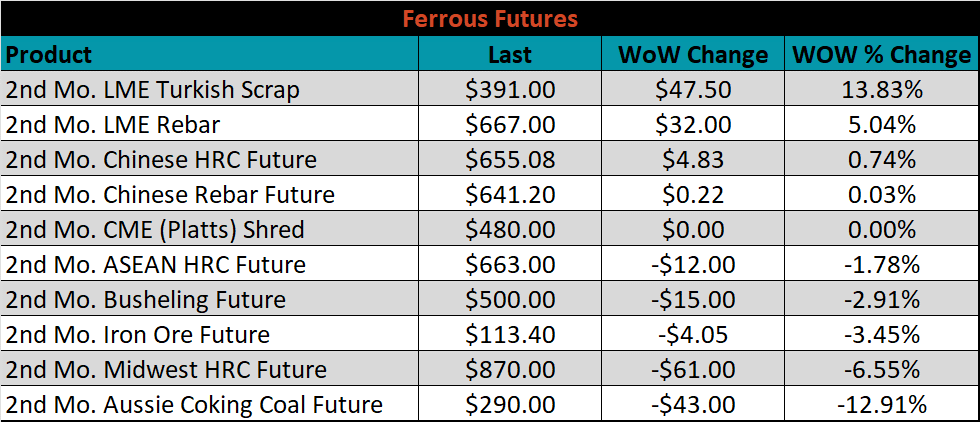
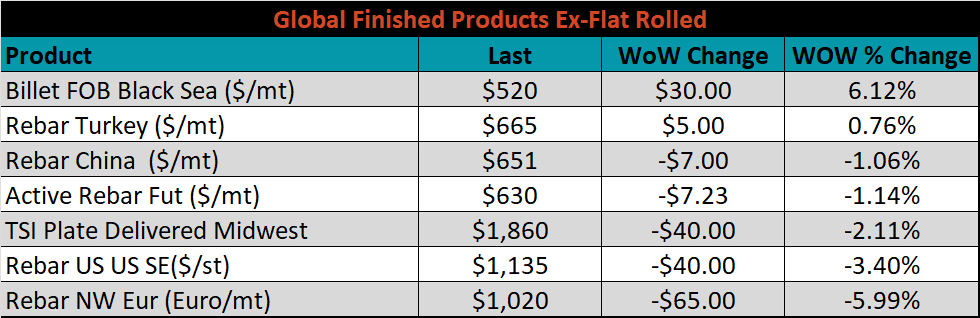
The 2nd month ferrous futures were mixed this week. LME Turkish Scrap surged over 13.8%, while Aussie Coking Coal was down another 12.9%.
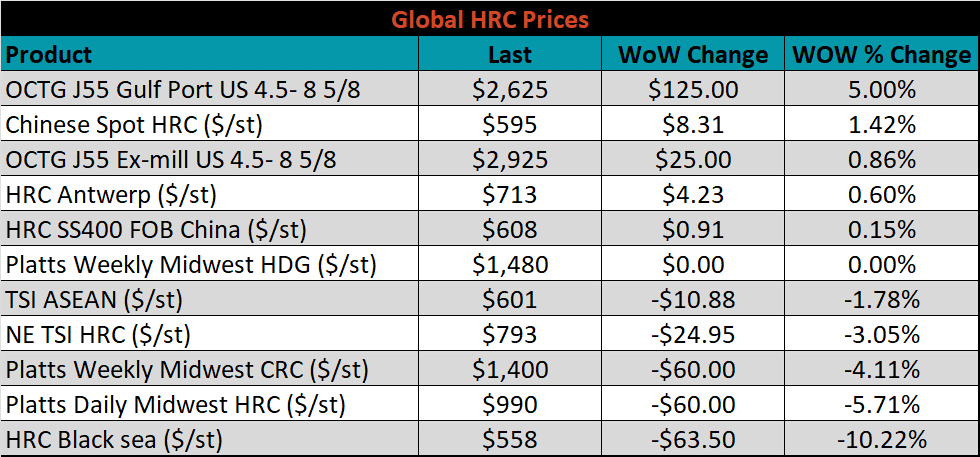
Global flat rolled indexes moved mostly lower, led by HRC Black Sea, down 10.2%, while the Chinese spot HRC price was up 1.4%.
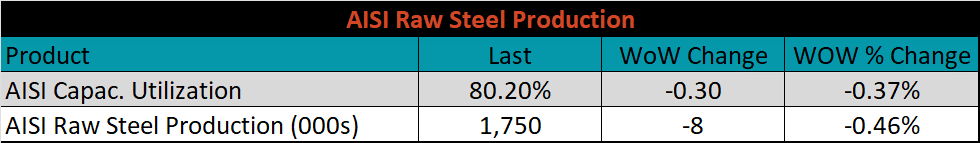
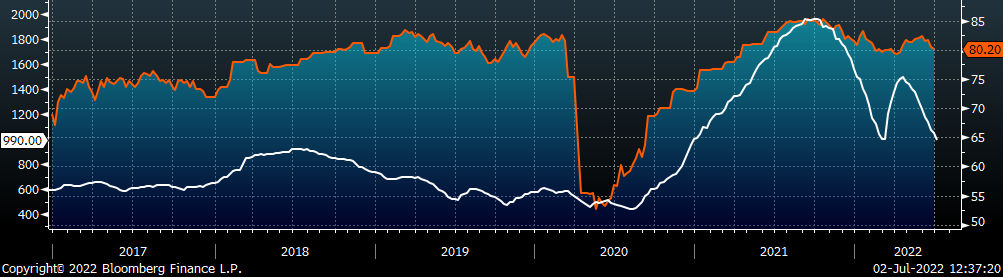
The AISI Capacity Utilization was down 0.3% to 80.2%.
AISI Steel Capacity Utilization Rate (orange) and Platts TSI Daily Midwest HRC Index (white)
Imports & Differentials
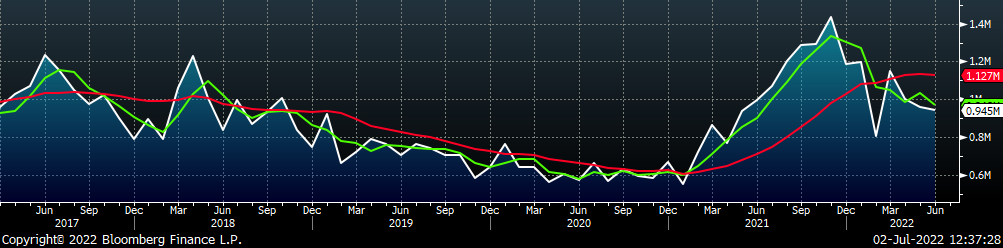
June flat rolled import license data is forecasting an decrease of 14k to 945k MoM.
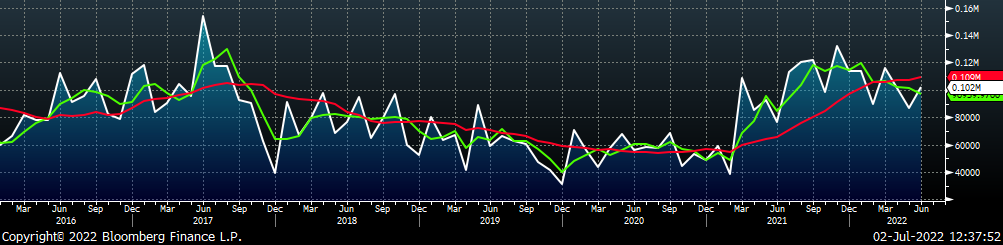
All Sheet Imports (white) w/ 3-Mo. (green) & 12-Mo. Moving Average (red)
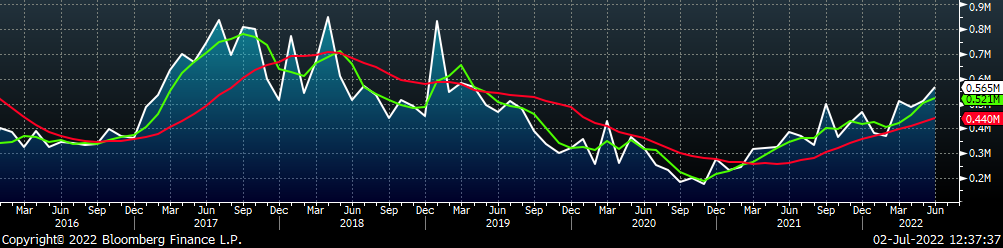
Tube imports license data is forecasting an increase of 54k to 565k in June.
All Tube Imports (white) w/ 3-Mo. (green) & 12-Mo. Moving Average (red)
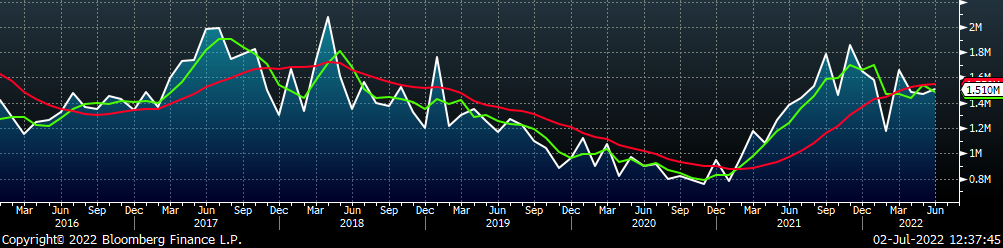
All Sheet plus Tube (white) w/ 3-Mo. (green) & 12-Mo. Moving Average (red)
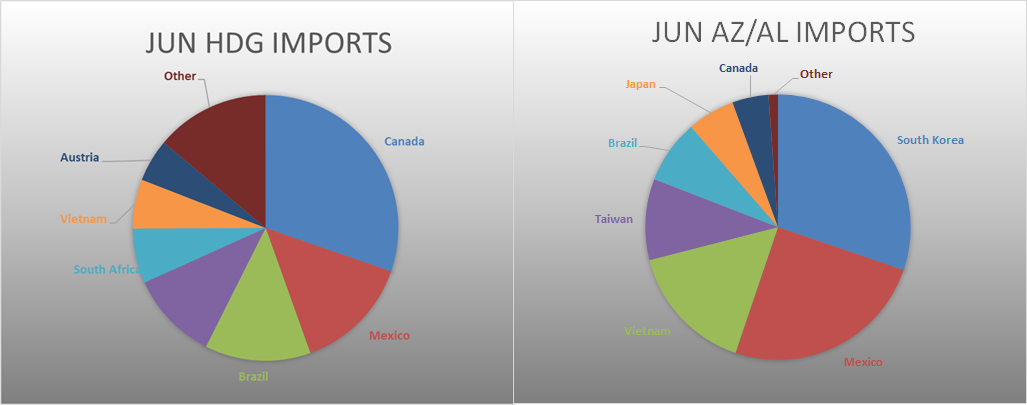
June AZ/AL import license data is forecasting an increase of 15k to 102k.
Galvalume Imports (white) w/ 3 Mo. (green) & 12 Mo. Moving Average (red)
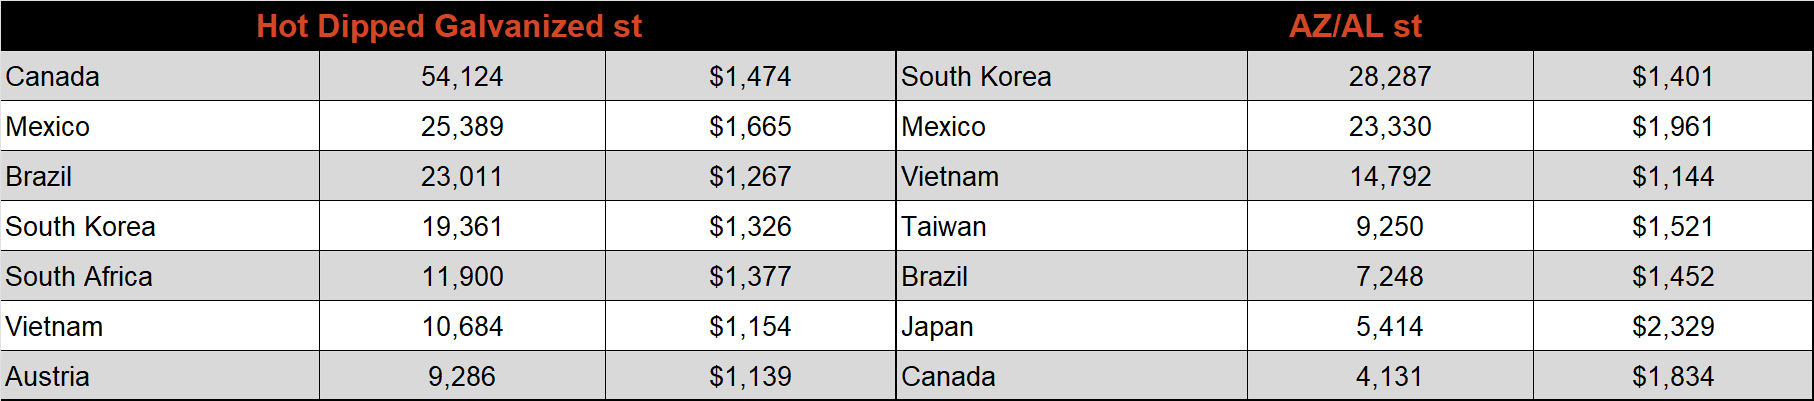
Below is June import license data through June 27th, 2022.
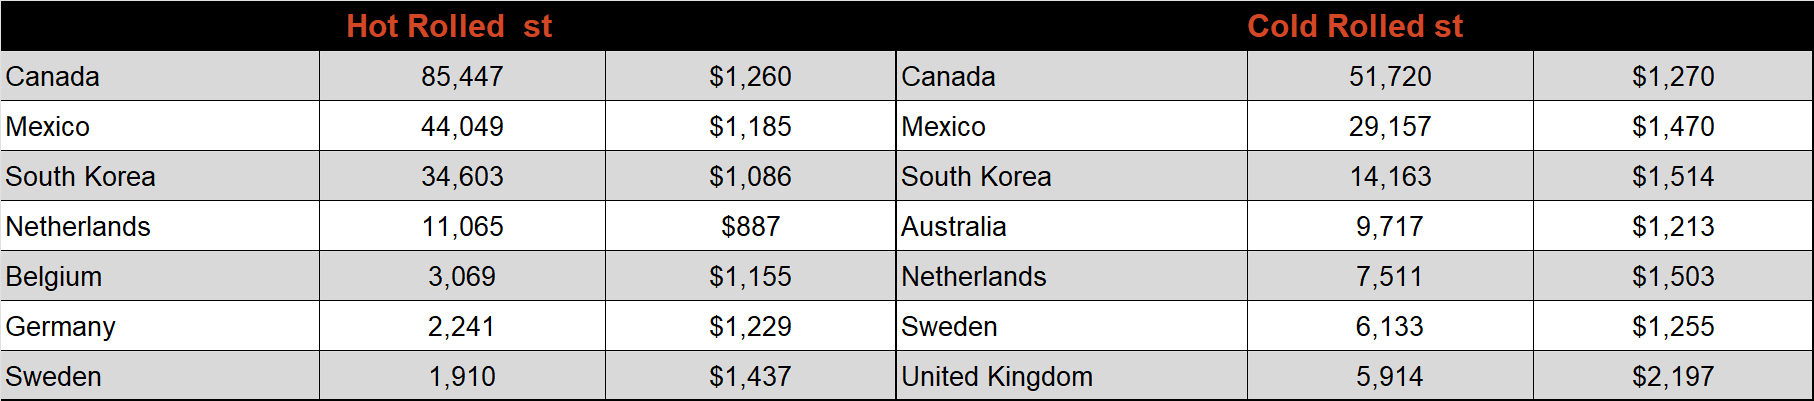
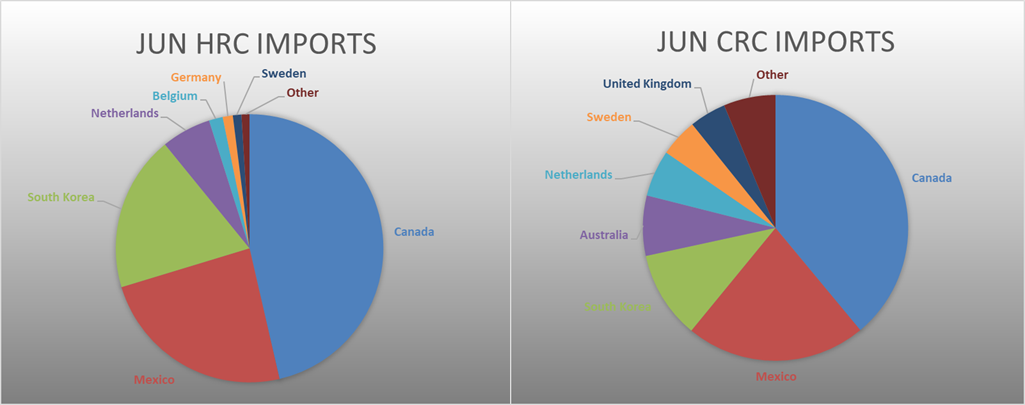
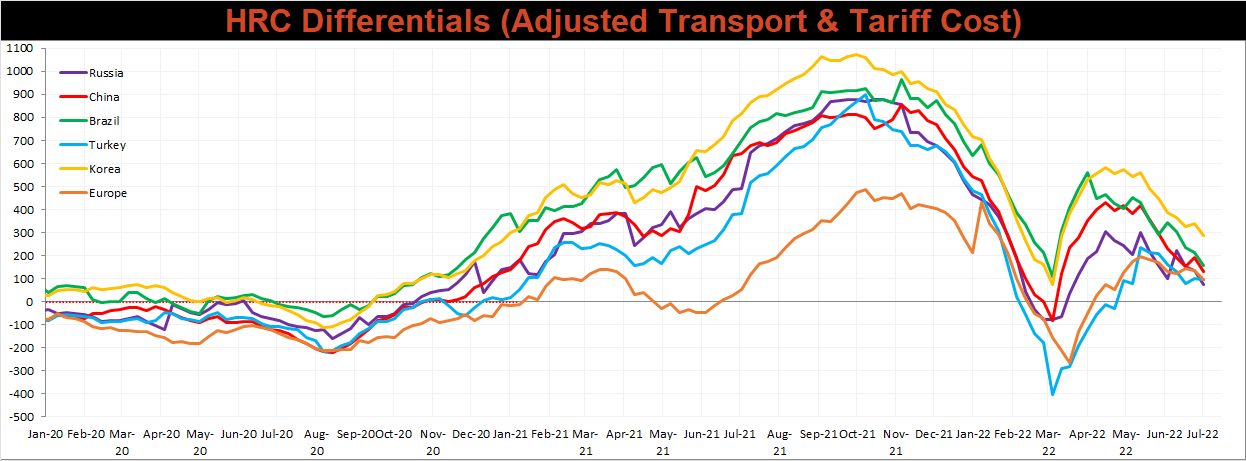
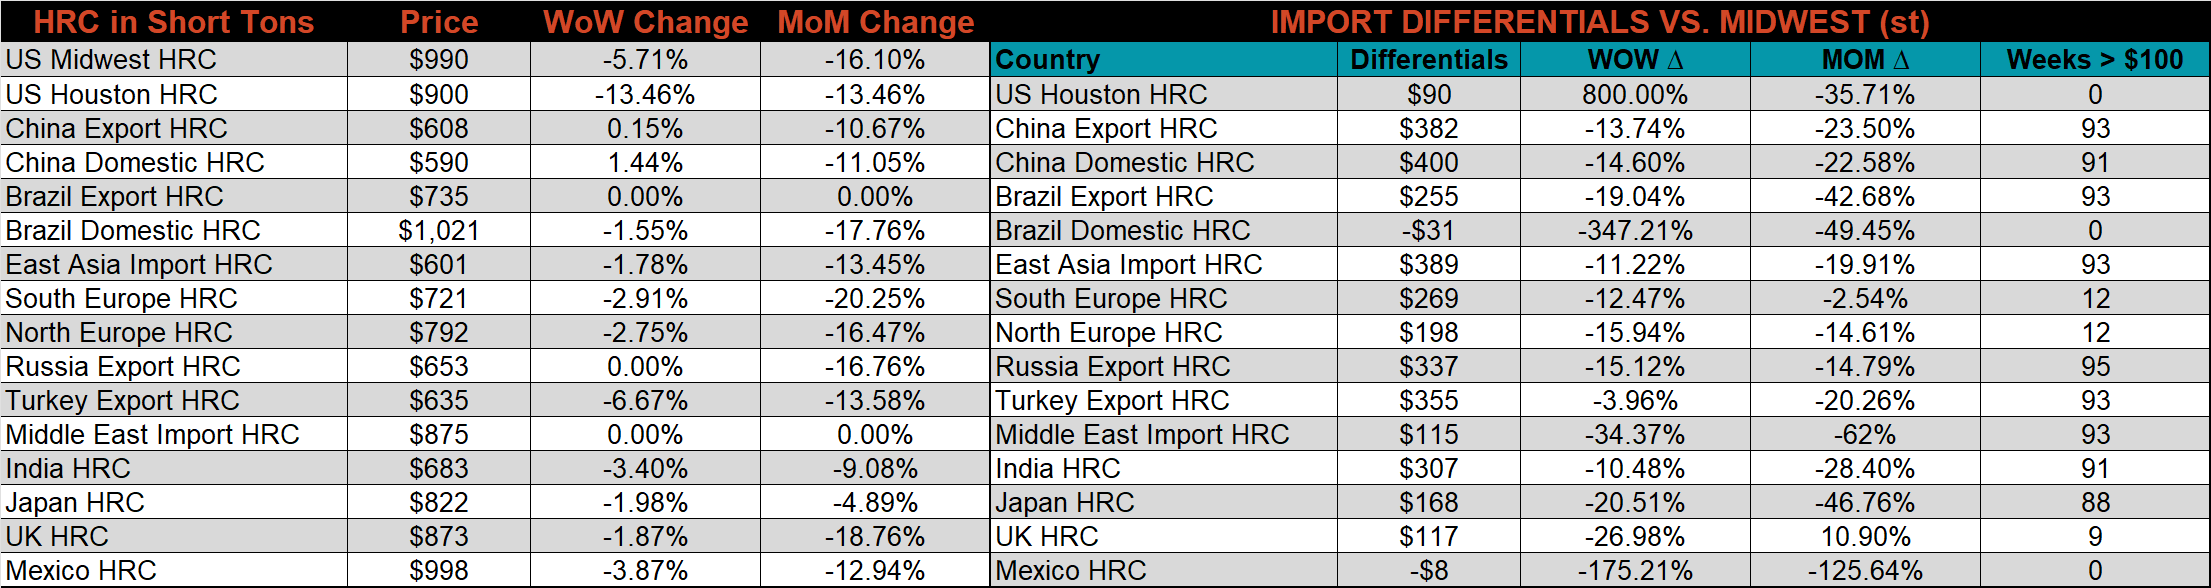
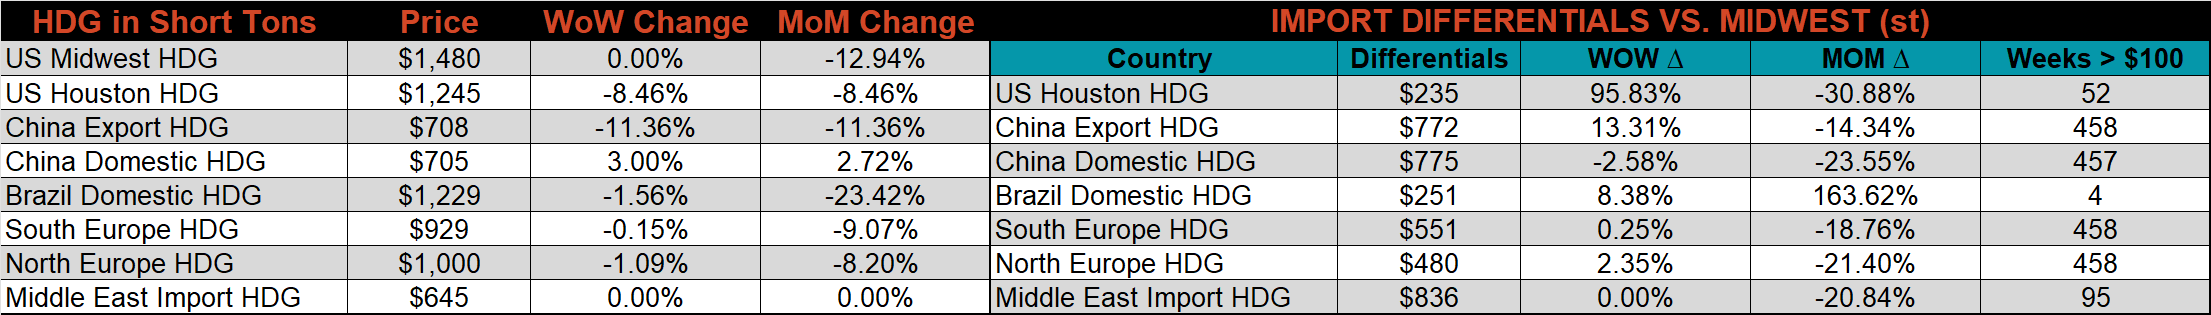
Below is the Midwest HRC price vs. each listed country’s export price using pricing from SBB Platts. We have adjusted each export price to include any tariff or transportation cost to get a comparable delivered price. Differential data moved lower across the board.
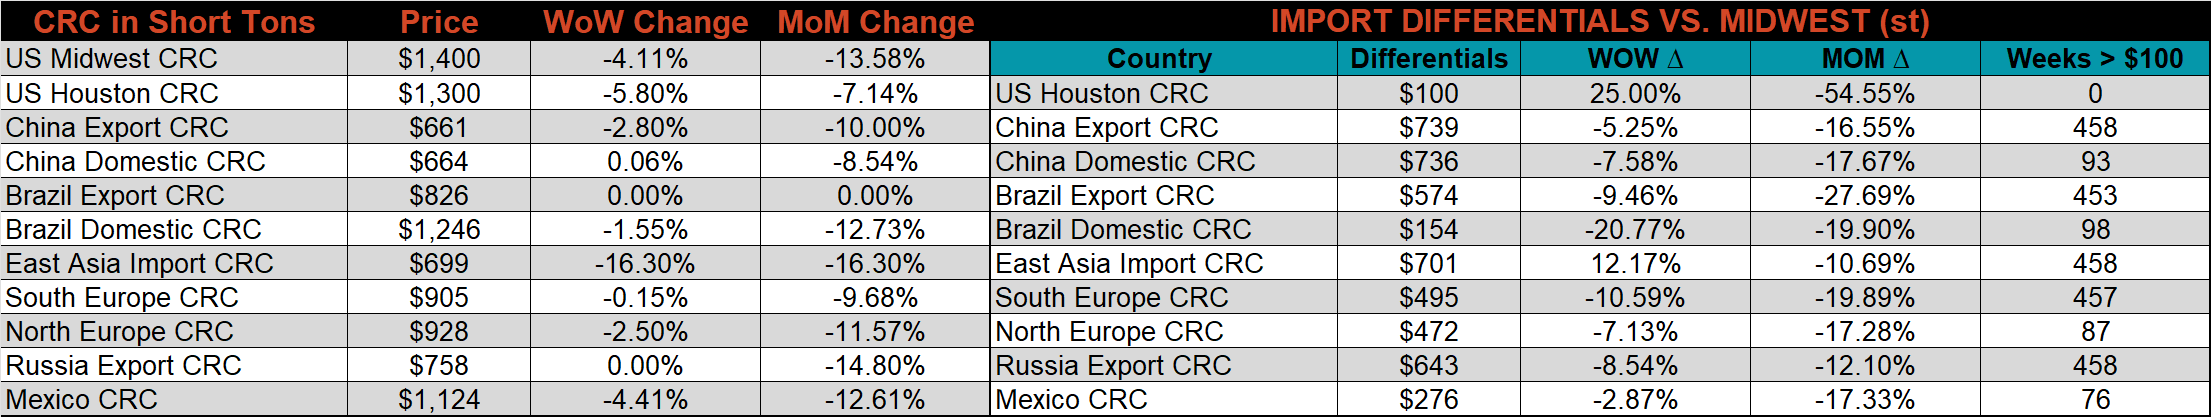
SBB Platt’s HRC, CRC, and HDG pricing is below. The Midwest HRC price was down 5.7%, CRC down 4.1%, while HDG price remained flat. The East Asian CRC export price fell the most, down 16.3% WoW.
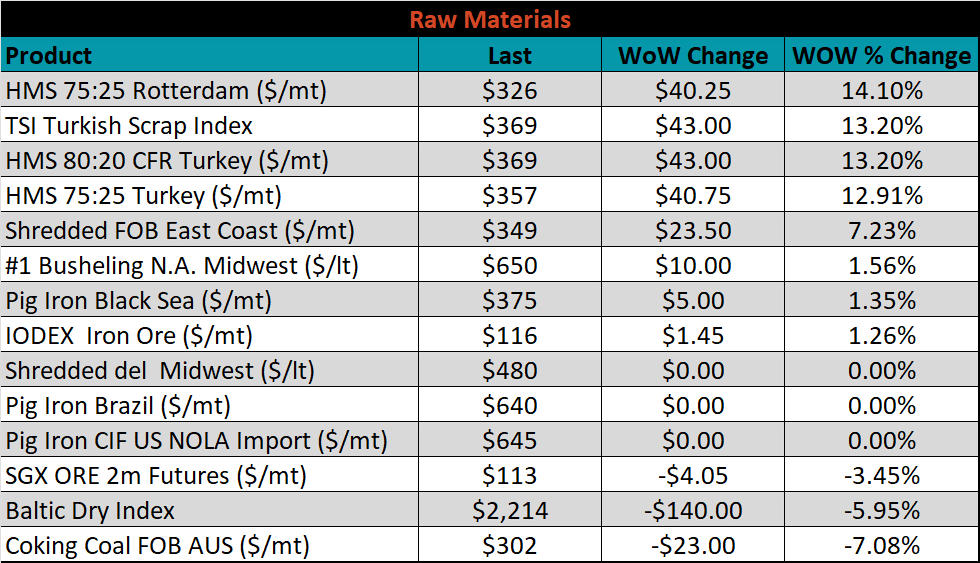
Raw Materials
Raw material prices were mixed this week with gains led by HMS 75:25 Rotterdam, up 14.1%, and losses led by Aussie coking coal, down 7.1%
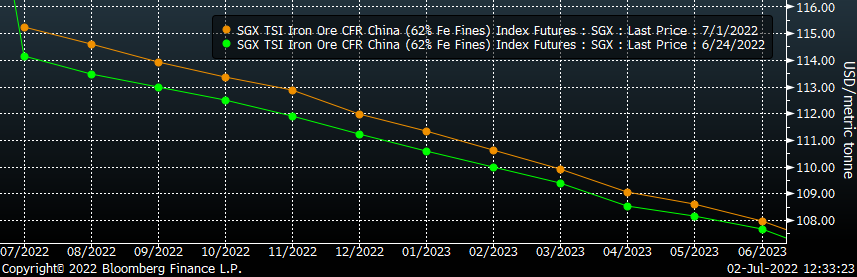
Below is the iron ore future curve with Friday’s settlements in orange, and the prior week’s settlements in green. Last week, the entire curve shifted slightly higher with more emphasis on the front of the curve.
SGX Iron Ore Futures Curve
The ex-flat rolled prices are listed below.

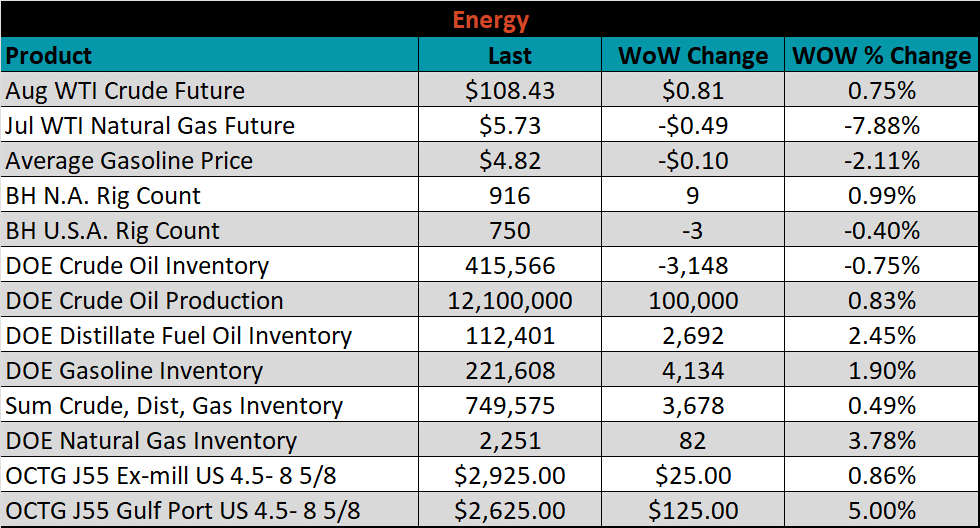
Energy
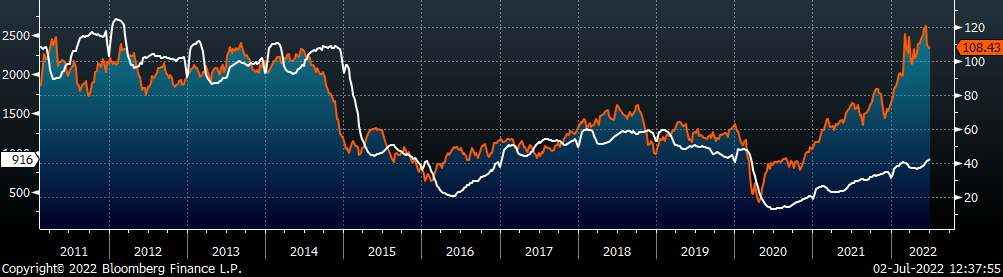
Last week, the August WTI crude oil future gained $0.81 or 0.8% to $108.43/bbl. The aggregate inventory level decreased 0.75%. The Baker Hughes North American rig count increased 9 rigs, while the U.S. rig count decreased 3 rigs.
August WTI Crude Oil Futures (orange) vs. Aggregate Energy Inventory (white)
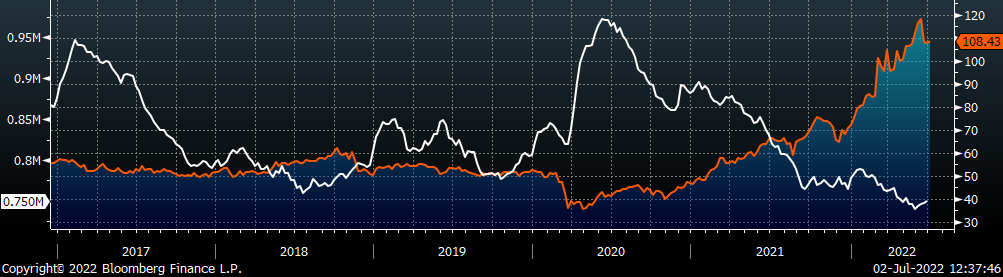
Front Month WTI Crude Oil Future (orange) and Baker Hughes N.A. Rig Count (white)
The list below details some upside and downside risks relevant to the steel industry. The bolded ones are occurring or highly likely.
Upside Risks:
- Inventory at end users and service centers below normal operational levels
- Higher share of discretionary income allocated to goods from steel intensive industries
- Changes in China’s policies regarding ferrous markets, including production cuts and exports
- Unplanned & extended planned outages, including operational issues leaving mills behind
- Energy & construction industry rebound
- Easing labor and supply chain constraints allowing increased manufacturing activity
- Mills extending outages/taking down capacity to keep prices elevated
- Global supply chains and logistics restraints causing regional shortages
- Fiscal policy measures including a new stimulus package
- Contentious union labor negotiations leading to supply disruption
- Fluctuating auto production, pushing steel demand out into the future
- Threat of further protectionist trade policies muting imports
Downside Risks:
- Increased domestic production capacity
- Elevated price differentials and hedging opportunities leading to sustained higher imports
- Steel consumers substitute to lower cost alternatives
- Steel buyer’s and consumers “double ordering” to more than cover steel needs
- Tightening credit markets, as elevated prices push total costs to credit caps
- Supply chain disruptions allowing producers to catch up on orders
- Limited desire to restock at elevated prices, causing a “Buyer’s Strike”
- Economic slowdown caused by the emergence of Coronavirus Variants
- Reduction and/or removal of domestic trade barriers
- Political & geopolitical uncertainty
- Chinese restrictions in property market
- Unexpected sharp China RMB devaluation