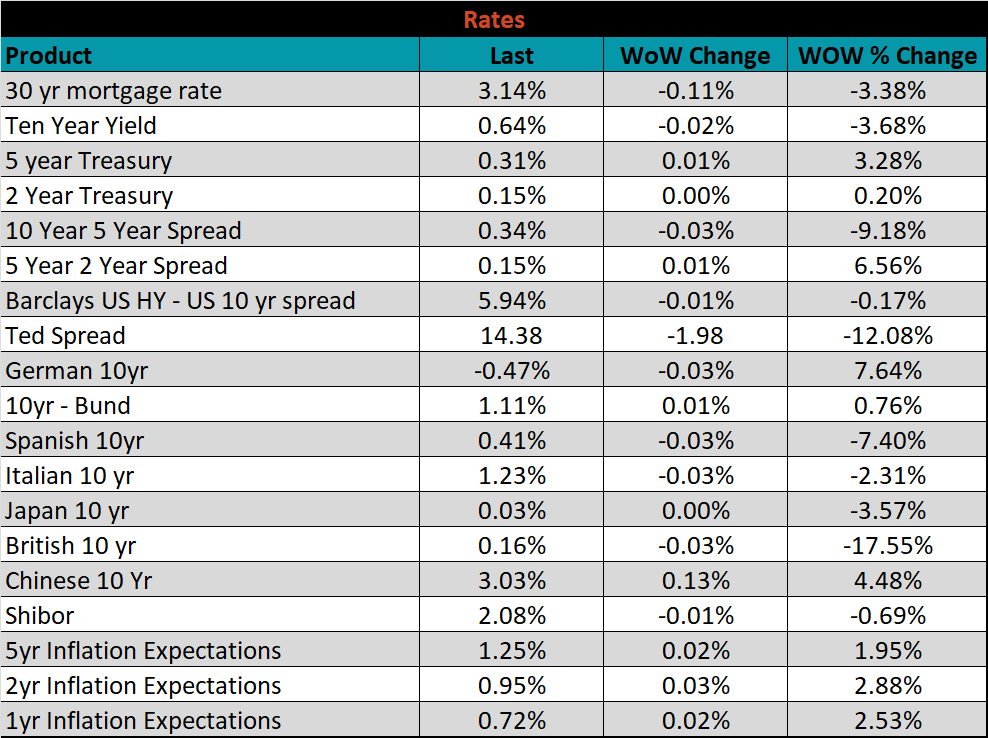
Content
-
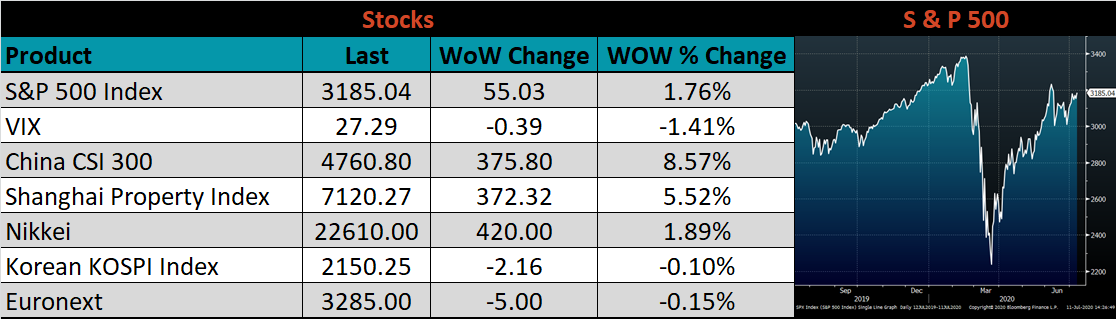
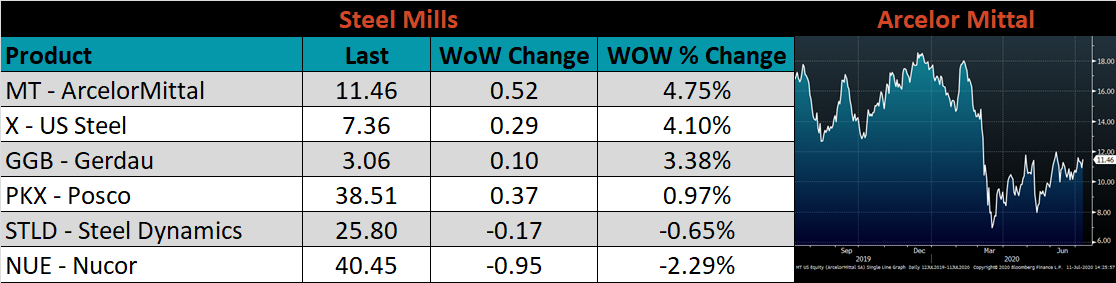
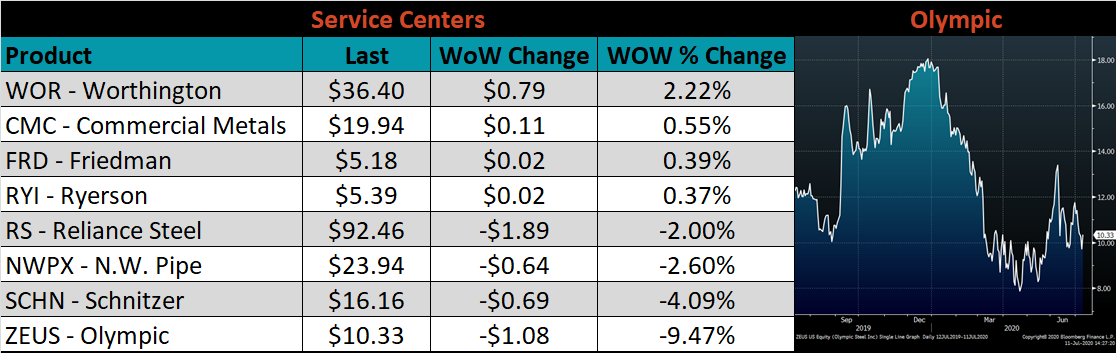
Weekly Highlights
- Market Commentary
- Durable Goods
- Risks


While the physical market has been extremely quiet over the past week, spot price have continued to drift lower as mills are offering lower prices and buyers sit on the sidelines. During price cycles as spot prices fall, we attempt to find a level where prices will find support based on numerous indicators that we put in our report each week. Several of those indicators – including raw material costs, global price differentials, HRC vs scrap price spreads and lead times – are signaling that a bottom may be near based on historical levels. Despite these indications, we believe that additional dynamics are influencing the market right now and spot prices can continue to decline due the continued oversupplied condition in the market and the lingering impact of Covid-19.
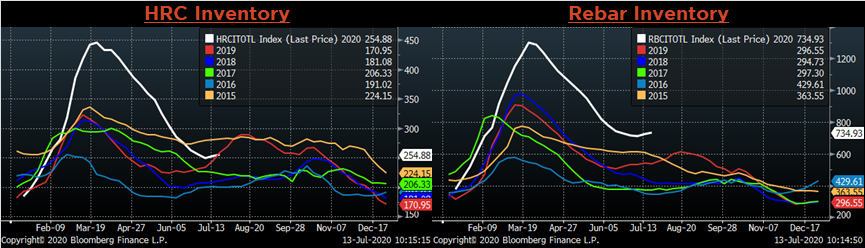
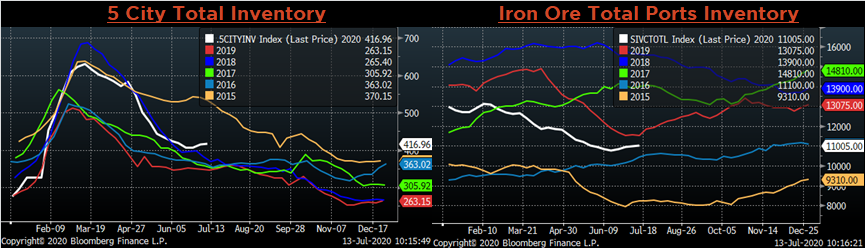
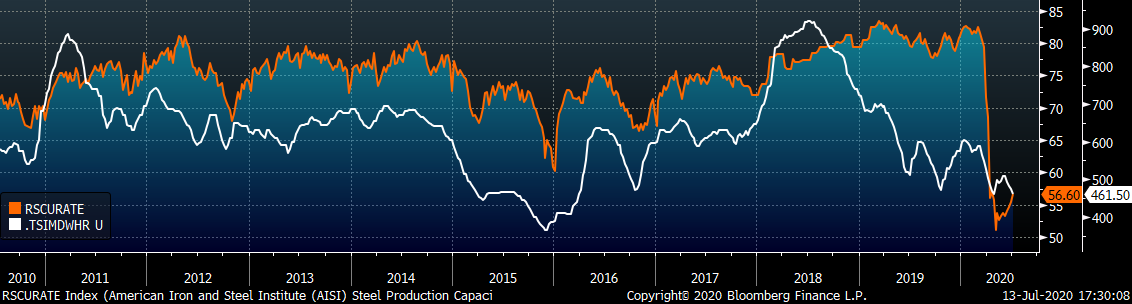
Early in the second quarter, mills took swift action to idle furnaces and throttle down production in the mist of the economic shutdown and demand destruction in the steel market. The below chart shows the severity of these production cuts.
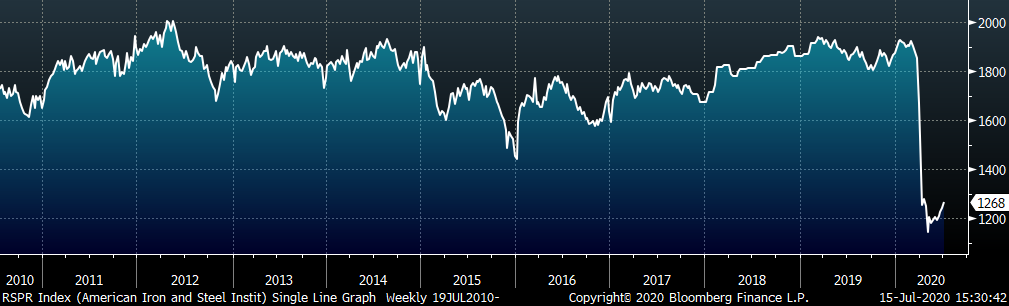
The production index bottomed in May and has steadily increased each week since. This rebound in production indicates that there is some demand returning in the market, possibly pent up during the shutdown. The slow, steady rise in production shows that EAFs are likely increasing their production slightly to meet new demand, rather than blast furnaces restarting at a near full run rate. The recent divergence in iron ore and scrap prices leads to better profitability at EAFs compared to BOFs, supporting the mini mill in producing and selling additional tons. However, this increasing production is occurring during a period when prices have fallen, which does not bode well for the price outlook.
As we look for a possible bottoming level in prices, we must focus on where a price sensitive buyer will step in and stock up on low cost material. At those levels, buyers will purchase large quantities of material, which allows mills to fill their order books and push out lead times as they raise prices. However, with spot HRC transactions occurring in the mid $400s, there is little incentive to re-stock right now. It was only a two months ago when there were large spot transactions in the $400-420 range. Buyers today are not going to purchase speculative material for prices higher than they did 60 days ago. Moreover, they likely are still holding some of that low cost inventory.
An additional possibility explaining the oversupplied inventory in the market is from something called a “carry trade”. This entails buying and holding inventory while simultaneously selling forward on the curve at expirations several months in the future. Due to the steepness of the contago in the curve over the past few months, hedgers are able to sell at prices significantly higher than the spot price, locking in profit come expiration time. While this is likely only a small portion of the market, it is an additional seller in the market who, like a mill, is more concerned with getting rid of their inventory when the hedge expires, rather than the price it is sold. With abundant inventory already in the steel supply chains, and mills likely to increase production, lower spot prices appear inevitable.
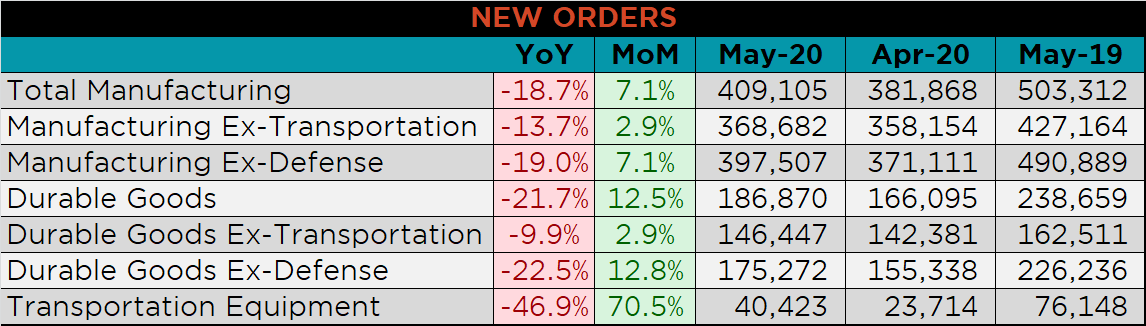
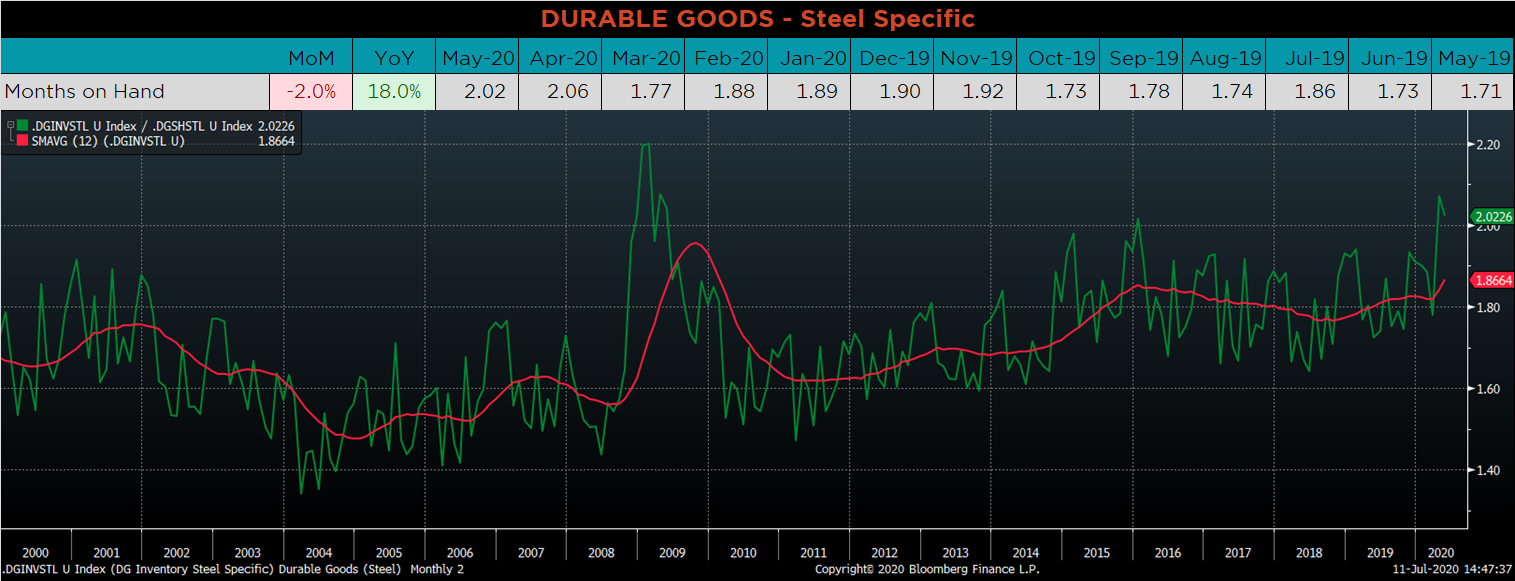
Below are final May new orders from the Durable Goods report. While new orders for manufactured goods remain significantly lower YoY, they have improved since April’s recent lows, up 7.1%. Manufacturing new orders ex-transportation decreased 13.7% compared to May 2019. The final chart looks at the months on hand (inventory divided by shipments) for durable goods categories that are steel intensive. MOH decreased slightly, as monthly inventories decreased compared to increasing shipments, but remains at the highest level since 2009.
Below are the most pertinent upside and downside price risks:
Upside Risks:
Downside Risks:
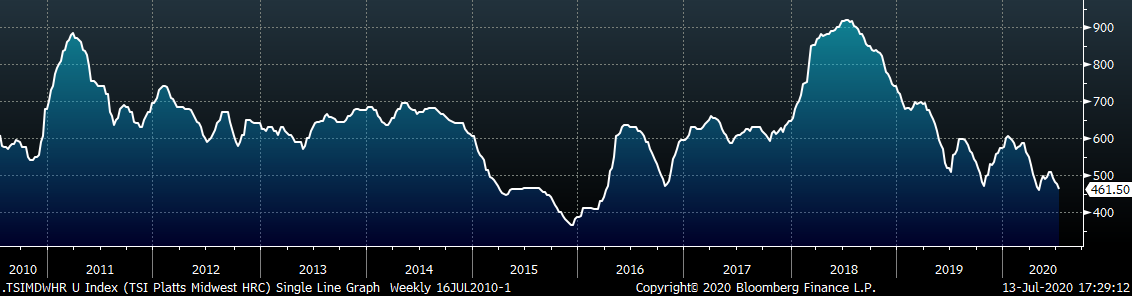
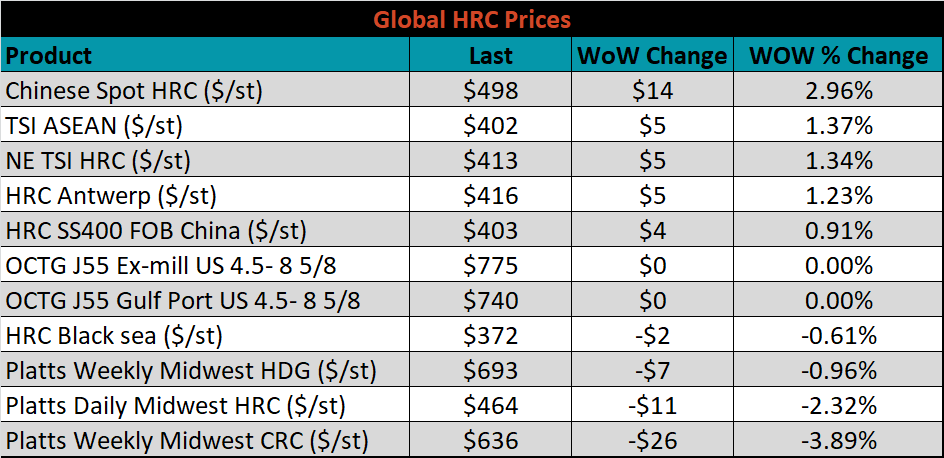
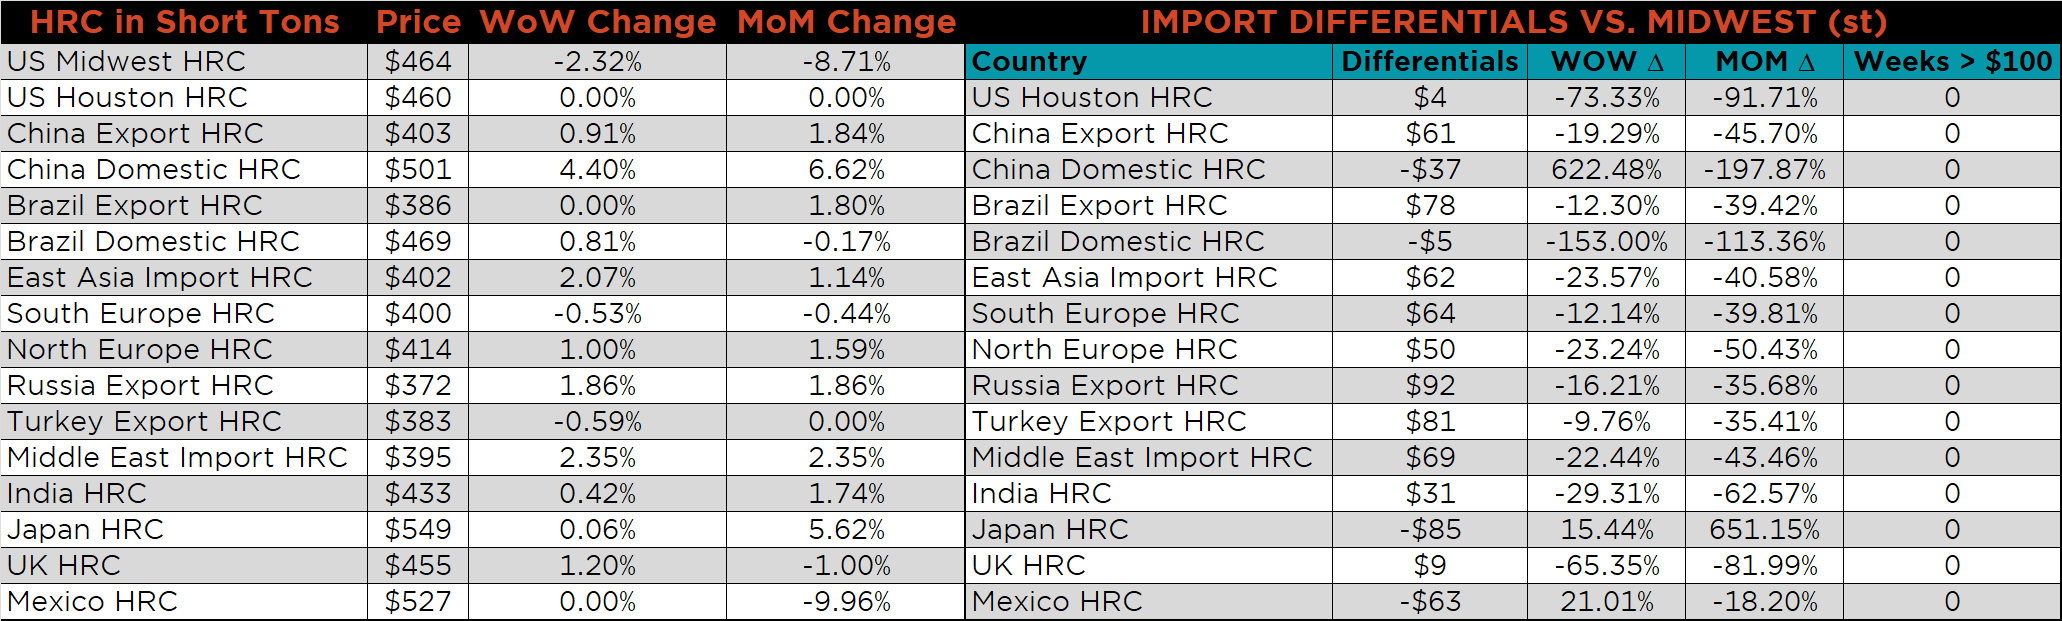
The Platts TSI Daily Midwest HRC Index was down $11 to $464.
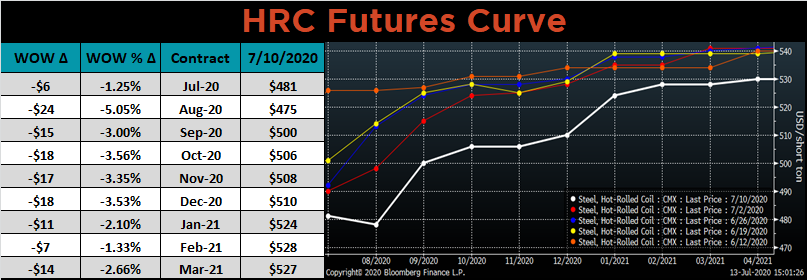
The CME Midwest HRC futures curve is below with last Friday’s settlements in white. Last week the August expiration moved significantly lower and settled below July, while the rest of the curve printed $15 lower.
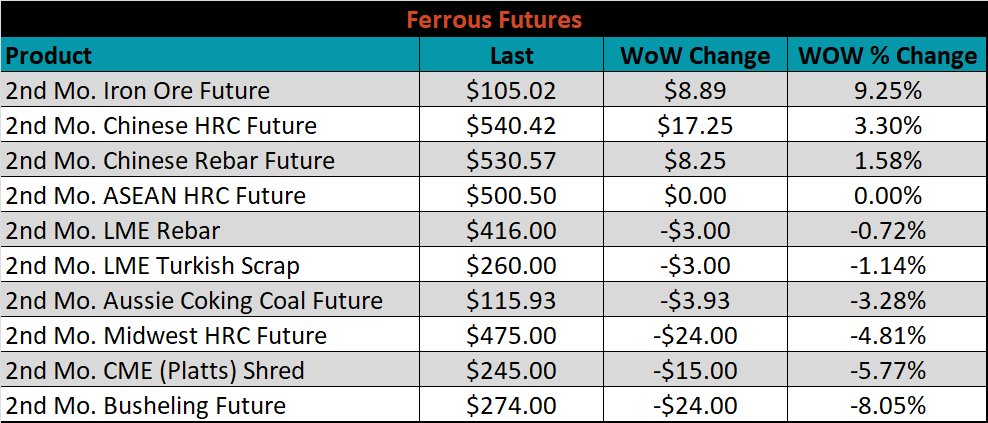
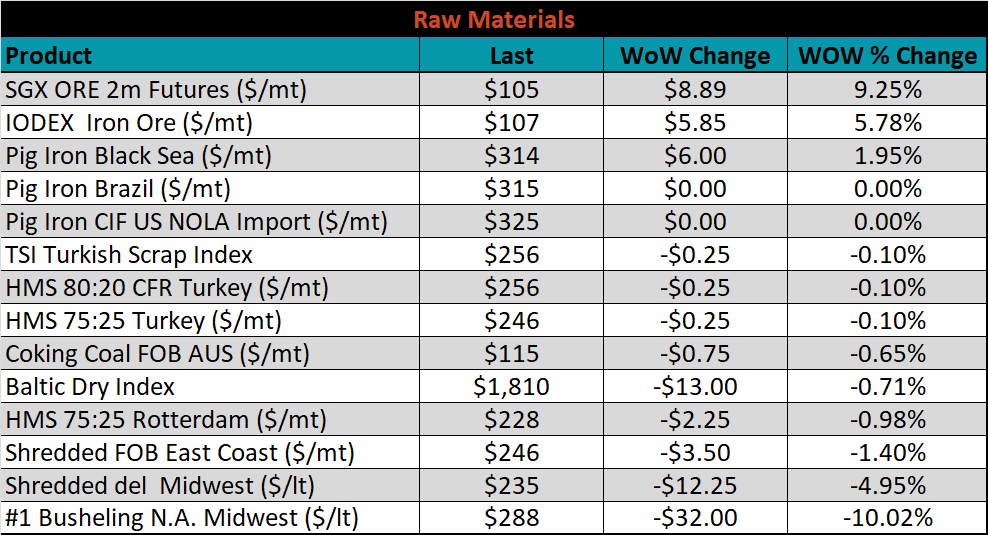
August ferrous futures were mixed. The iron ore future gained 9.3%, while the busheling future lost 8.1%.
The global flat rolled indexes were mixed. Chinese Spot HRC was up 3%, while TSI Platts Midwest CRC was down another 3.9%.
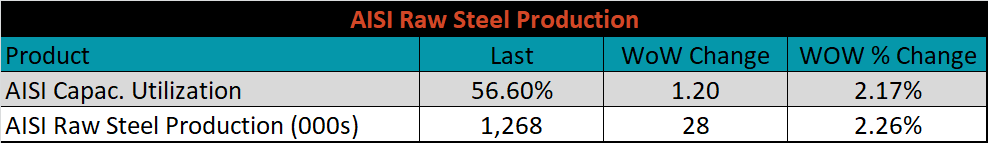
The AISI Capacity Utilization Rate was up another 1.2% to 56.6%.
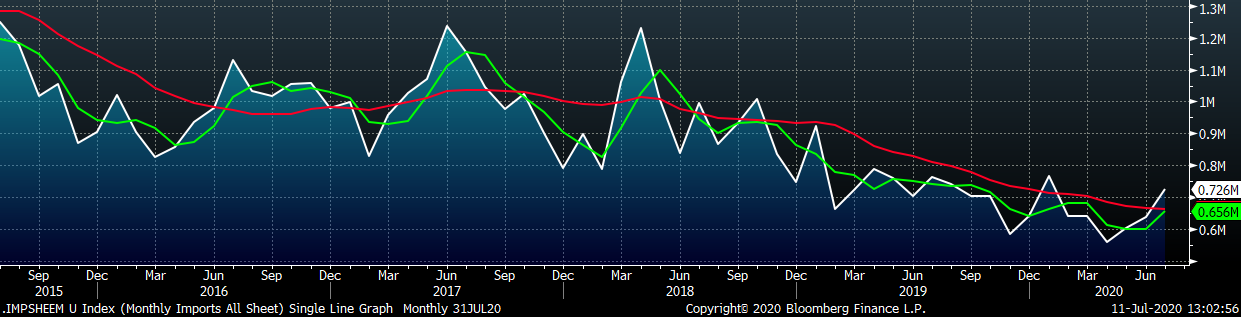
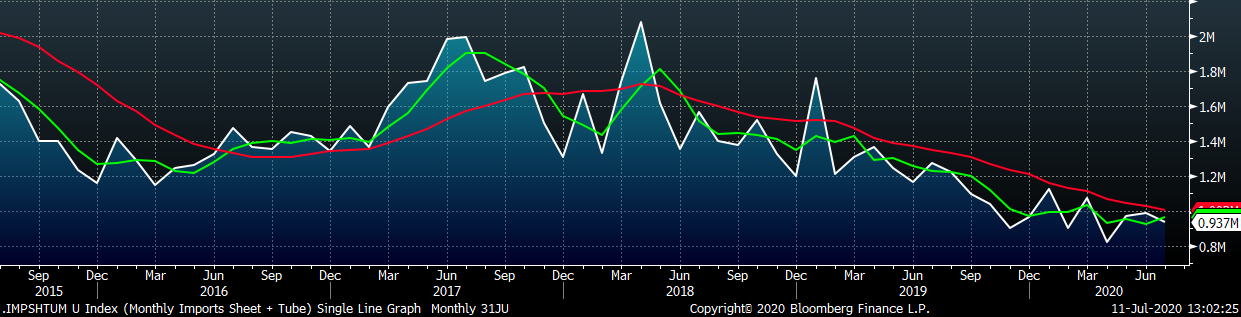
July flat rolled import license data is forecasting an increase of 87k to 726k MoM.
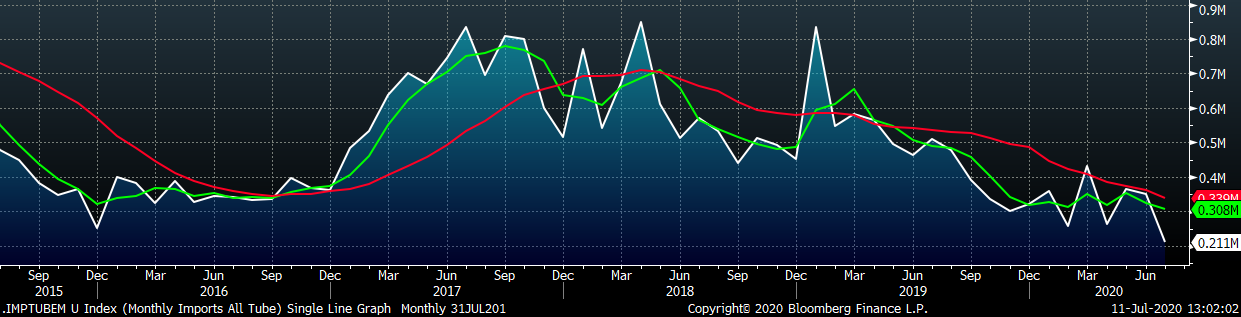
Tube imports license data is forecasting a MoM decrease of 138k to 211k tons in July.
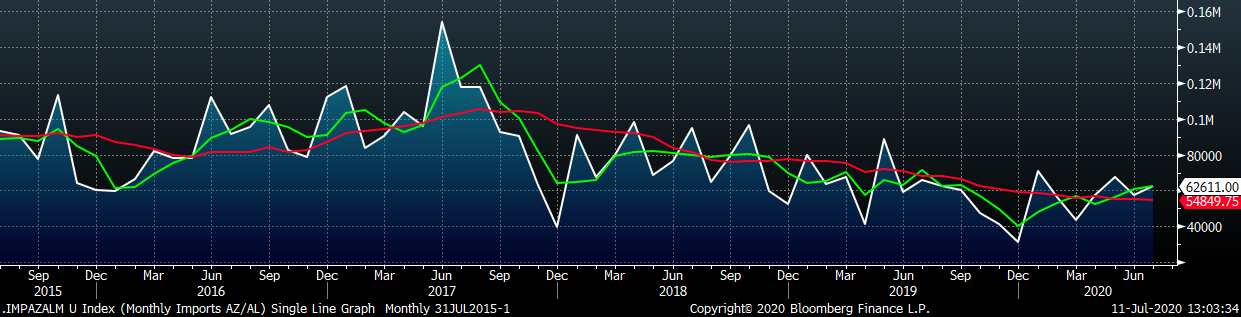
AZ/AL import license data is forecasting an increase of 5k to 63k MoM.
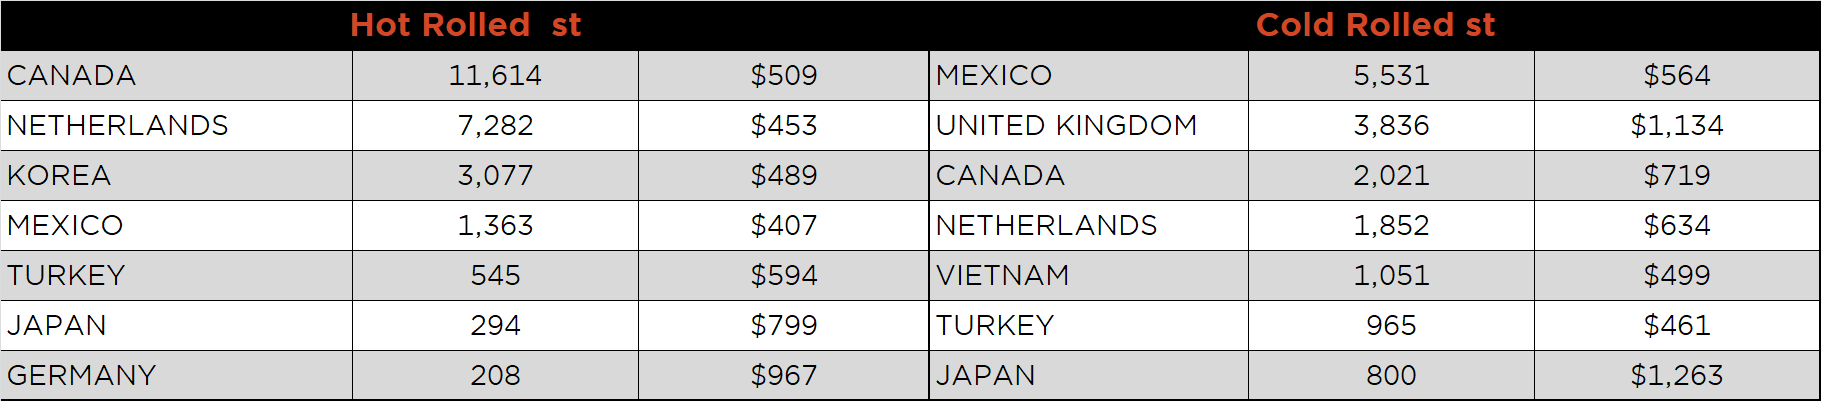
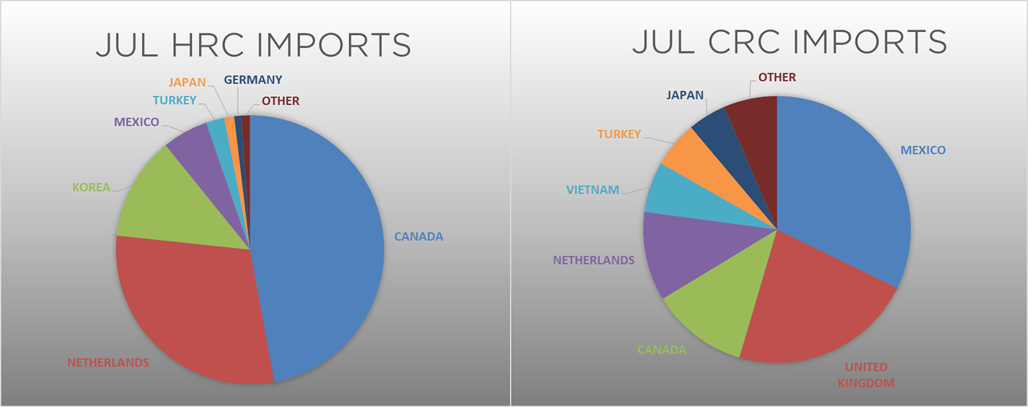
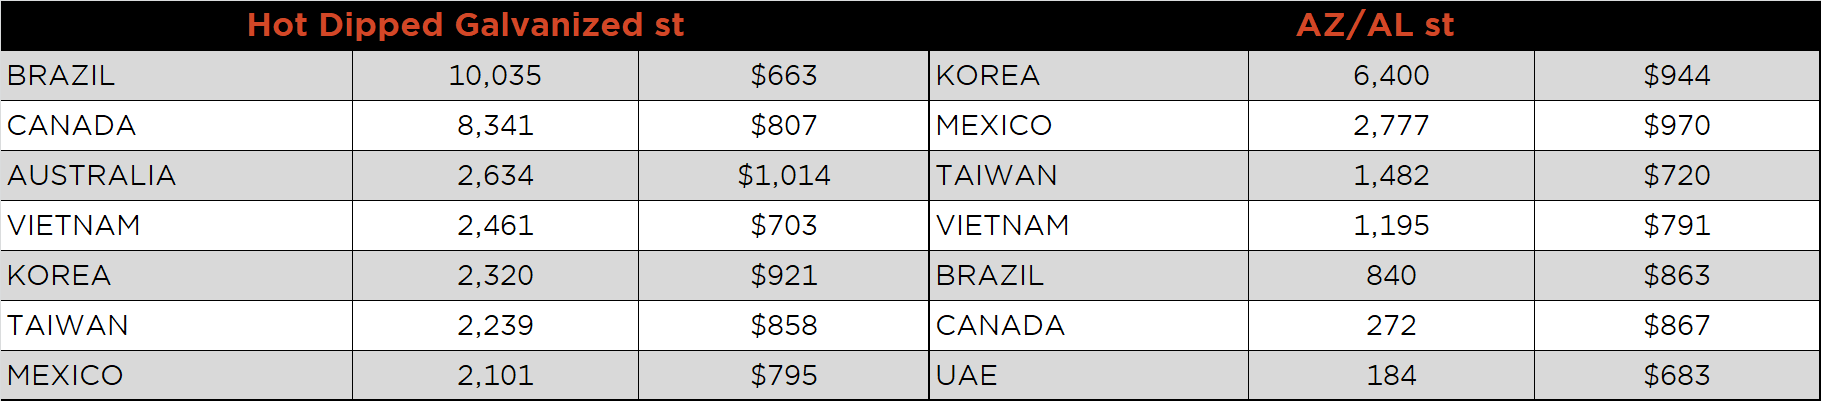
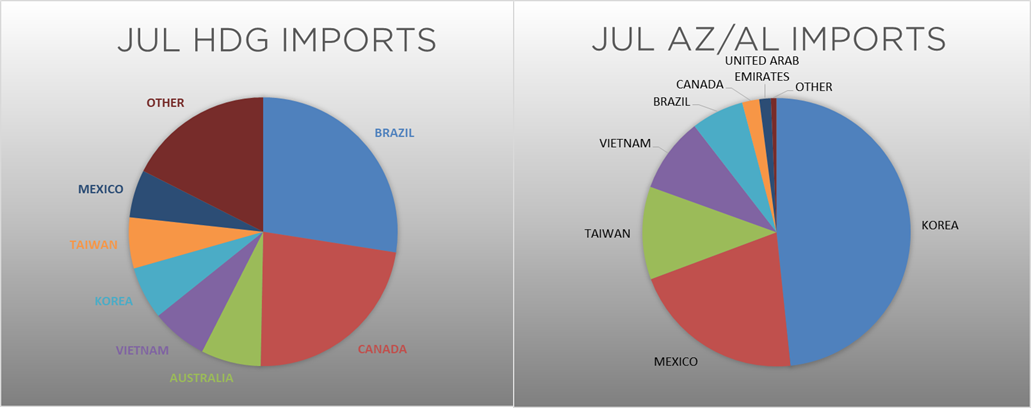
Below is July import license data through July 7, 2020.
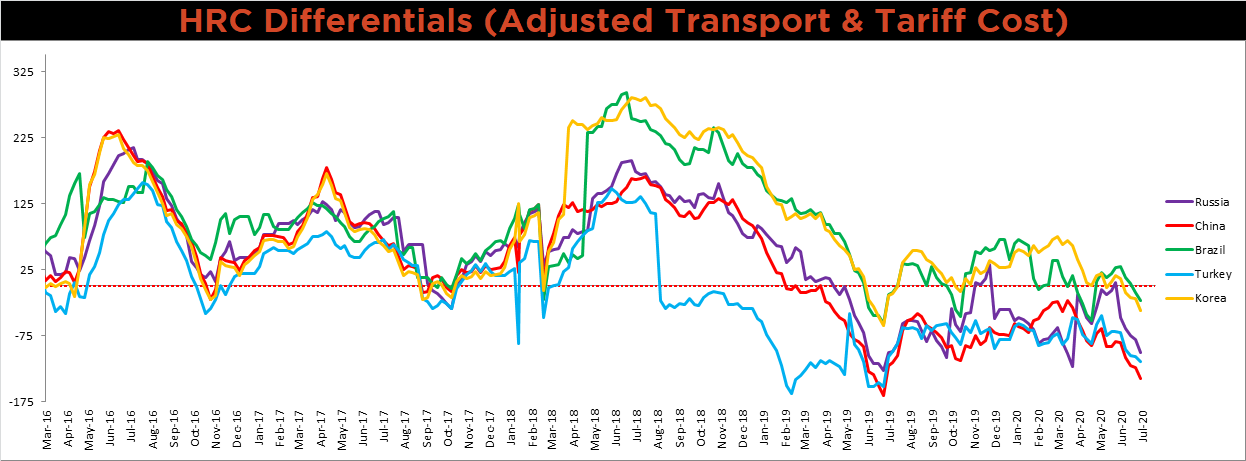
Below is the Midwest HRC price vs. each listed country’s export price using pricing from SBB Platts. We have adjusted each export price to include any tariff or transportation cost to get a comparable delivered price. All the global differentials decreased, as the U.S. price continues to fall more than the five watched countries. Differentials are approaching their lowest levels in the last five years.
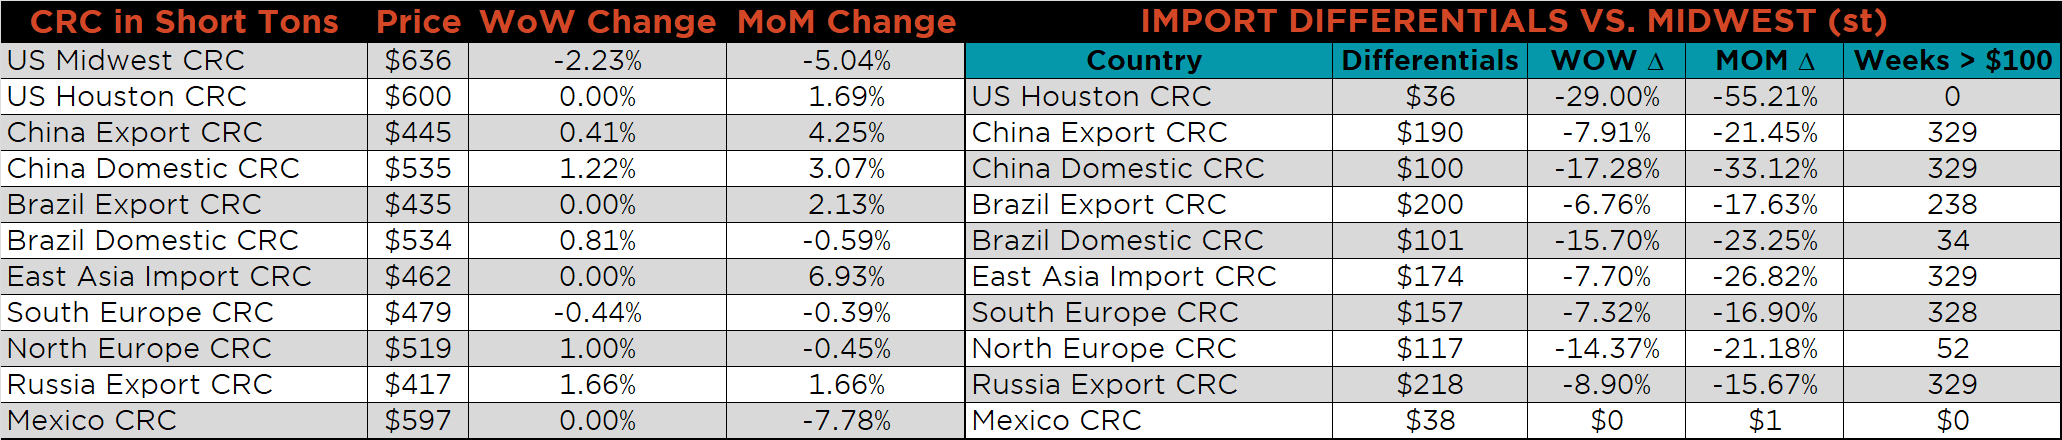
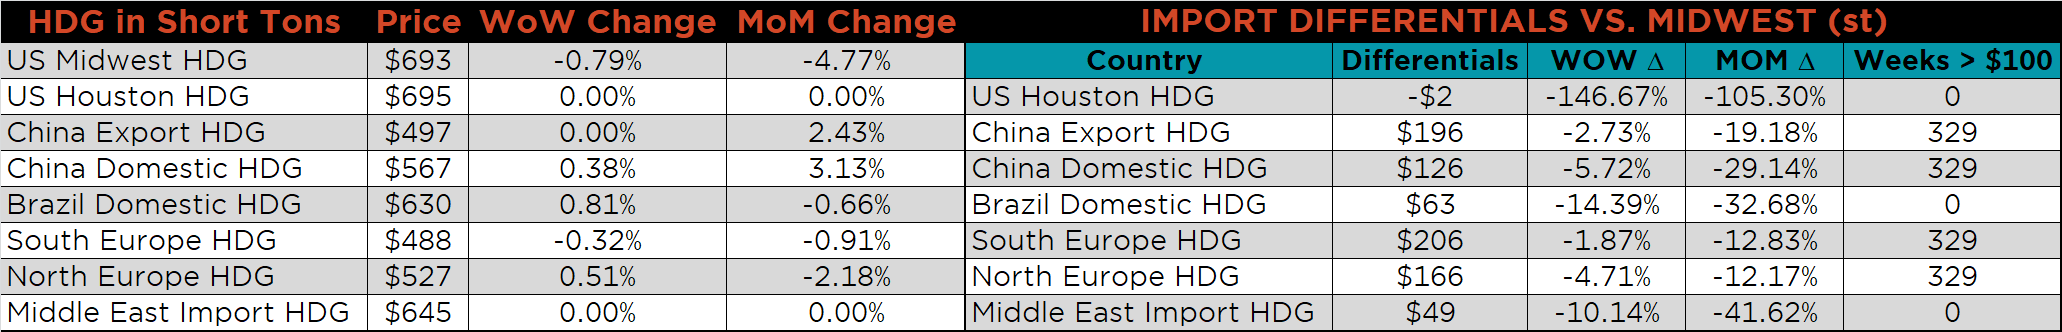
SBB Platt’s HRC, CRC and HDG pricing is below. The Midwest HRC, CRC and HDG prices were down 2.3%, 2.2% and 0.8%, respectively. Globally, the Russian export HRC and CRC prices were up, 1.9% and 1.7%, respectively.
Raw material prices were flat to mixed. The iron ore futures were up 9.3%, while Midwest Busheling was down 10%.
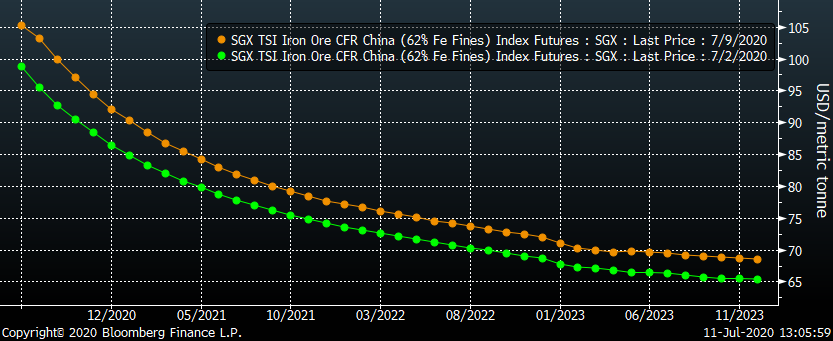
Below is the iron ore future curve with Friday’s settlements in orange, and the prior week’s settlements in green. The entire curve moved higher across all expirations, most significantly in the front.
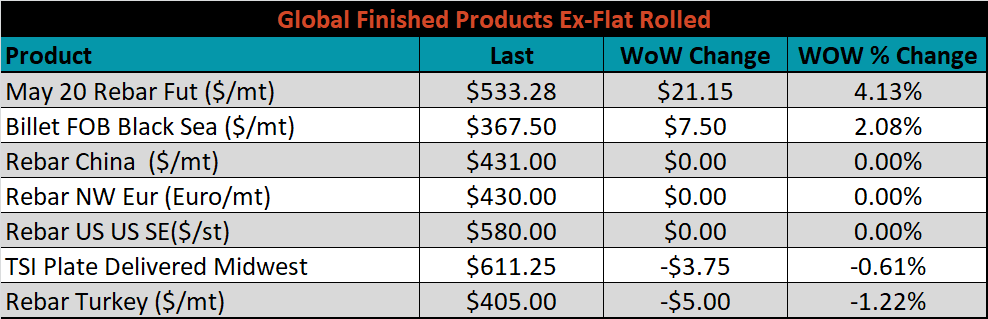
The ex-flat rolled prices are listed below.

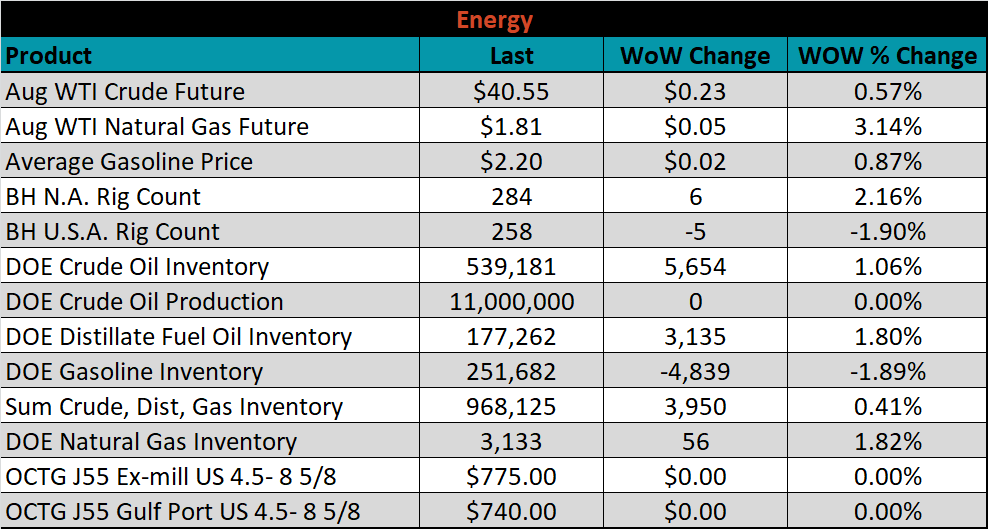
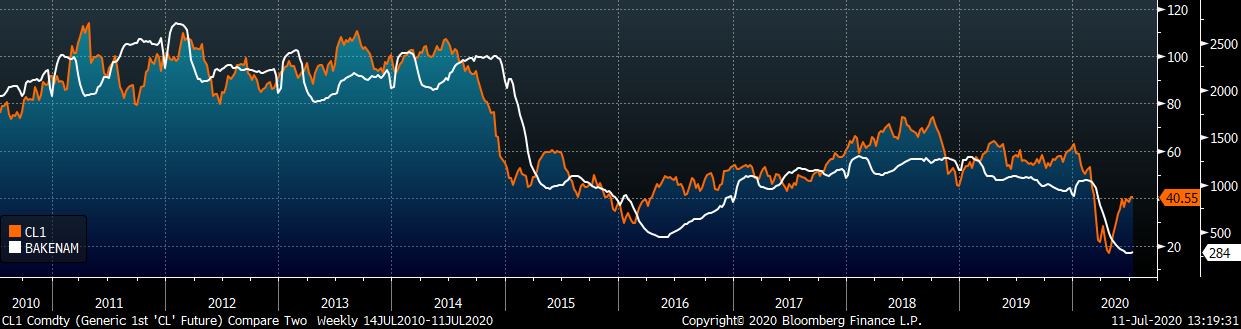
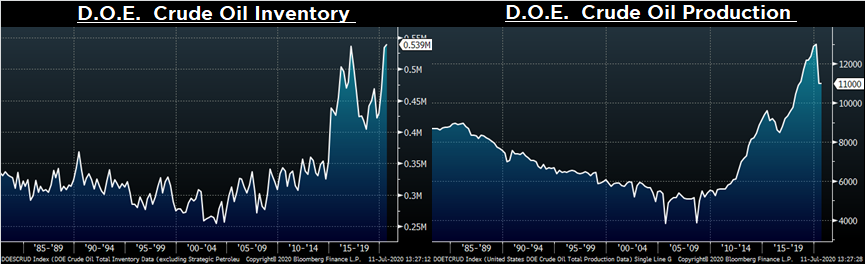
Last week, the August WTI crude oil future gained $0.23 or 0.6% to $40.55/bbl. The aggregate inventory level was up 0.4%, while crude oil production flat at 11m bbl/day. The Baker Hughes North American rig count was up 6, while the U.S. rig count was down another 5 rigs.
The list below details some upside and downside risks relevant to the steel industry. The orange ones are occurring or look to be highly likely. The upside risks look to be in control.
Upside Risks:
Downside Risks: