Content
-
Weekly Highlights
- Market Commentary
- Risks


Last week, conversations around momentum in the physical market intensified, as the limited flow of new information is interpreted as signals by both bulls and bears. For bulls, steel prices continue to push into rarified air, with no real evidence of additional spot ton availability or overall diminished demand. Bearish commentary within the market is coming from the recognition that fewer overall downstream participants are willing to buy steel at any price. Our view is that this is occurring because they believe the rally is over and lower prices are coming soon, or because they will not be able to pass on the current elevated price. What will it mean if companies are not willing to fully restock to previous inventory levels? Plainly, if the majority of buyers choose to operate with lighter inventories, supply and demand equilibrium will happen earlier than if they choose to restock. Assuming no major supply or demand disruptions occur, price momentum would likely slow, peak and eventually start moving lower. However, there is a thin line between choosing not to restock and not being able to restock. The dynamic that caused a 300% increase to HRC prices since August was demand outpacing limited supply. If these reluctant buyers do not have the material they need to support their business, prices will go higher when they are forced back into the marketplace to secure that material.
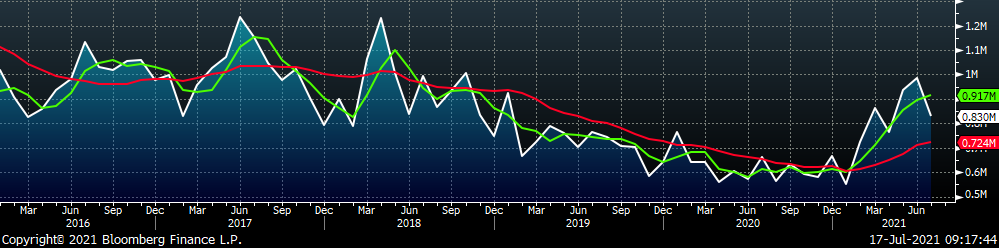
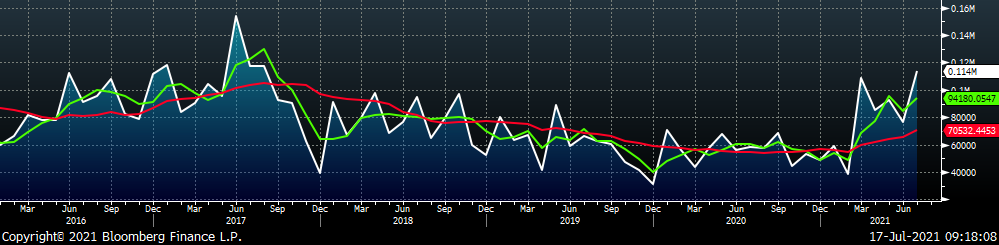
Even with record levels of profitability, mills clearly believe they have been hamstrung by last year’s contracts and are entering 2022 negotiations with more leverage than ever before. Evidence of this is the Mill Fill Index – tonnage per month that service centers must purchase from domestic mills – shown below.
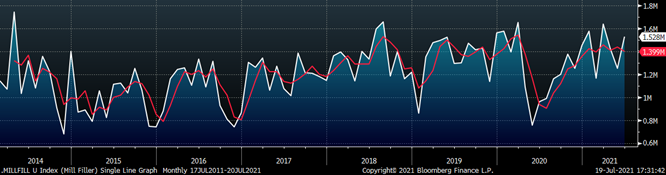
In June, the index rebounded nearing its historical high levels. Import levels continue to push higher, but service center inventories and shipments are growing at a faster rate, spurring demand at domestic mills. The 3-month average (red) has been above the historical average since December. This highlights the fact that mills remain well in control of the pricing dynamics within the domestic market.
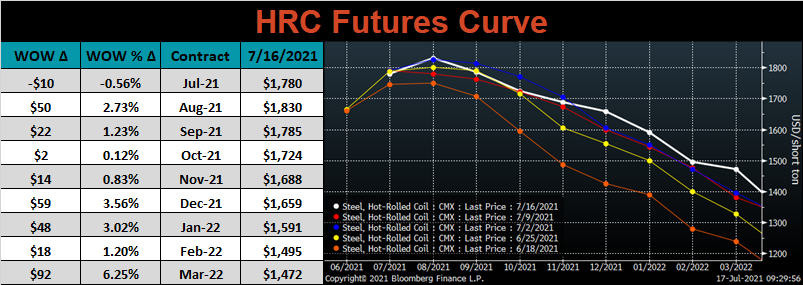
The chart below compares the futures curve from one month ago on June 18th (green) and the curve from July 16th (orange).
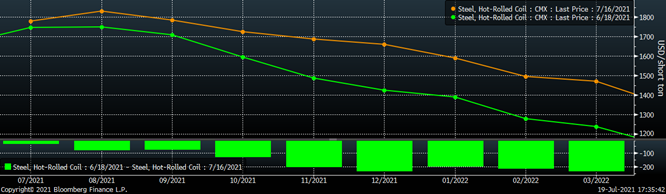
In the June 11, WoW report, we detail how we interpret the HRC curve where contango suggests a surplus and backwardation, a shortage. With that in mind, the flattening of the curve can be interpreted as the overall market believing we are moving closer to equilibrium. If you are holding out to wait for lower prices, supply and demand equilibrium might make you feel comfortable with your decision. At this point, we would advise against that interpretation. The fact that the curve is flattening due to upward pressure in the back rather than downward pressure in the front is a tacit acceptance of higher for longer HRC prices. There is currently an estimated $450 discount compared to current spot for 2022 pricing and our bullish perspective on demand remains intact.
Below are the most pertinent upside and downside price risks:
Upside Risks:
Downside Risks:
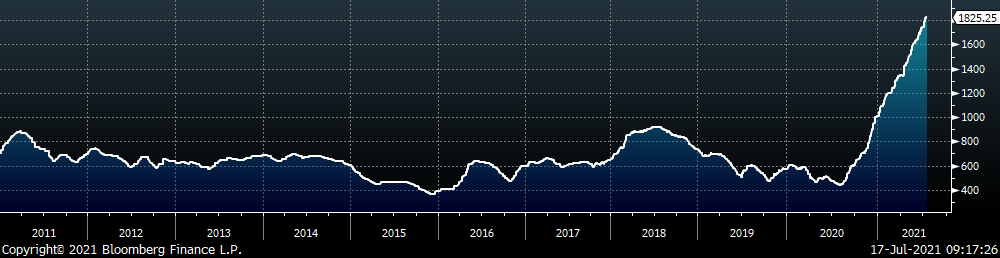
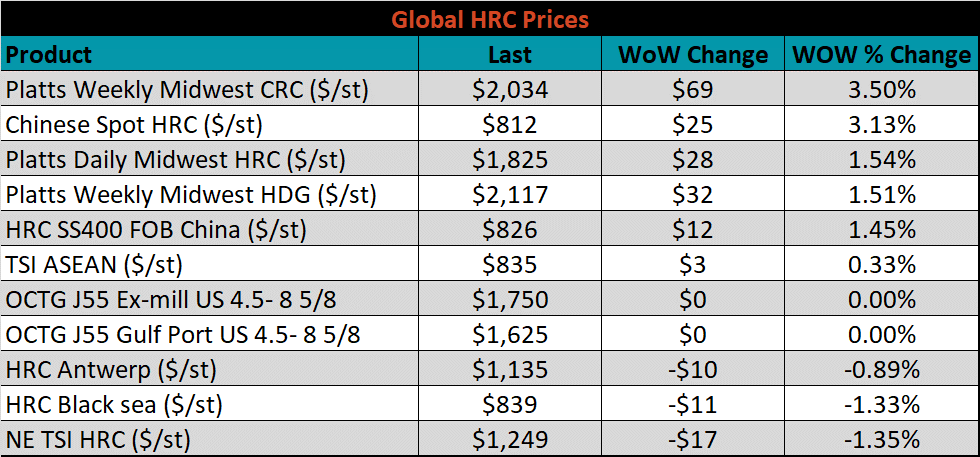
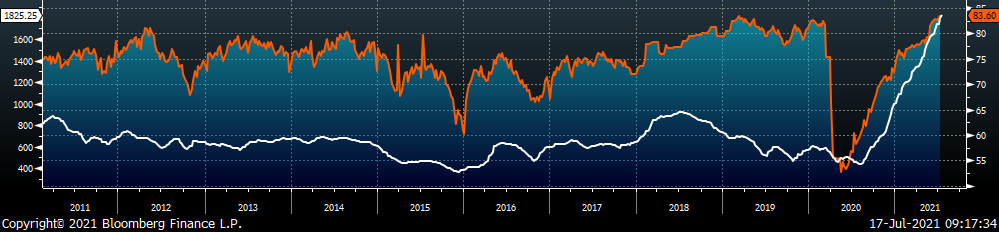
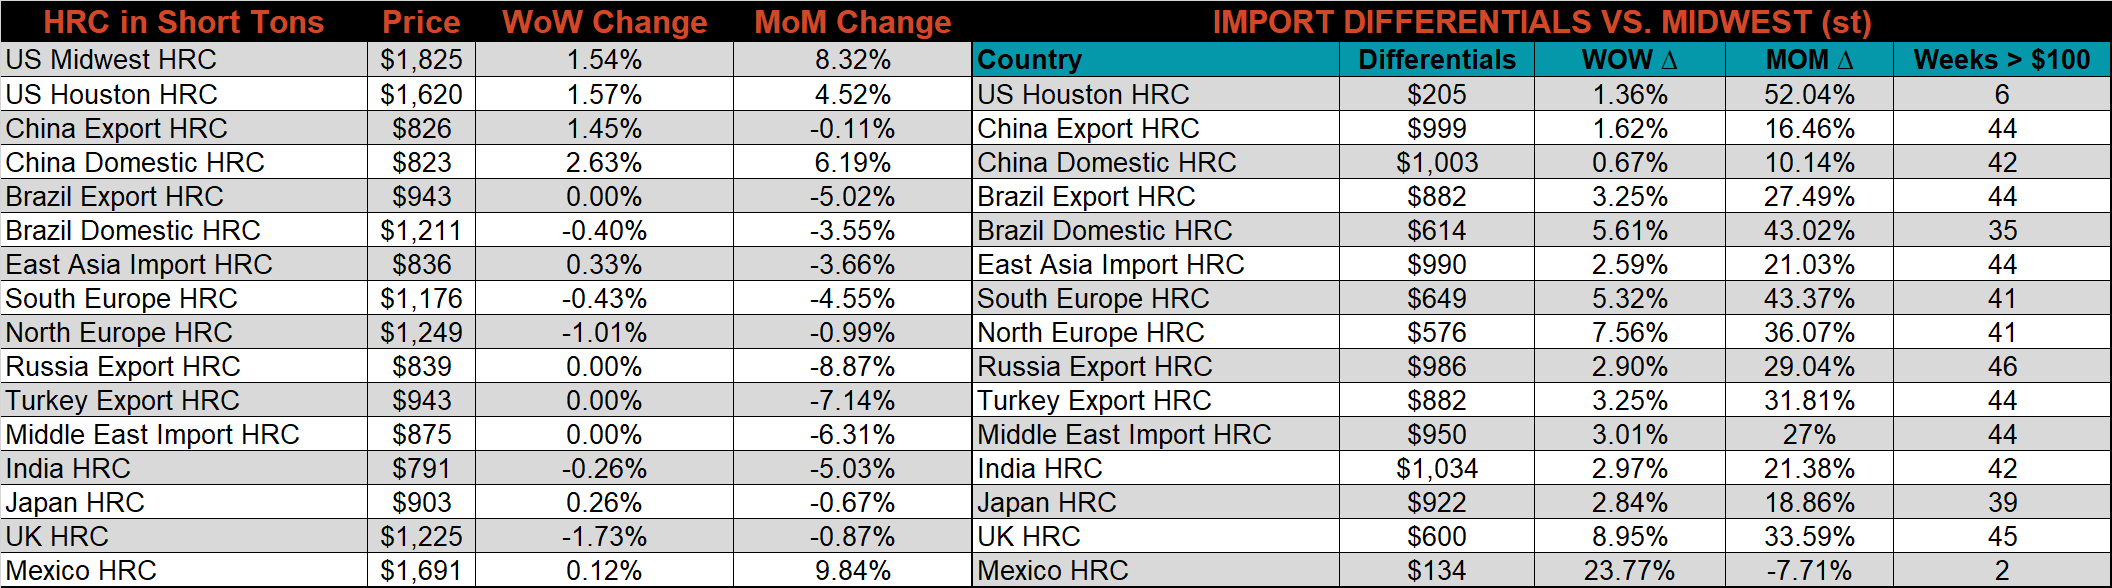
The Platts TSI Daily Midwest HRC Index increased by $27.75 to $1,825.25.
The CME Midwest HRC futures curve is below with last Friday’s settlements in white. Last week, the entire curve shifted higher, most significant in later months, leading to an overall flattening at higher prices.
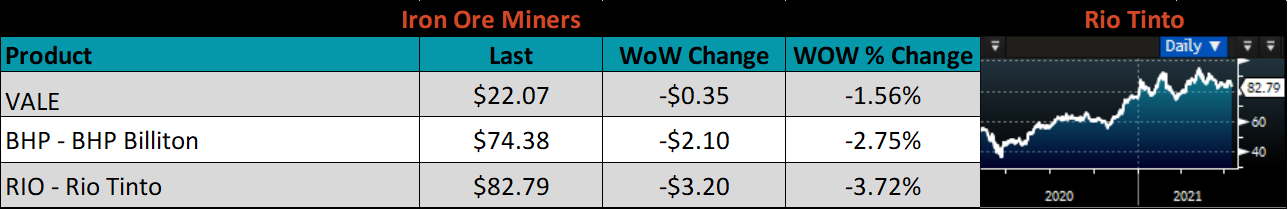
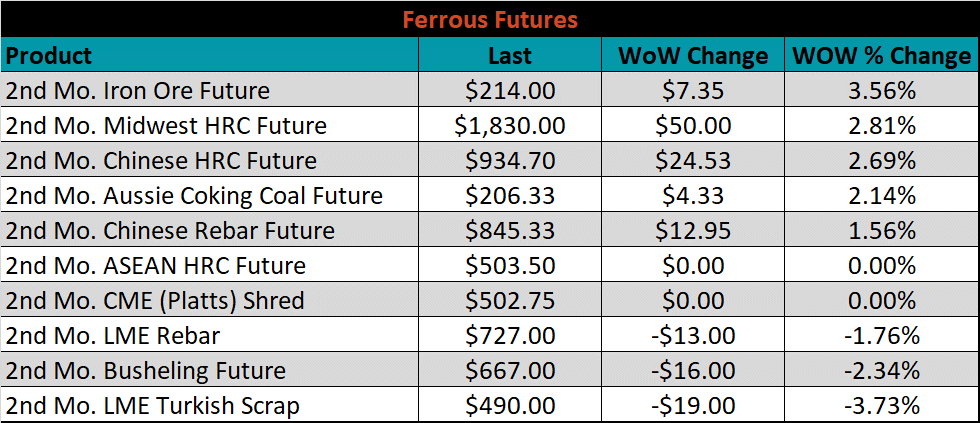
August ferrous futures were mixed. Iron ore gained 3.6%, while Turkish scrap was down another 3.7%.
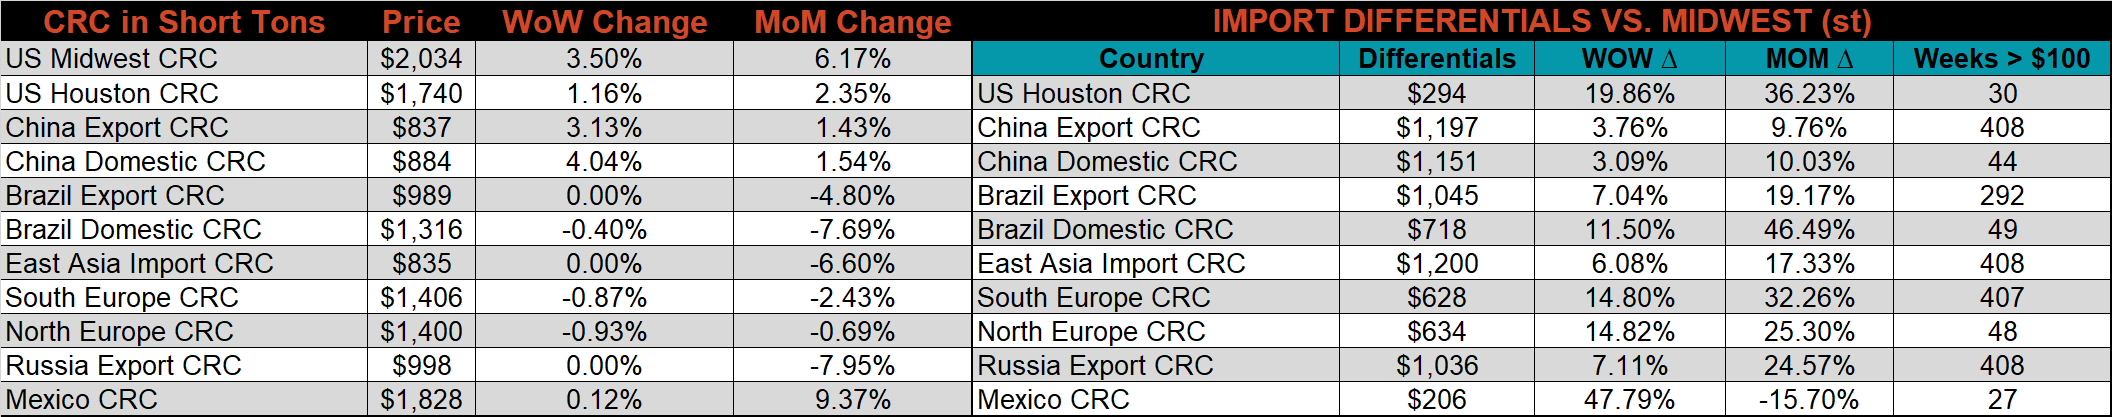
Global flat rolled indexes were mixed. TSI Platts Midwest CRC was up 3.5%, while the Northern European HRC price was down 1.4%.
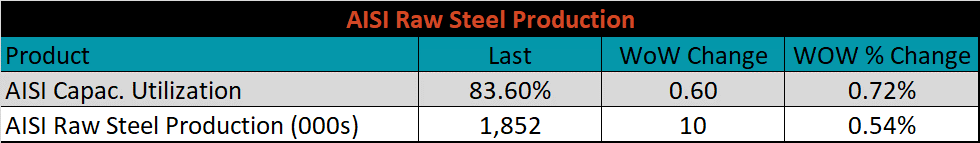
The AISI Capacity Utilization rate increased 0.6% to 83.6%.
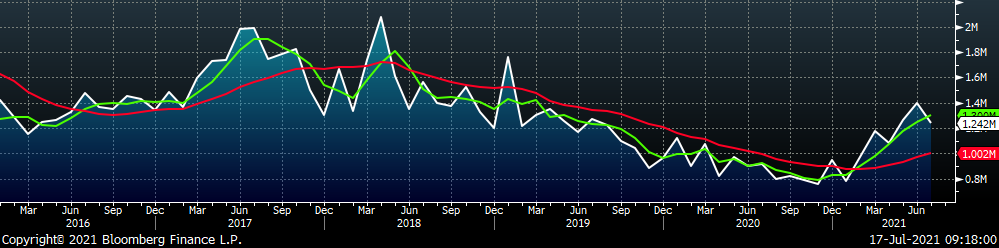
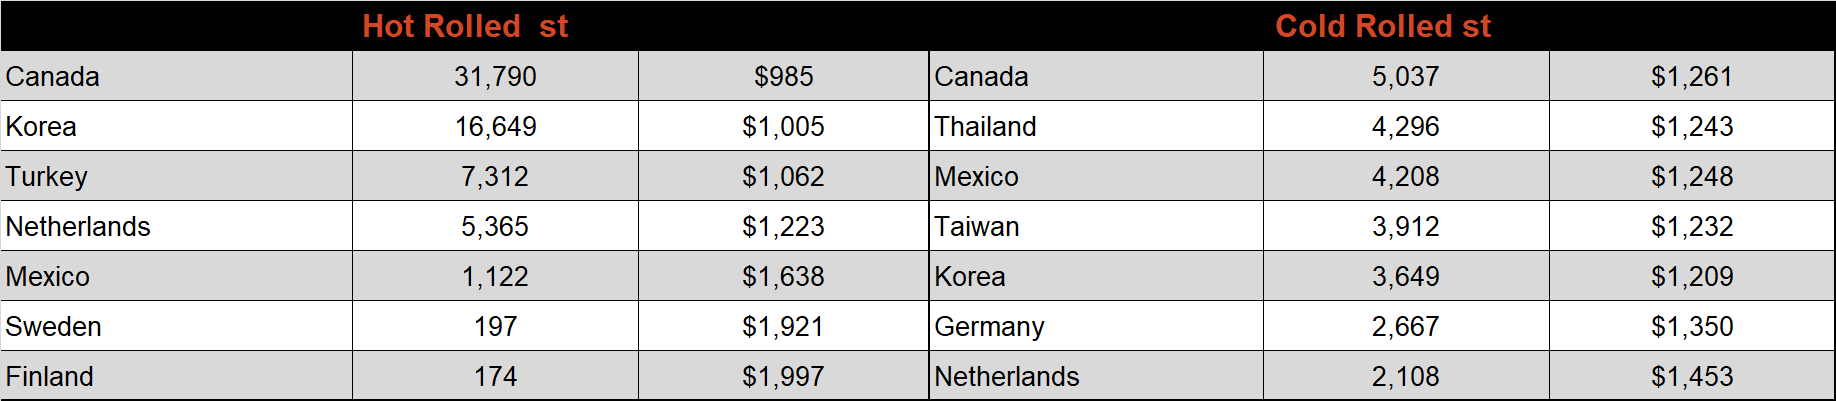
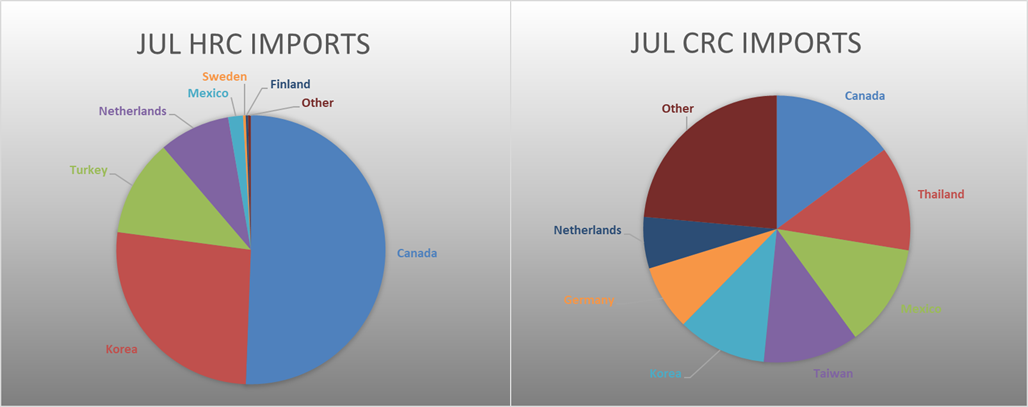
July flat rolled import license data is forecasting a decrease of 155k to 830k MoM.
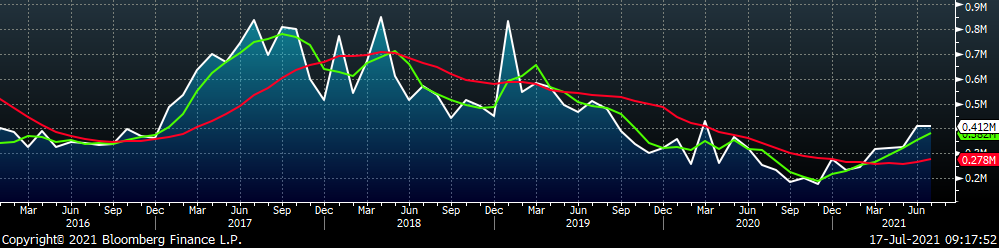
Tube imports license data is forecasting an increase of 3k to 412k in June.
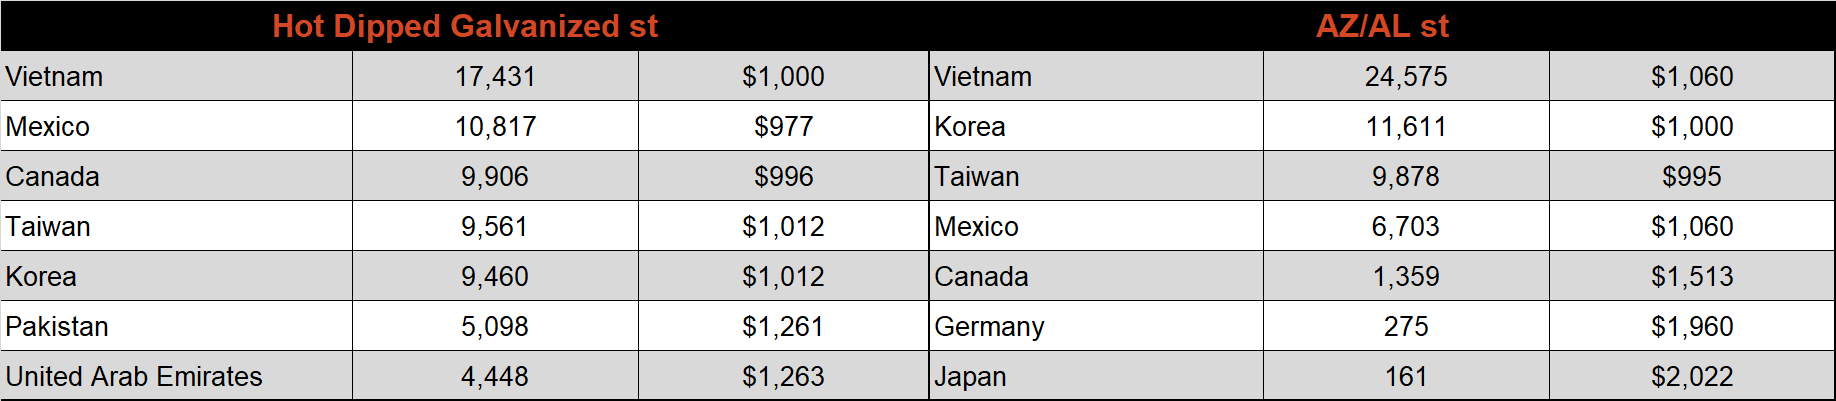
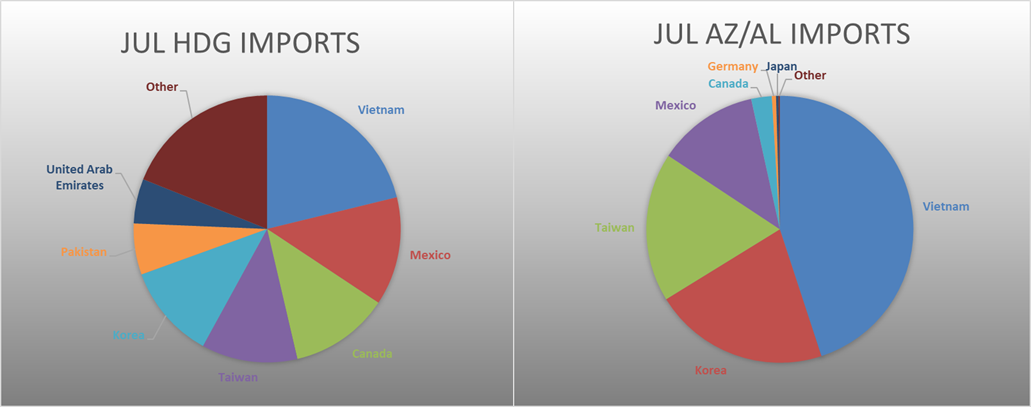
June AZ/AL import license data is forecasting an increase of 38k to 114k.
Below is July import license data through July 12th, 2021.
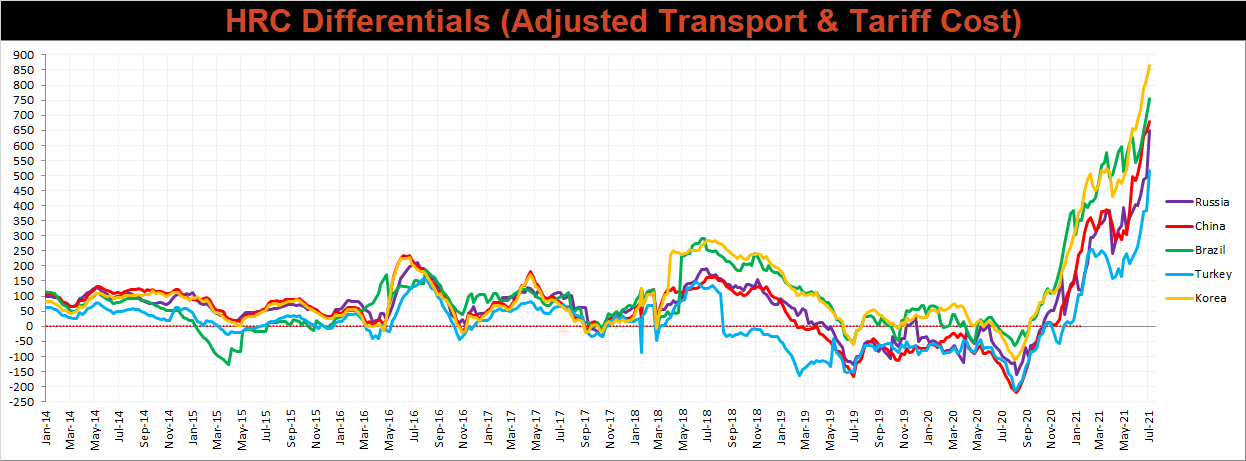
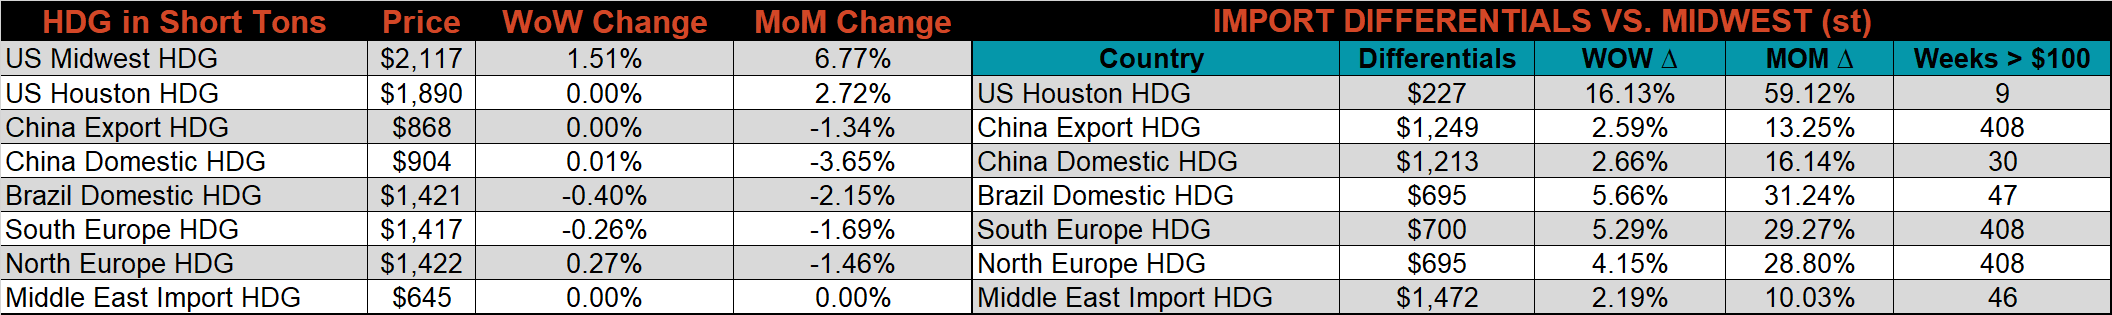
Below is the Midwest HRC price vs. each listed country’s export price using pricing from SBB Platts. We have adjusted each export price to include any tariff or transportation cost to get a comparable delivered price. Differentials for all watched countries continued to increase, as the Midwest HRC price remains the strongest, globally.
SBB Platt’s HRC, CRC and HDG pricing is below. The Midwest CRC, HRC, & HDG prices were up, 3.5%, 1.5% and 1.5%, respectively. Globally, the Chinese domestic CRC price was up 4%.
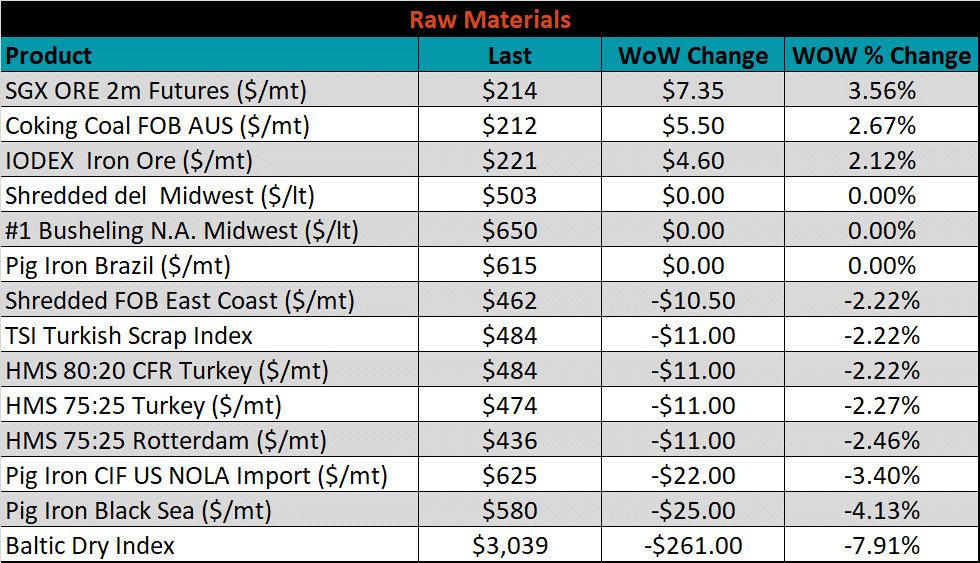
Raw material prices were mixed, with iron ore futures up 3.6%, while Black Sea pig iron was down 4.1%.
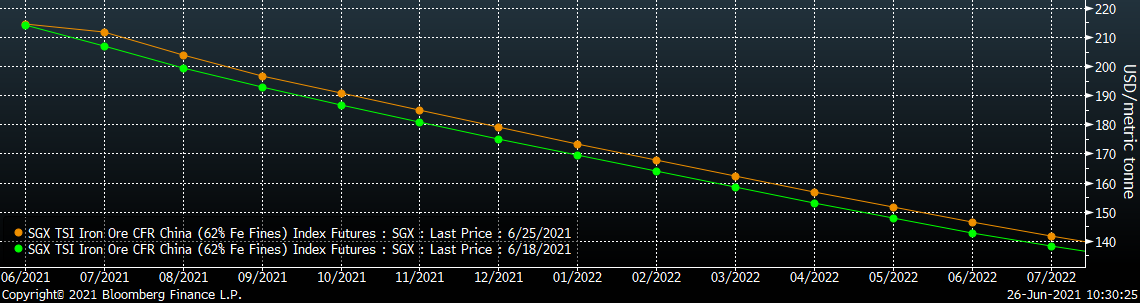
Below is the iron ore future curve with Friday’s settlements in orange, and the prior week’s settlements in green. Last week, the entire curve shifted higher.
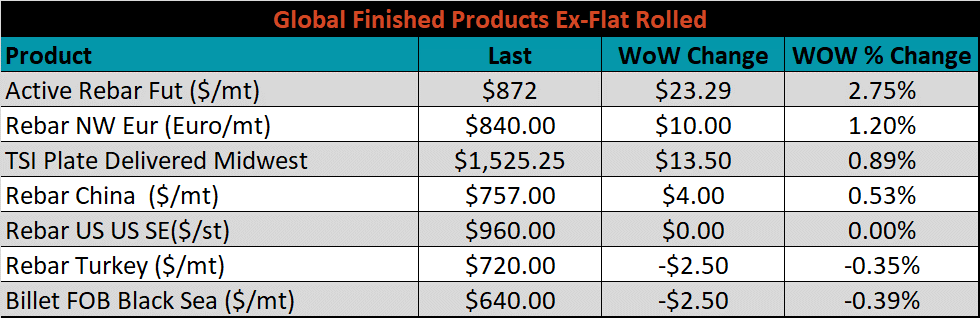
The ex-flat rolled prices are listed below.

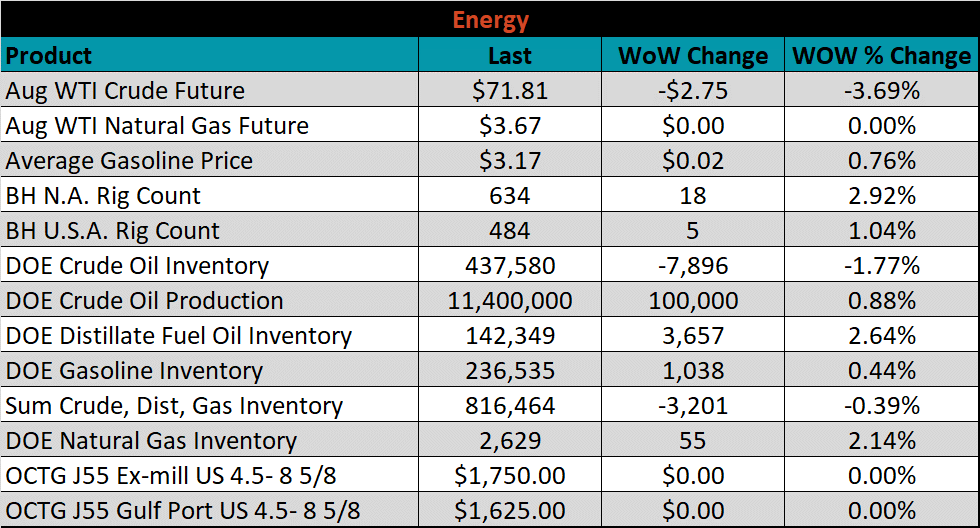
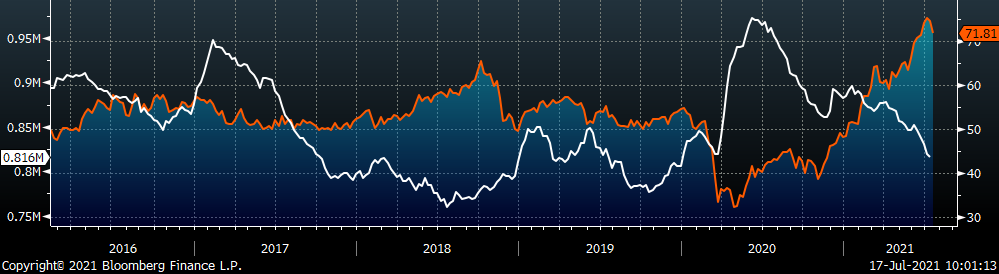
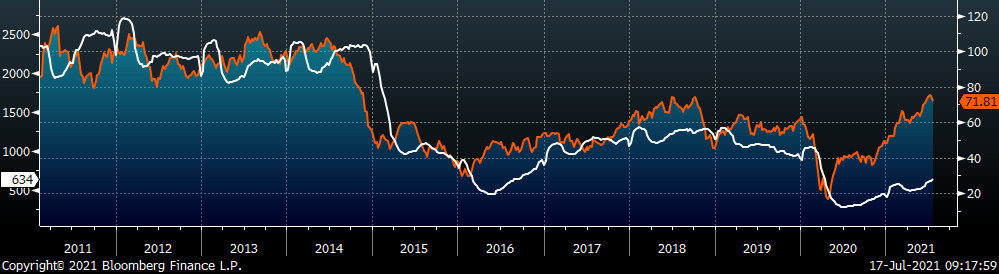
Last week, the August WTI crude oil future was down $2.75 or 3.7% to $71.81/bbl. The aggregate inventory level was down 0.4%, and crude oil production rose to 11.4m bbl/day. The Baker Hughes North American rig count was up 18 rigs, and the U.S. rig count was up 5 rigs.
The list below details some upside and downside risks relevant to the steel industry. The orange ones are occurring or look to be highly likely. The upside risks look to be in control.
Upside Risks:
Downside Risks: