Content
-
Weekly Highlights
- Market Commentary
- Risks


While the same narrative continues to drive the spot HRC market – few transactions and prices drifting lower – there have been new headlines over the past week that may cause some to rethink their outlook. Last Thursday morning, there was an explosion and fire at ArcelorMittal’s Burns Harbor mill, forcing the company to take down blast furnace D. This week, US Steel announced a $40/t price increase on flat-rolled products, which was followed by other integrated producers. While understanding the effects of each event on the spot market price will take time, the forward curve reacted by pushing higher, after the prior weeks’ large declines in the curve. In this week’s report, we will dissect the forward curve movements over the last month to determine if this week’s move higher is sustainable.
For most of the month of June, the liquid portion of the forward curve remained in the same $5-10 range at each expiration. As spot prices peaked and started to decline, the back end of the curve was essentially unchanged each week. The below chart shows CME future curve over the past 7 weeks, with each line corresponding to the weekly settlement prices at each expiration. Last week’s curve is in white.
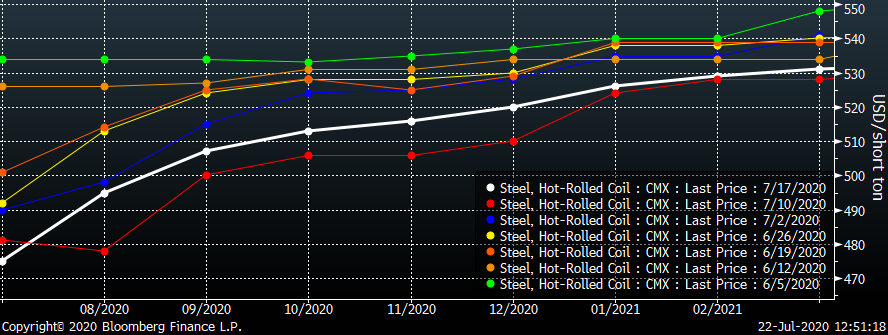
Often, small movements in the prices on the curve indicate a lack of buying and selling interest, which tends to happen as activity in the physical market slows. However, in June when the forward curve was little changed, there was an increase in volume traded in the paper market – averaging over 15,000 tons per day. This indicates that there was ample liquidity allowing market participants to initiate positions on the curve with ease and with little effect on price. For those with inventory on hand or on order, they could sell futures to protect the value of their material. For those looking to lock in future buy prices or wager on further price recovery as the economy restarted, they bought on the curve and positioned for price rally in the fourth quarter and first quarter of next year. The amount of buying and selling offset, leaving prices in a range.
This month volumes have declined to an average of 6,300 tons per day, which was more in line with expectations due to quiet physical market. However, during this time of lower volumes, the forward curve prices moved significantly. The white, red and blue lines in the chart above represent the past 3 weeks, respectively, showing two weeks of large declines, followed by a small rally last week. The headlines discussed above spurred the curve to move higher over the past week, but the lack of volume as forward prices rallied indicates fewer sellers in the market rather than high conviction buying. Most market participants who would otherwise have been interest in selling the curve at current levels had opportunities to sell significant volumes at much better prices only three weeks ago. If they covered all of their physical exposure with short futures, they do not need additional hedges at lower prices until their positions are closed or expire. Therefore, we place less weight on the curve rallying last week compared to the inventory overhang discussed in this report last week.
Below are the most pertinent upside and downside price risks:
Upside Risks:
Downside Risks:
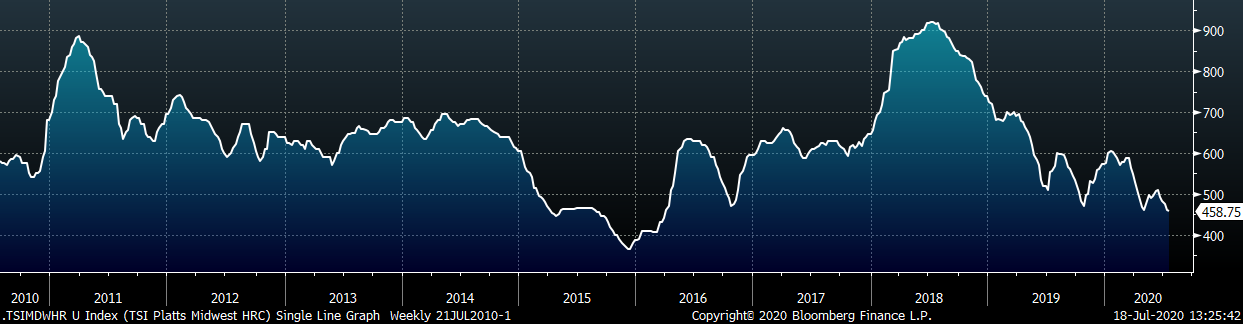
The Platts TSI Daily Midwest HRC Index was down $5.25 to $458.75.
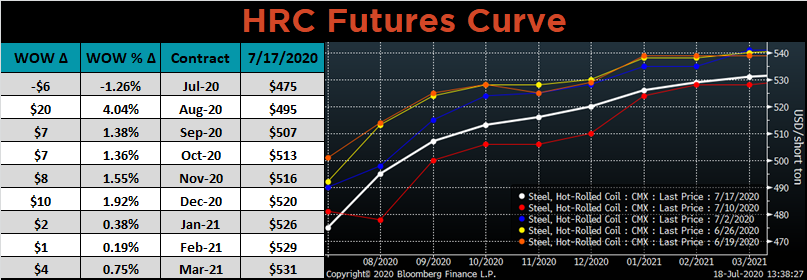
The CME Midwest HRC futures curve is below with last Friday’s settlements in white. Last week, all the 2020 expirations moved higher, led by August which jumped $20.
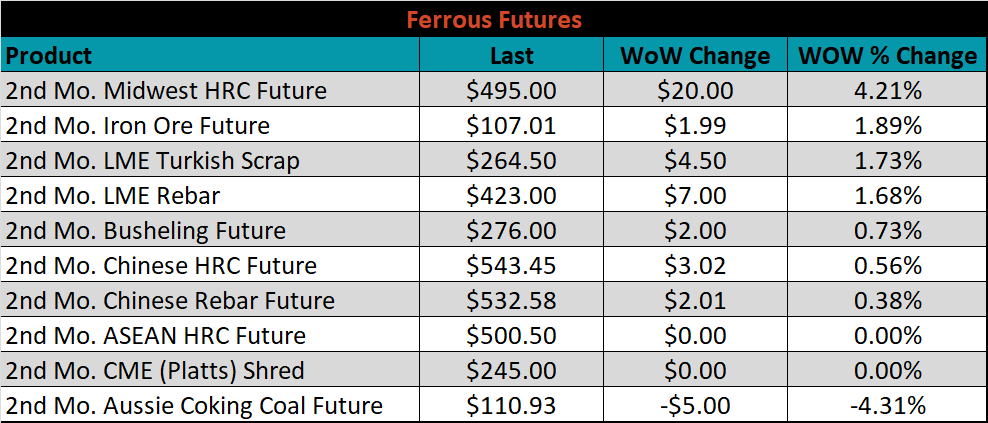
August ferrous futures were mostly higher, led by Midwest HRC, which gained 4.2%, while the Aussie coking coal future lost 4.3%.
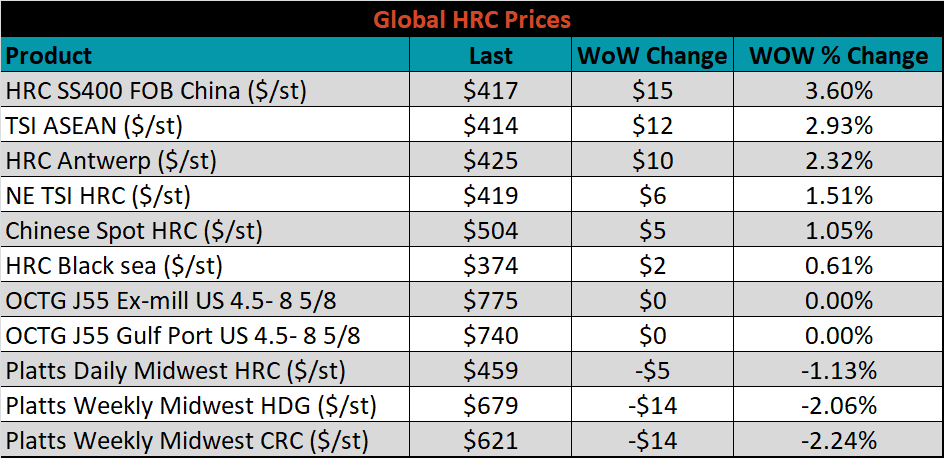
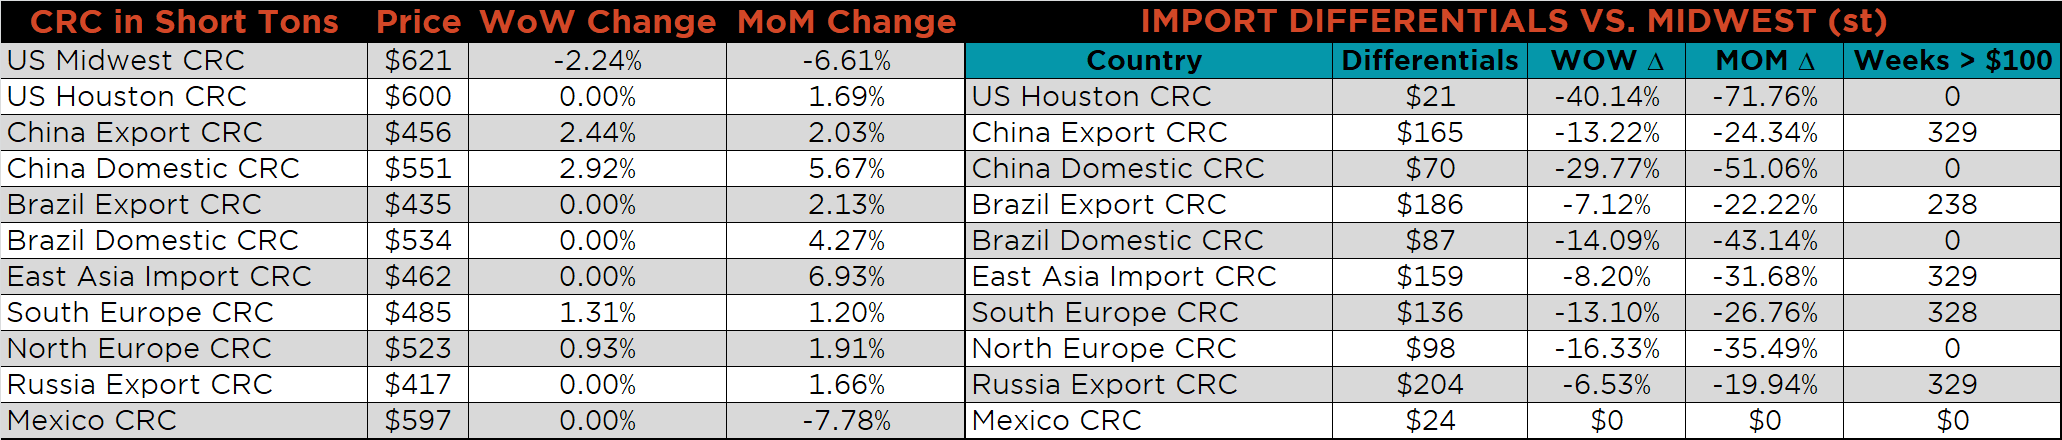
The global flat rolled indexes were mixed. The Chinese export HRC price was up 3.6%, while TSI Platts Midwest CRC was down another 2.2%.
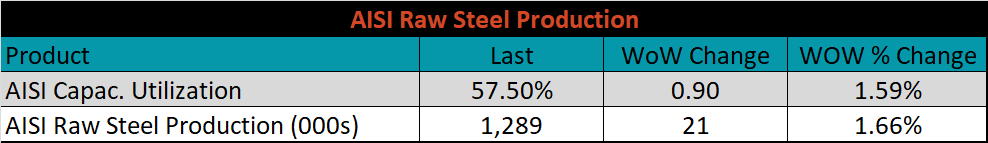
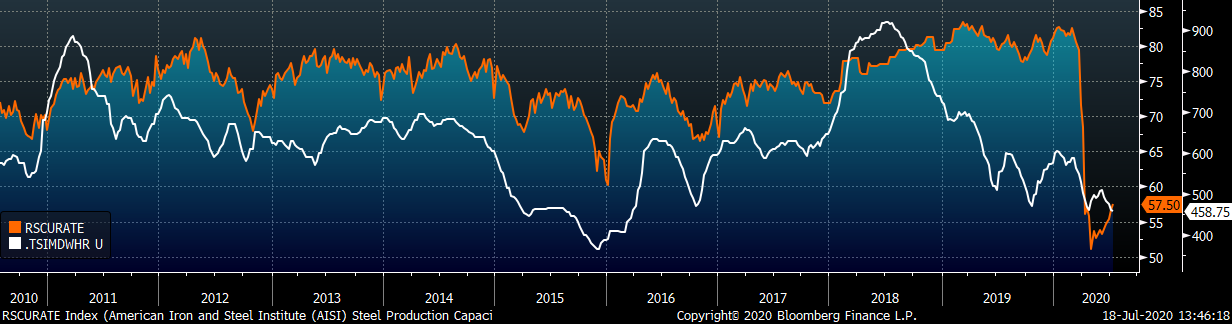
The AISI Capacity Utilization Rate was up another 0.9% to 57.5%.
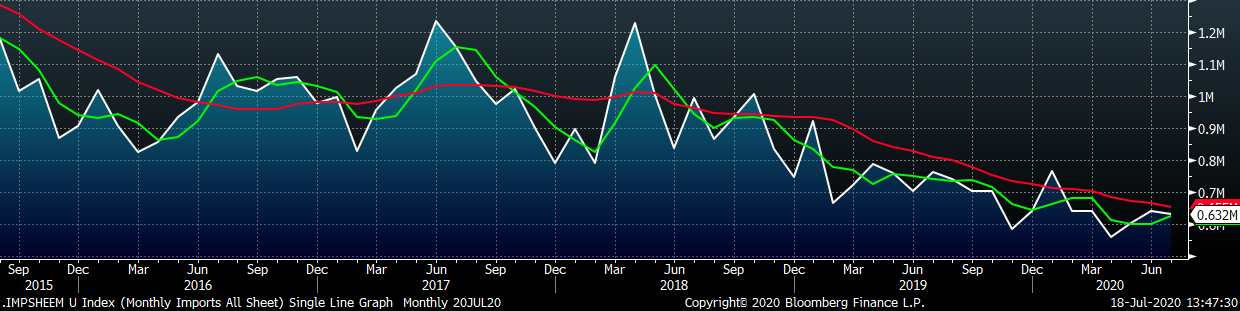
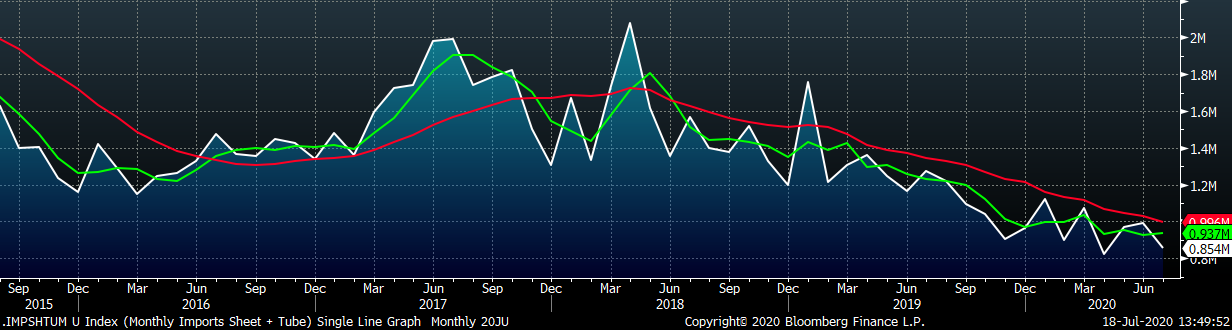
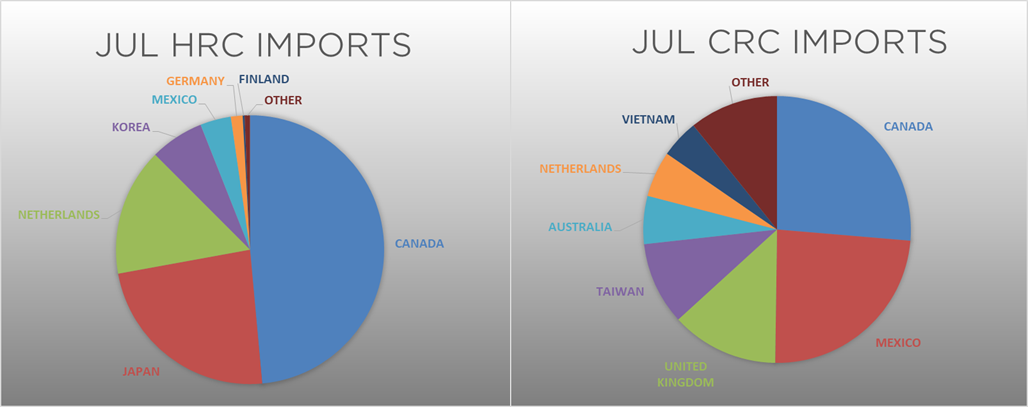
July flat rolled import license data is forecasting a decrease of 9k to 632k MoM.
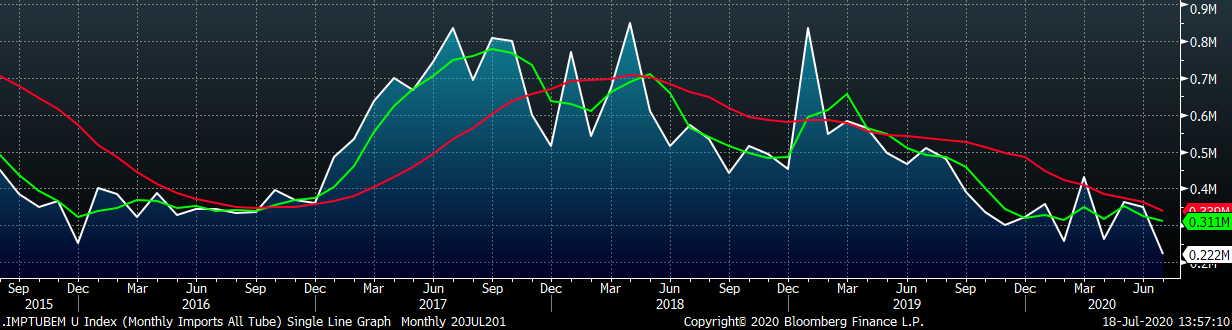
Tube imports license data is forecasting a MoM decrease of 127k to 222k tons in July.
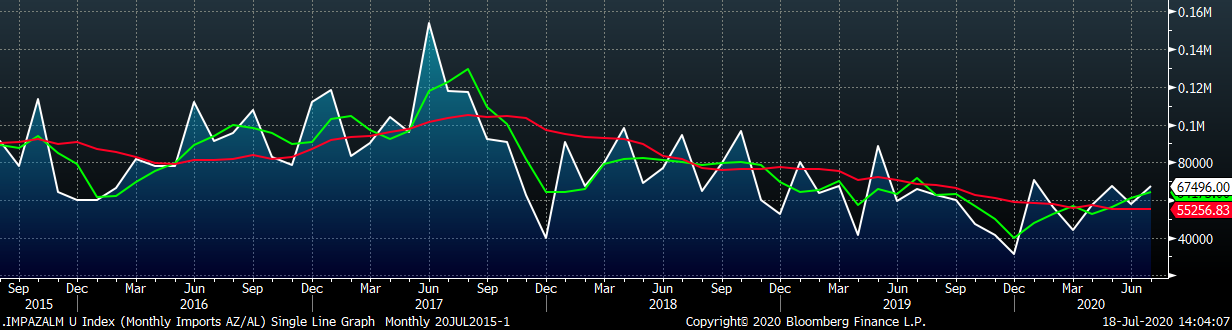
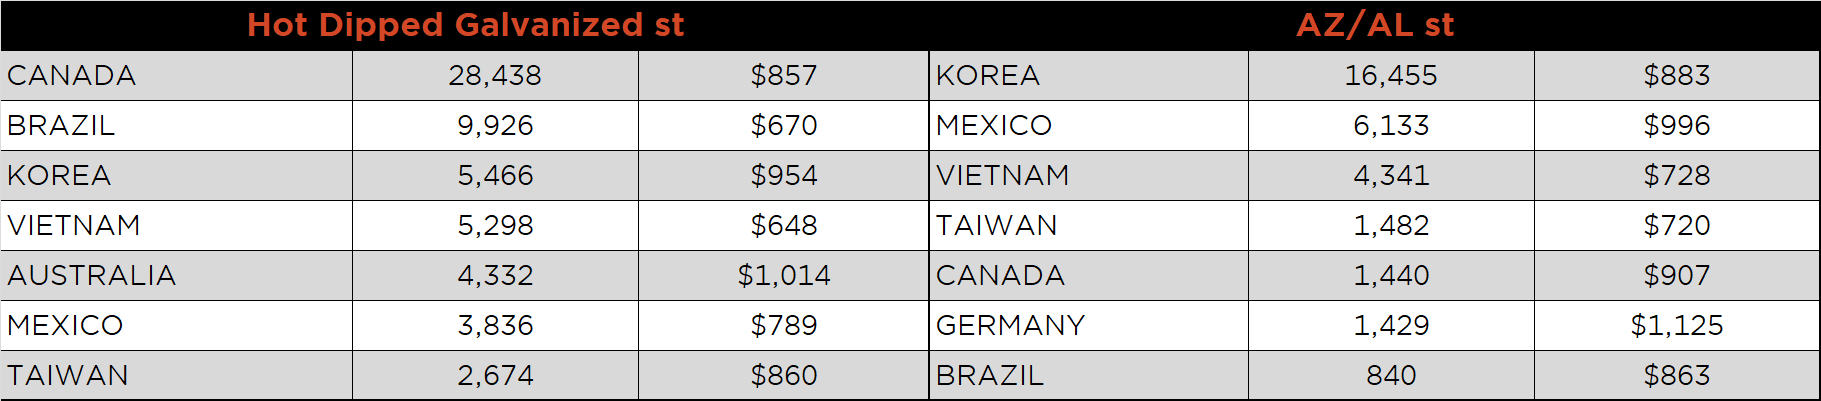
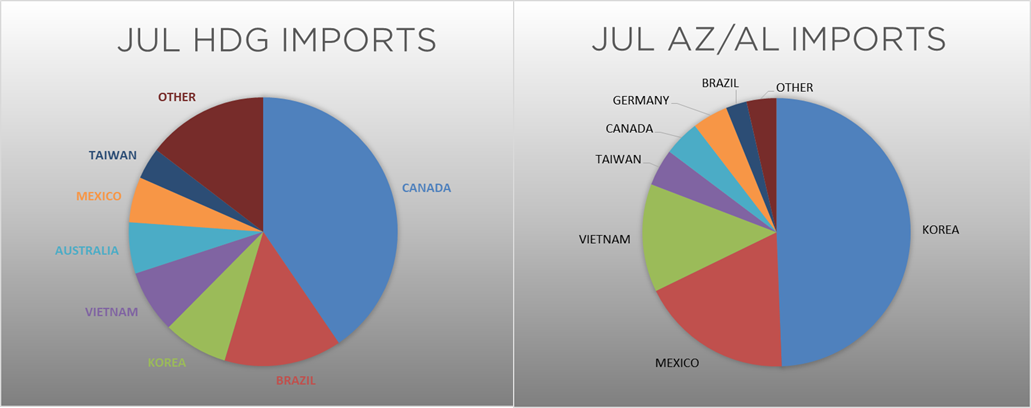
AZ/AL import license data is forecasting an increase of 10k to 67k MoM.
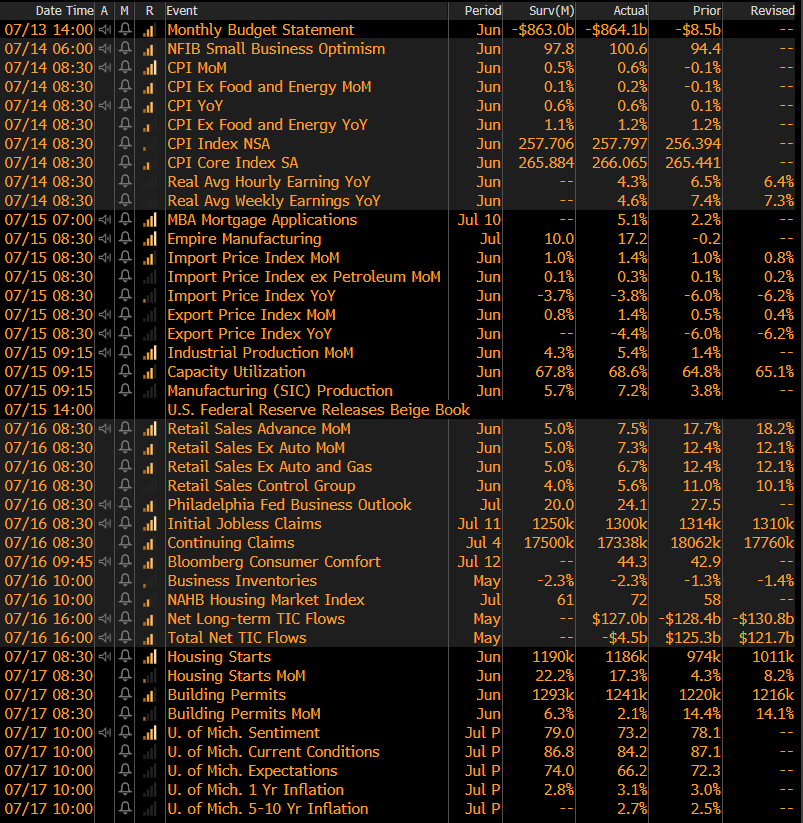
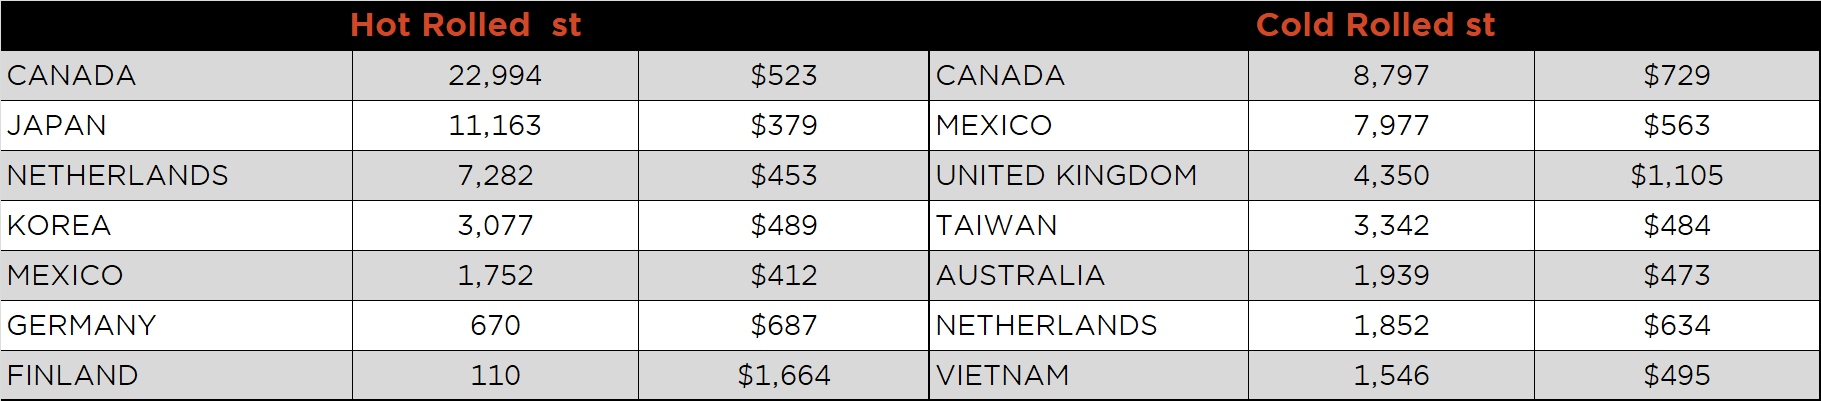
Below is July import license data through July 14, 2020.
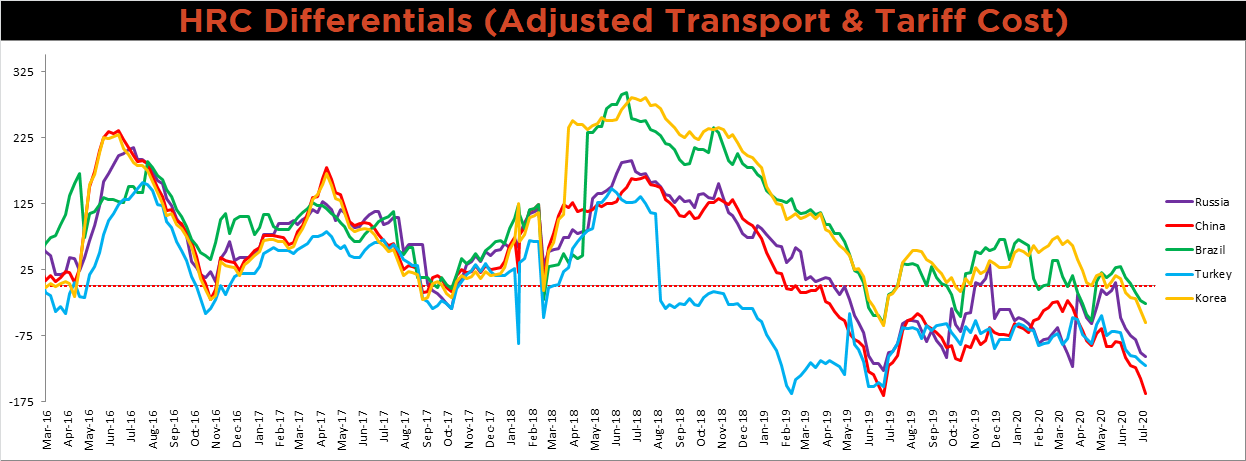
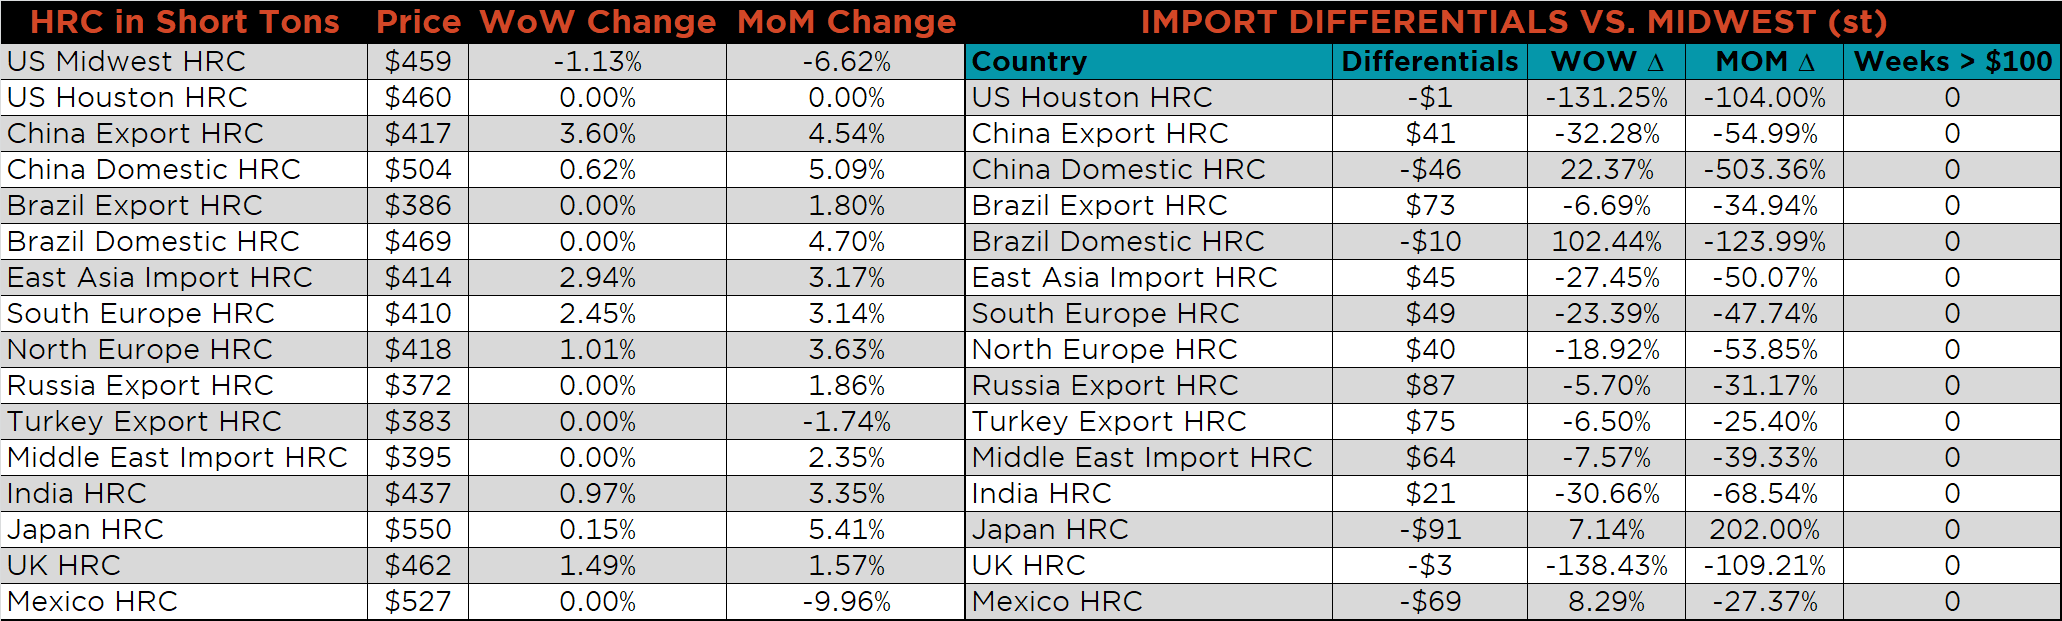
Below is the Midwest HRC price vs. each listed country’s export price using pricing from SBB Platts. We have adjusted each export price to include any tariff or transportation cost to get a comparable delivered price. All the global differentials decreased, as the U.S. price continues to fall. The Chinese differential is just above its lowest historic level as Chinese HRC prices continue to increase.
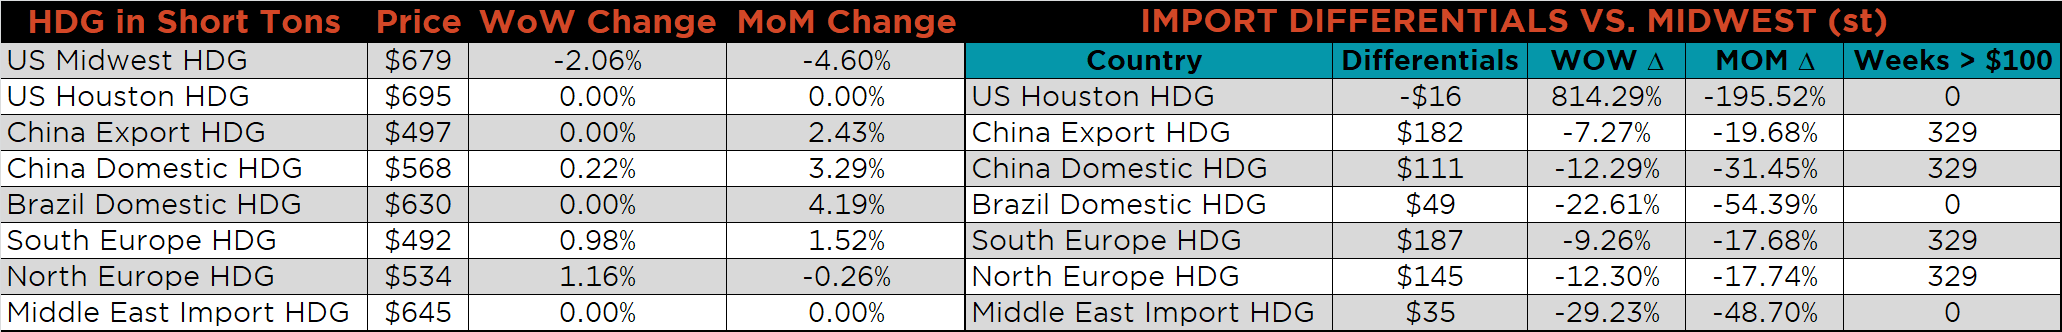
SBB Platt’s HRC, CRC and HDG pricing is below. The Midwest CRC, HDG and HRC prices were down 2.2%, 2.1% and 1.1%, respectively. Globally, the Chinese export HRC and CRC prices were up, 3.6% and 2.4%, respectively.
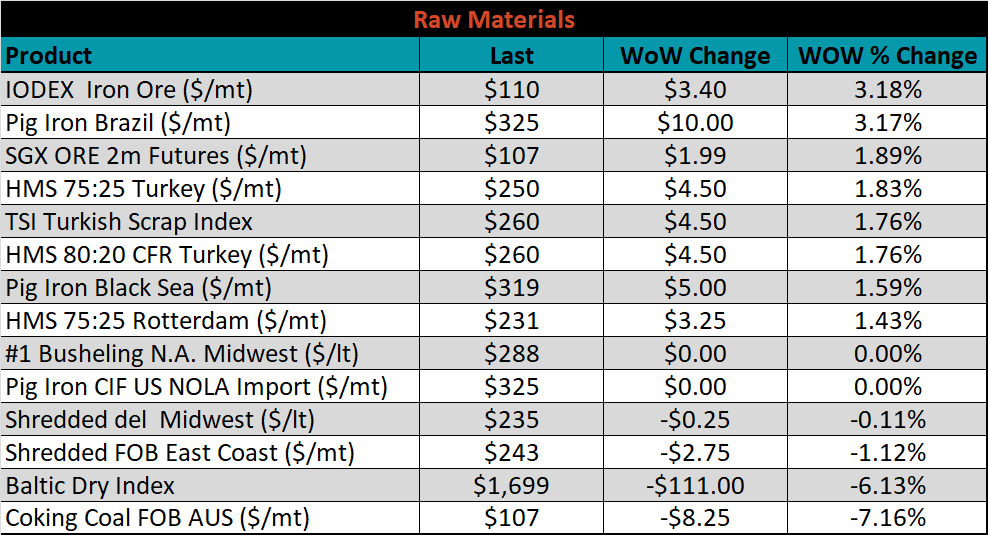
Raw material prices were mixed. The IODEX and Brazilian pig iron were each up 3.2%, respectively, while Australian coking coal was down 7.2%.
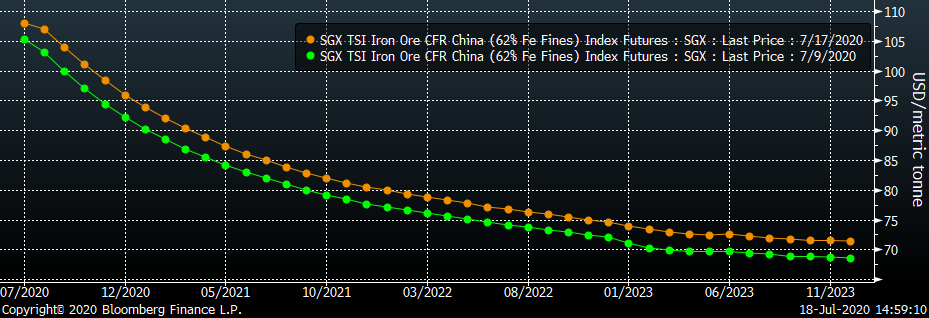
Below is the iron ore future curve with Friday’s settlements in orange, and the prior week’s settlements in green. The entire curve shifted higher by nearly the same amount compared to last week.
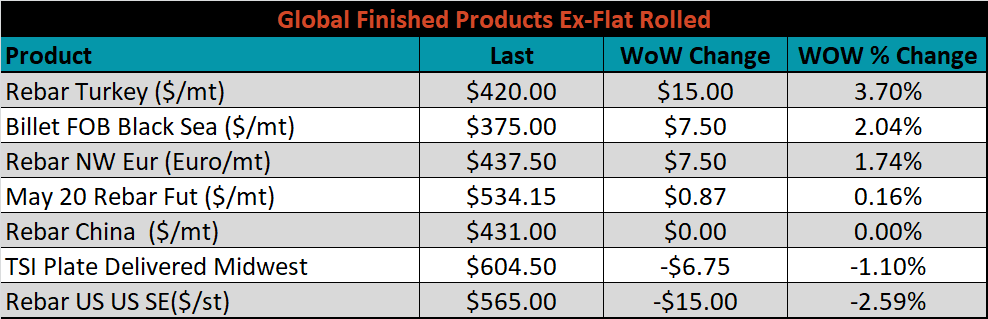
The ex-flat rolled prices are listed below.

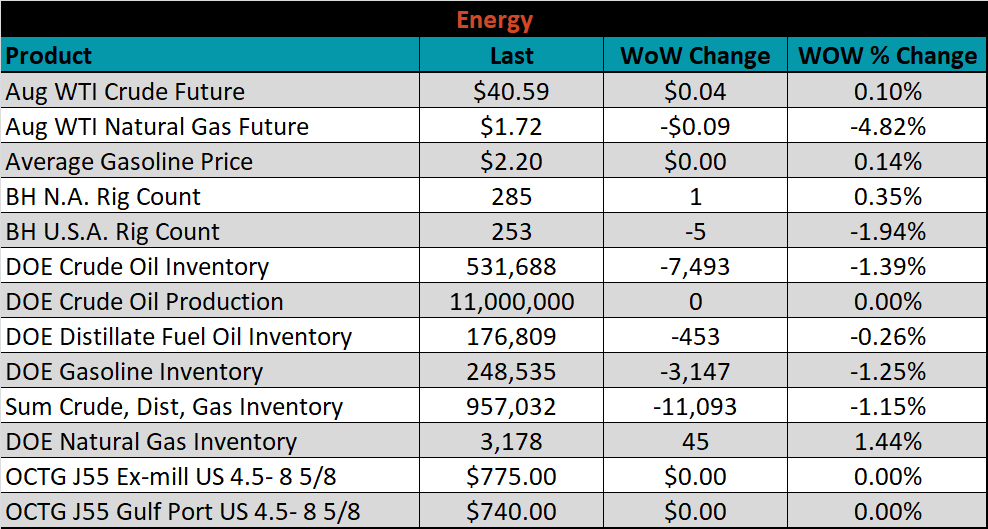
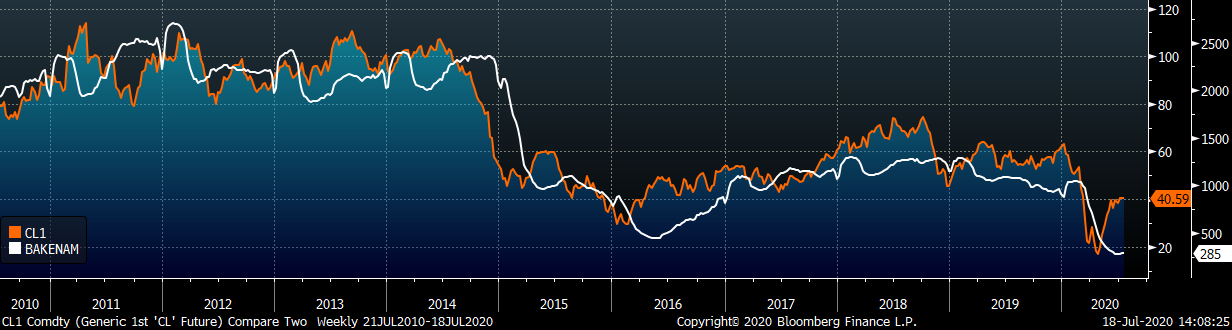
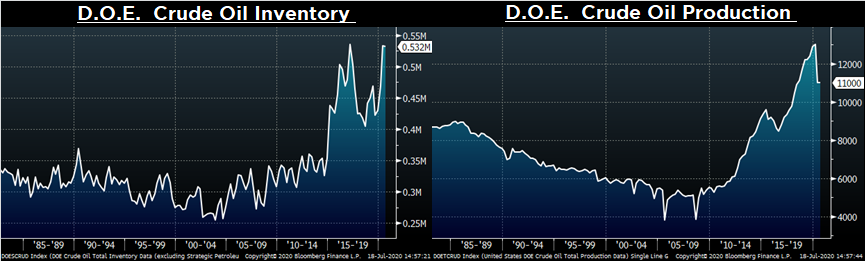
Last week, the August WTI crude oil future gained $0.04 or 0.1% to $40.59/bbl. The aggregate inventory level was down 1.2%, while crude oil production flat at 11m bbl/day. The Baker Hughes North American rig count was up one rig, while the U.S. rig count was down another five rigs.
The list below details some upside and downside risks relevant to the steel industry. The orange ones are occurring or look to be highly likely. The upside risks look to be in control.
Upside Risks:
Downside Risks: