Content
-
Weekly Highlights
- Market Commentary
- Risk


Towards the end of the first quarter of this year, price increase announcements briefly stabilized domestic steel pricing as some believed a bottom was forming. We know now that was not the case, and HRC prices have fallen almost $200/st since then. Just this week, mills pushed a third round of price increases, hoping to build momentum to push HRC prices above $600 before upcoming contract negotiations. What is different now in the market that gives support to these increases that was absent in the first quarter?
During the end of 2018 and much of 2019, there was an environment of destocking that occurred across the steel supply chain. Service centers were selling material without replacing it, end users bought only what they needed for immediate use, and mills were stuck with holes in order books forcing them to chase prices lower. Inventory rightsizing, along with reduced shipments, reflected the decline in apparent demand – material ordered rather than real demand, which measures the material that is actually used. However, real demand has remained steady throughout 2019, which supports the notion that the current market dynamics, low inventories and steady demand, are supportive of the current price increase announcements. Additionally, low (and declining) interest rates make it cheaper to hold material, which would support any restocking moving forward.
In the first half of 2019, large quantities of semi-finished material was imported from Brazil, which is subject to a quota rather than a tariff. While sheet import levels began to decline in 2019, it has taken several months for the material that was imported in late 2018 to work its way through supply chains and into finished product. To account for this time lag, we view net imports (imported tons minus exported tons) in the chart below as a trailing 12-month total through the end of May.
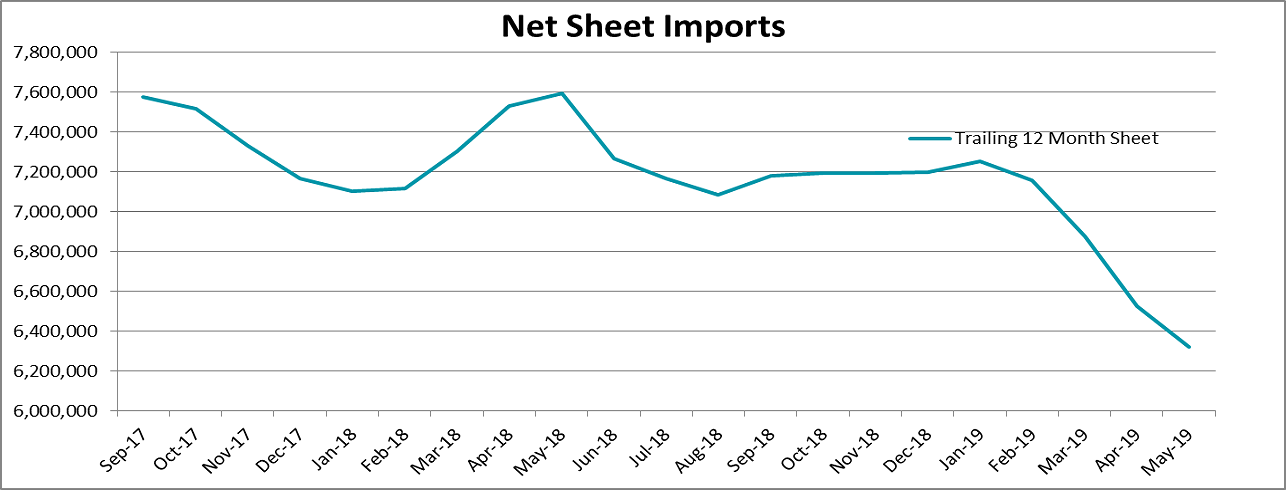
The trailing 12 month sum didn’t reach the current low levels until the second quarter, and pricing differentials indicate that imports should decline further into the third quarter. Additionally, Brazil is nearing its annual quota based on year-to-date census and license data. Therefore, we would expect this trend to continue into the third quarter, leaving the domestic market in a steel short environment with a deficit of over 1 million annual tons compared to last year. This is certainly a different dynamic than we saw in the beginning of the year, and would support the current, and possibly future, price increases.

Below are the most pertinent upside and downside price risks:
Upside Risks:
Downside Risks:

The Platts TSI Daily Midwest HRC Index was up $2.50 to $556.75.

The CME Midwest HRC futures curve is shown below with last Friday’s settlements in white. The curve moved slightly higher across all expirations.

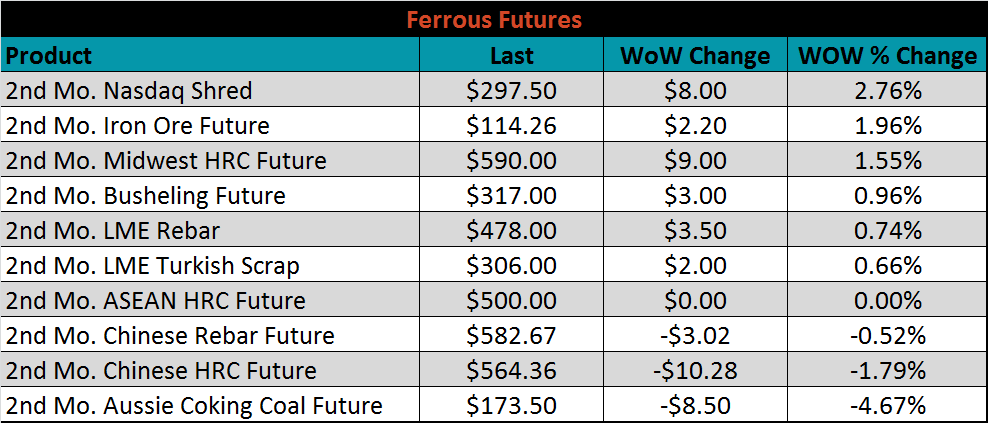
July ferrous futures were mixed. The Nasdaq shred future gained another 2.8%, while coking coal lost 4.7%.
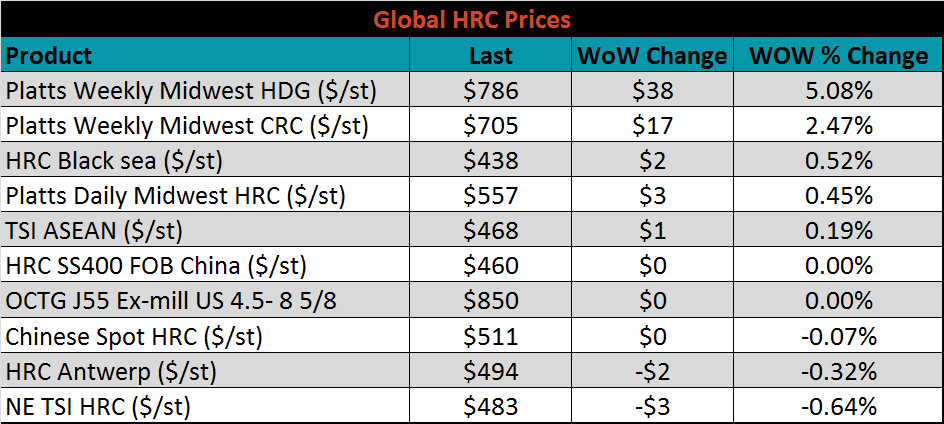
The global flat rolled indexes were mixed. Platts Midwest HDG index was up 5.1%.
The AISI Capacity Utilization Rate rose 0.8% last week to 80.2% bouncing back above the 80% goal set by the Trump administration. Raw steel production moved higher this week after 4 weeks of declining. Increasing prices, and profitability, should support increasing production moving forward.


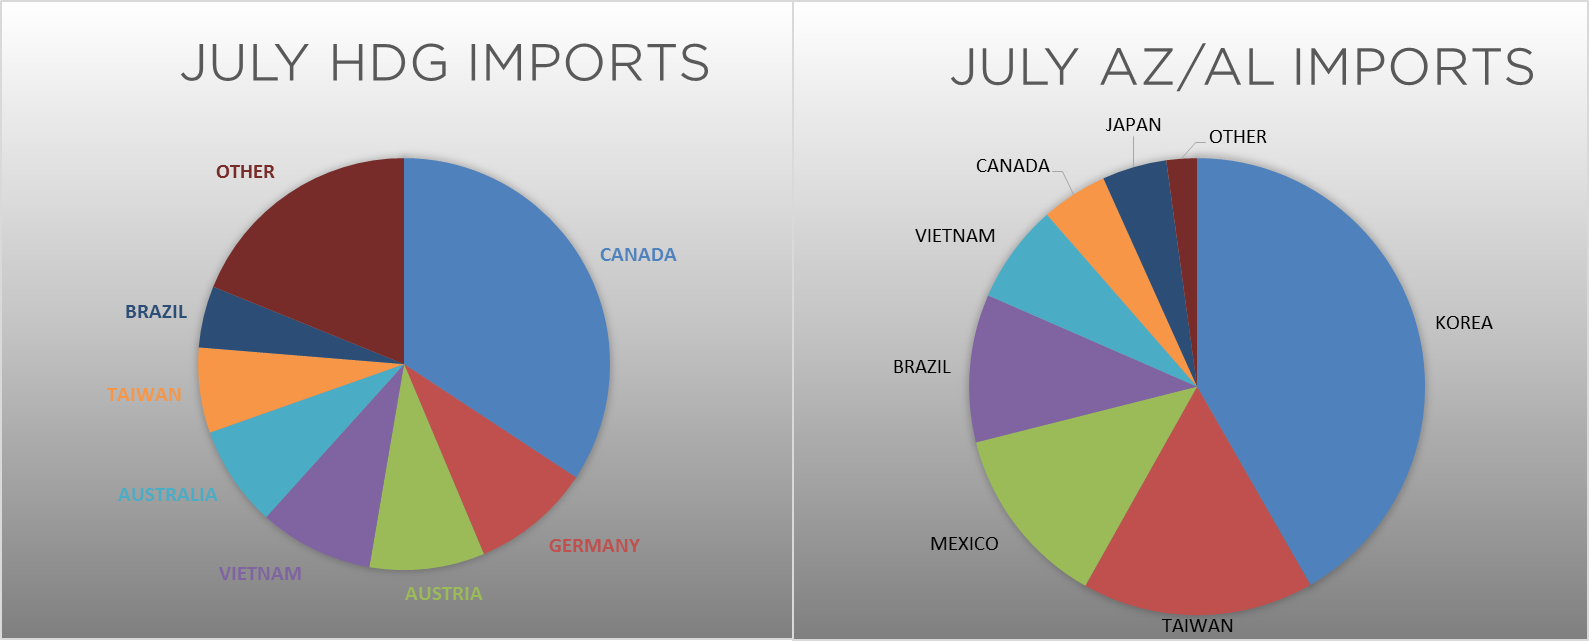
July flat rolled import license data is forecasting an increase to 752k, up 51k MoM.

Tube import license data is forecasting a MoM increase of 27k to 552k tons in July.


AZ/AL import licenses forecast an increase of 13k MoM to 70k in July.

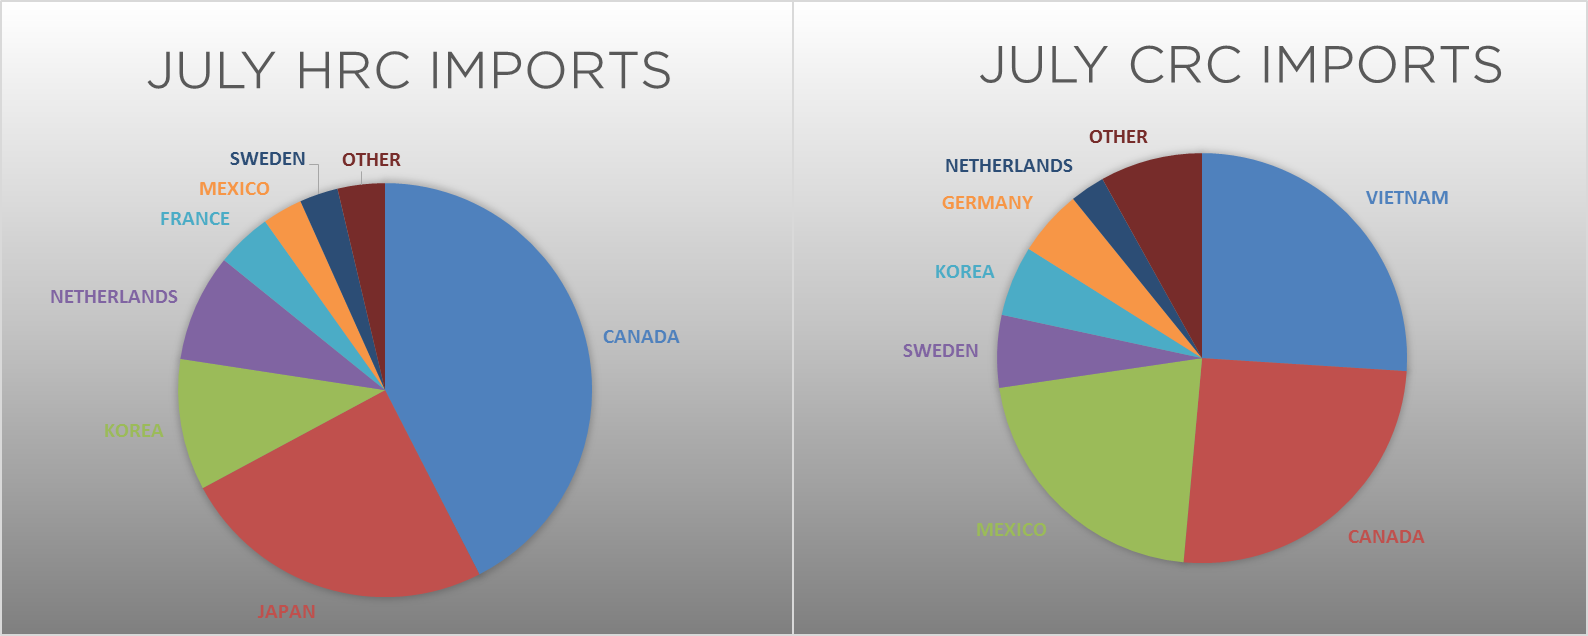
Below is June import license data through July 16, 2019.


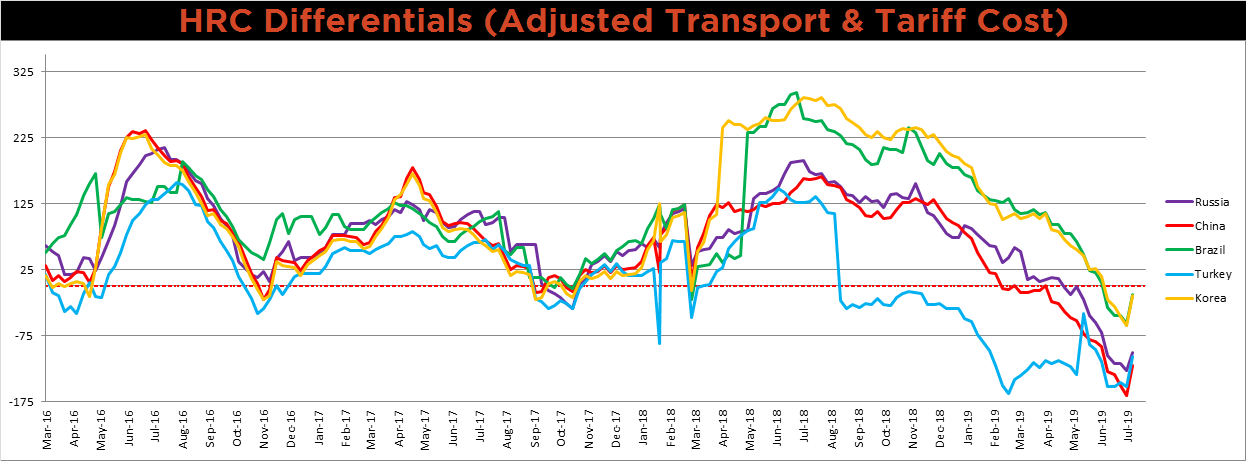
Below is the Midwest HRC price vs. each listed country’s export price using pricing from SBB Platts. We have adjusted each export price to include any tariff or transportation cost to get a comparable delivered price. The price differentials all moved higher as the domestic price continues to rise against the relatively stable global market.
SBB Platt’s HRC, CRC and HDG pricing is below. Midwest HDG, CRC and HRC were all higher on the week, up 5.1%, 2.5% and 0.5%, respectively. Southern European HRC and HDG prices were down 4.4% and 2.3%, respectively.


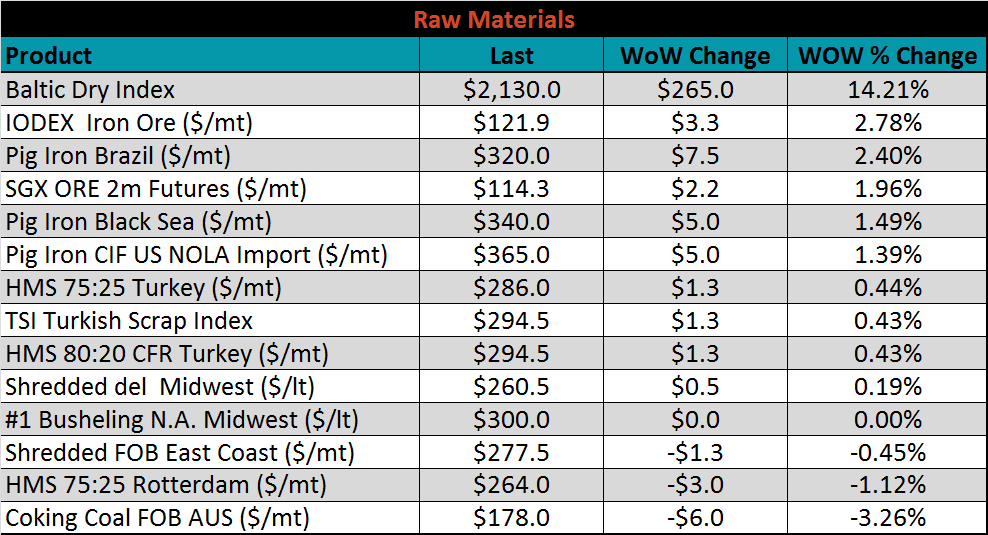
Raw material prices were mixed with the IODEX up 2.8%, and coking coal down 3.3%. The Baltic Dry Index has increased significantly over the last few months due to restarted mining in Brazil by Vale following the Brumadinho dam disaster in January. Therefore, increases in this index don’t necessarily indicate improving global demand.
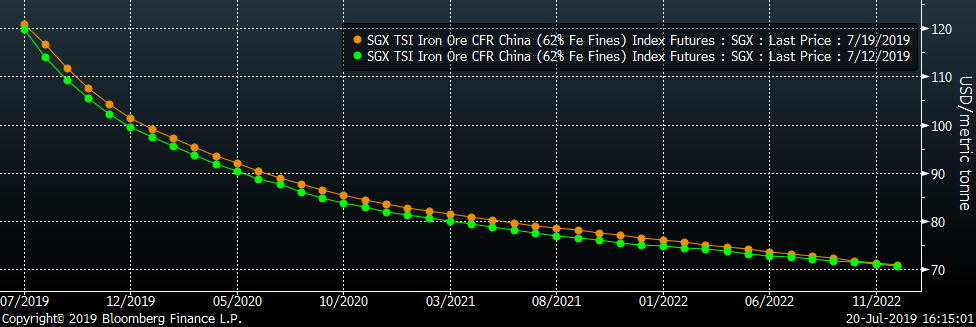
Below is the iron ore future curve with Friday’s settlments in orange, and the prior week’s settlements in green.
The ex-flat rolled prices are listed below.


Below are inventory levels for Chinese finished steel products and iron ore. Each of the inventory levels increased on the week. The HRC inventory level has increased by more than 100k over the last three weeks and is at the highest level for July since 2015. Iron ore inventory levels have begun to stabilize as Vale ramps up shipments out of Brazil following the Brucutu mine closure during the first half of the year. It will be interesting to see how much ore restocking occurs before winter production cuts in China.


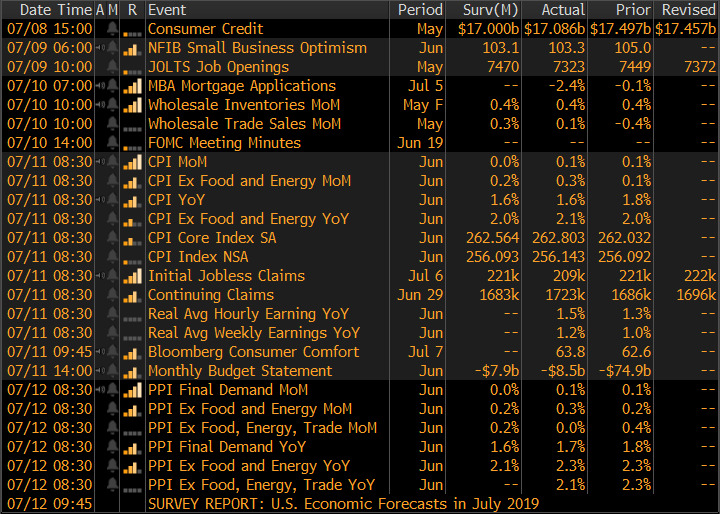
The remainder of the pertinent economic data is to the right. The upcoming FOMC decision remains the talk of Wall Street and Washington D.C. The market has received all but a guarantee for a rate cut from FED chair Jerome Powell and other voting members at next week’s FOMC meeting. Lower rates should be supportive for the general economy, and provide additional working capital funding for many steel intensive sectors.


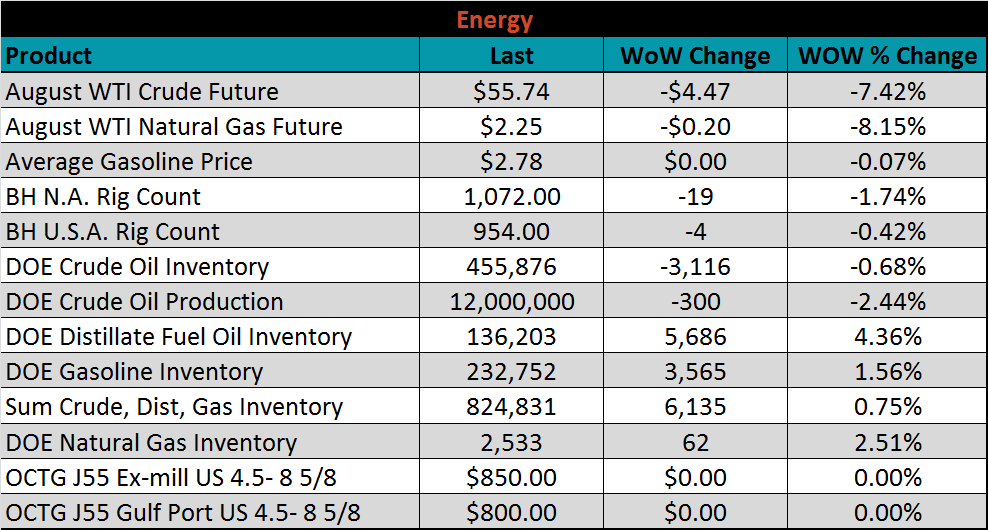
Last week, the Aug WTI crude oil future lost $4.47 or 7.4% to $55.74/bbl. The aggregate inventory level was up 0.8%, and crude oil production fell to 12.0m bbl/day. The Baker Hughes North American rig count lost 19 rigs and the U.S. count lost another four rigs. The decline in the crude oil price this week came after the price rose last week on fears of the storm in the Gulf of Mexico. The storm largely failed to affect production, but geopolitical risks in the Middle East remain an upside risk.


The list below details some upside and downside risks relevant to the steel industry. The orange ones are occurring or look to be highly likely. The upside risks look to be in control.
Upside Risks:
Downside Risks: